

Key Insights
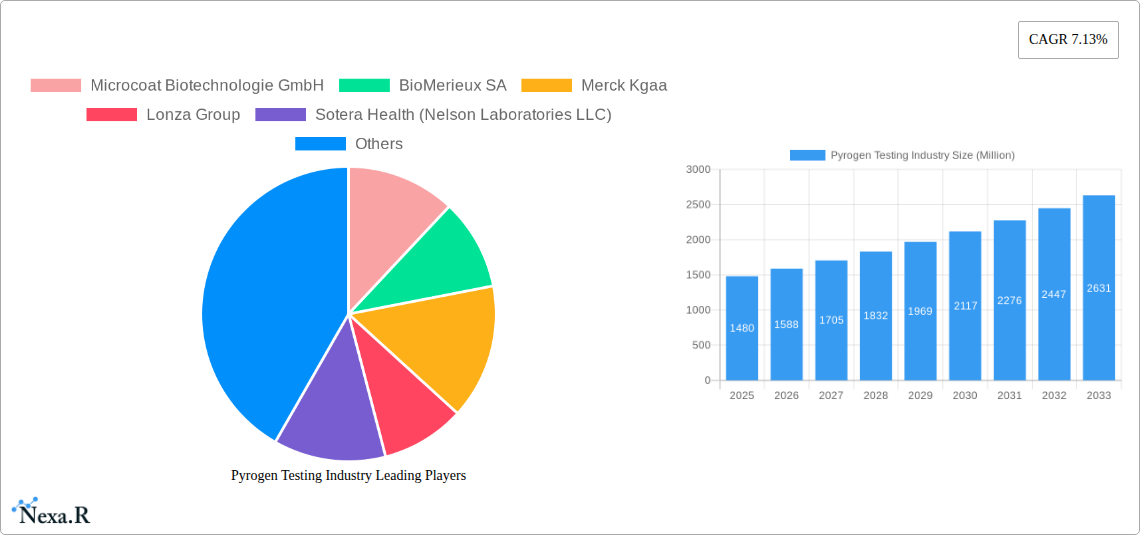
The pyrogen testing market, valued at $1.48 billion in 2025, is projected to experience robust growth, driven by increasing pharmaceutical and biotechnology product development, stringent regulatory requirements for product safety, and rising prevalence of infectious diseases. The market's Compound Annual Growth Rate (CAGR) of 7.13% from 2019 to 2024 indicates a steadily expanding demand for pyrogen testing services and products. Key growth drivers include the rising adoption of advanced testing methods like the monocyte activation test (MAT) which offers enhanced sensitivity and specificity compared to traditional rabbit pyrogen tests. The increasing outsourcing of testing to specialized contract research organizations (CROs) further fuels market expansion. The segment comprising kits and reagents holds a significant market share due to their ease of use and cost-effectiveness, while the pharmaceutical and biotechnology companies segment dominates end-user demand.
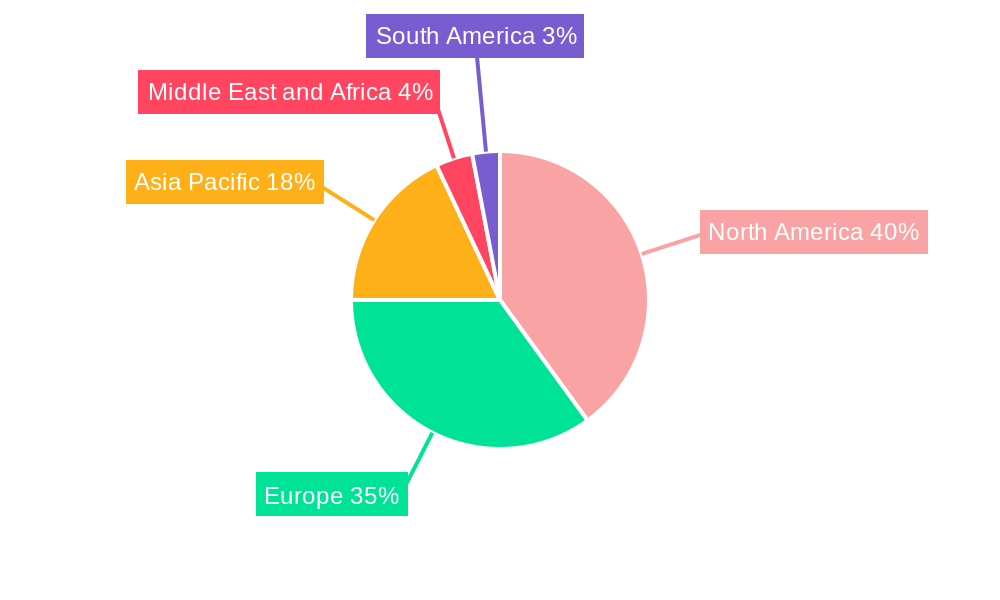
Technological advancements leading to the development of automated and high-throughput pyrogen testing systems are transforming the industry landscape. This trend is complemented by a growing focus on developing rapid and reliable pyrogen detection methods. However, the market faces certain restraints such as the high cost of advanced testing technologies and the potential for variability in test results across different laboratories. Despite these challenges, the expanding global pharmaceutical and biotechnology sectors, along with increasing regulatory scrutiny, ensures the continued growth of the pyrogen testing market through 2033. Regional variations in market growth are anticipated, with North America and Europe likely maintaining a strong market position due to well-established regulatory frameworks and advanced healthcare infrastructure. The Asia-Pacific region is expected to witness significant growth, driven by increasing pharmaceutical production and investment in healthcare infrastructure.
Pyrogen Testing Industry Market Report: 2019-2033
This comprehensive report provides an in-depth analysis of the Pyrogen Testing industry, encompassing market dynamics, growth trends, regional dominance, product landscapes, and key players. The study period covers 2019-2033, with a base year of 2025 and a forecast period of 2025-2033. The report is essential for industry professionals, investors, and researchers seeking to understand this crucial sector within the broader pharmaceutical and biotechnology markets. The total market size in 2025 is estimated at xx Million.
Pyrogen Testing Industry Market Dynamics & Structure
The pyrogen testing market is characterized by a moderately concentrated landscape, with key players holding significant market share. Technological innovation, driven by the need for faster, more sensitive, and automated testing methods, is a key driver of growth. Stringent regulatory frameworks, particularly from agencies like the FDA and EMA, significantly influence market practices and product development. Competitive substitutes, such as alternative pyrogen detection methods, are present but often lack the widespread acceptance of established techniques like the LAL test. The end-user demographics are largely dominated by pharmaceutical and biotechnology companies, followed by medical device manufacturers. M&A activity within the sector has been moderate, with several key players strategically acquiring smaller companies to expand their product portfolios and geographical reach. The predicted number of M&A deals between 2025 and 2033 is xx.
- Market Concentration: Moderately concentrated, with top 5 players holding approximately xx% market share in 2025.
- Technological Innovation: Focus on automation, high-throughput screening, and improved sensitivity.
- Regulatory Landscape: Stringent regulations drive demand for validated and reliable testing methods.
- Competitive Substitutes: Limited but growing competition from alternative technologies.
- End-User Demographics: Pharmaceutical and biotechnology companies represent the largest segment.
- M&A Activity: Moderate level of consolidation, driven by strategic expansion goals.
Pyrogen Testing Industry Growth Trends & Insights
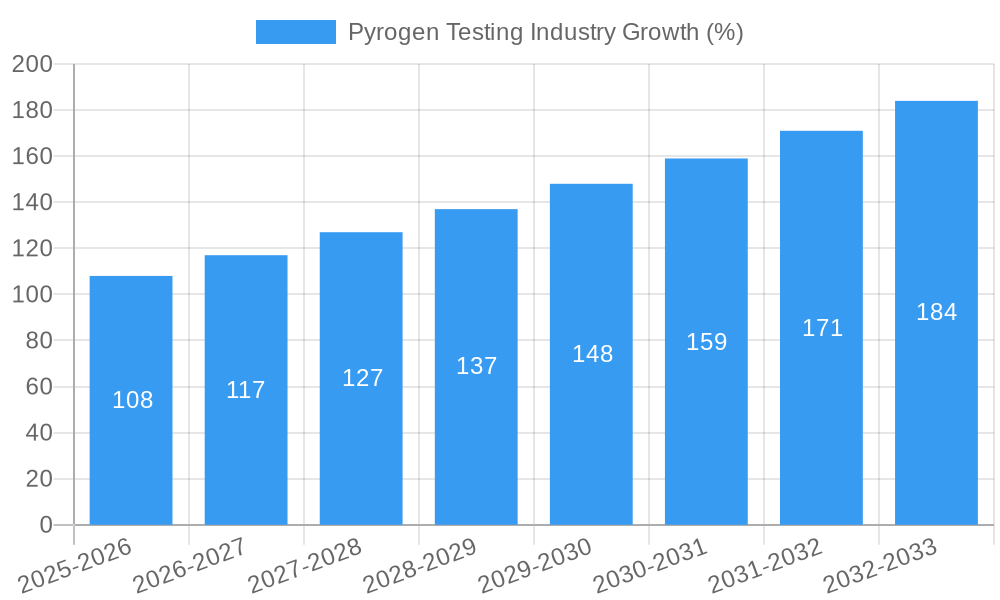
The pyrogen testing market exhibits robust growth, driven by increasing pharmaceutical and biotechnological product development, stricter regulatory compliance requirements, and the rising adoption of advanced testing technologies. The market size has shown a steady increase over the historical period (2019-2024), exhibiting a CAGR of xx% and is projected to maintain a healthy growth trajectory during the forecast period (2025-2033) with an estimated CAGR of xx%. This growth is fueled by the increasing demand for LAL tests, which are becoming the gold standard for pyrogen detection in many applications. Market penetration of automated systems is also increasing, further driving growth in the overall market size. Consumer behavior shifts towards greater reliance on validated testing methods, ensuring product safety, contribute to sustained market expansion. The rising prevalence of chronic diseases and the associated increased demand for pharmaceuticals and biologics indirectly boost demand for reliable pyrogen testing solutions.
Dominant Regions, Countries, or Segments in Pyrogen Testing Industry
North America currently holds the largest market share in the pyrogen testing industry, driven by a robust pharmaceutical and biotechnology sector, coupled with stringent regulatory compliance requirements. Europe follows closely, with strong growth expected in emerging economies in Asia-Pacific. Within the segments, LAL tests dominate the market, owing to their high sensitivity, ease of use, and widespread acceptance. The pharmaceutical and biotechnology end-user segment represents the largest portion of the market, reflecting the critical role of pyrogen testing in drug development and manufacturing. The increasing adoption of advanced testing methods, such as the Monocyte Activation Test (MAT), is driving segment growth.
- Key Drivers: Stringent regulatory standards in North America and Europe, increasing pharmaceutical production in Asia-Pacific, growing demand for biologics.
- North America: Largest market share due to a highly developed pharmaceutical industry and stringent regulations.
- Europe: Strong market presence driven by established pharmaceutical companies and regulatory frameworks.
- Asia-Pacific: Significant growth potential driven by emerging economies and increasing pharmaceutical manufacturing.
- LAL Tests: Dominates the test type segment due to wide adoption and established reliability.
- Pharmaceutical & Biotechnology Companies: Largest end-user segment due to crucial role in drug manufacturing.
Pyrogen Testing Industry Product Landscape
The pyrogen testing product landscape is characterized by a range of kits, reagents, instruments, and services. Continuous innovations focus on improving sensitivity, reducing testing time, and automating workflows. Products are differentiated by their ease of use, accuracy, throughput, and cost-effectiveness. Technological advancements include the development of automated systems, microfluidic devices, and improved reagents for enhanced detection capabilities. Key players are continuously striving to enhance the performance metrics of their products to meet the evolving needs of the market. This includes better sensitivity, reduced assay times and overall better usability.
Key Drivers, Barriers & Challenges in Pyrogen Testing Industry
Key Drivers:
- Increasing demand for biologics and biosimilars
- Stringent regulatory requirements for pyrogen testing
- Growing adoption of advanced testing methods like MAT
- Technological advancements improving speed and sensitivity of tests
Challenges & Restraints:
- High cost of advanced testing technologies limiting access for smaller companies.
- Complex regulatory approvals processes slowing down product launches.
- Potential for supply chain disruptions impacting reagent availability.
- Competition from alternative pyrogen detection methods.
Emerging Opportunities in Pyrogen Testing Industry
Emerging opportunities lie in the development of rapid, point-of-care pyrogen testing devices, expanding into emerging markets, and catering to the growing demand for personalized medicine. The development of novel testing methods with improved sensitivity and specificity presents significant growth potential. Furthermore, exploring new applications in areas like medical devices and cosmetics represents an untapped market. Focus on developing cost-effective and user-friendly solutions will cater to a wider range of users.
Growth Accelerators in the Pyrogen Testing Industry
Technological breakthroughs, particularly in automation and miniaturization, are key growth catalysts. Strategic partnerships and collaborations between test providers and pharmaceutical companies accelerate the adoption of new technologies. Expansion into emerging markets and untapped applications, coupled with continuous product innovation to meet evolving regulatory requirements, will fuel long-term growth.
Key Players Shaping the Pyrogen Testing Industry Market
- Microcoat Biotechnologie GmbH
- BioMerieux SA
- Merck Kgaa
- Lonza Group
- Sotera Health (Nelson Laboratories LLC)
- Fujifilm Holdings Corporation (FUJIFILM Wako Pure Chemical Corporation)
- Eurofins Scientific
- Thermo Fisher Scientific Inc
- WUXI Pharmatech (Cayman) Inc
- Genscript
- Associates of Cape Cod Inc (Seikagaku Biobusiness Corporation)
- Charles River Laboratories Inc
- Sanquin
- Pyrostar
- Ellab AS
Notable Milestones in Pyrogen Testing Industry Sector
- 2021: Launch of a new automated LAL testing system by Thermo Fisher Scientific.
- 2022: Acquisition of a smaller pyrogen testing company by BioMerieux SA.
- 2023: FDA approval of a novel pyrogen detection method. (Further milestones can be added based on available data)
In-Depth Pyrogen Testing Industry Market Outlook
The pyrogen testing market is poised for continued growth, driven by technological advancements, increasing regulatory scrutiny, and expanding applications. Strategic partnerships, targeted investments in R&D, and aggressive market expansion strategies will be key to maximizing future market potential. The focus on improved sensitivity, speed, and automation will attract larger market shares and establish technological leadership in the industry. The market presents promising strategic opportunities for companies capable of adapting to the evolving needs of the industry.
Pyrogen Testing Industry Segmentation
-
1. Product
- 1.1. Kits and Reagents
- 1.2. Services
- 1.3. Instruments
-
2. Test Type
-
2.1. LAL Tests
- 2.1.1. Chromogenic Tests
- 2.1.2. Turbidimetric Tests
- 2.1.3. Gel Clot Tests
- 2.2. Rabbit Pyrogen Test
- 2.3. Monocyte Activation Test
- 2.4. Other Test Types
-
2.1. LAL Tests
-
3. End User
- 3.1. Pharmaceutical and Biotechnology Companies
- 3.2. Medical Device Companies
- 3.3. Other End Users
Pyrogen Testing Industry Segmentation By Geography
-
1. North America
- 1.1. United States
- 1.2. Canada
- 1.3. Mexico
-
2. Europe
- 2.1. Germany
- 2.2. United Kingdom
- 2.3. France
- 2.4. Italy
- 2.5. Spain
- 2.6. Rest of Europe
-
3. Asia Pacific
- 3.1. China
- 3.2. Japan
- 3.3. India
- 3.4. Australia
- 3.5. South Korea
- 3.6. Rest of Asia Pacific
-
4. Middle East and Africa
- 4.1. GCC
- 4.2. South Africa
- 4.3. Rest of Middle East and Africa
-
5. South America
- 5.1. Brazil
- 5.2. Argentina
- 5.3. Rest of South America
Pyrogen Testing Industry REPORT HIGHLIGHTS
| Aspects | Details |
|---|---|
| Study Period | 2019-2033 |
| Base Year | 2024 |
| Estimated Year | 2025 |
| Forecast Period | 2025-2033 |
| Historical Period | 2019-2024 |
| Growth Rate | CAGR of 7.13% from 2019-2033 |
| Segmentation |
|
Table of Contents
- 1. Introduction
- 1.1. Research Scope
- 1.2. Market Segmentation
- 1.3. Research Methodology
- 1.4. Definitions and Assumptions
- 2. Executive Summary
- 2.1. Introduction
- 3. Market Dynamics
- 3.1. Introduction
- 3.2. Market Drivers
- 3.2.1. Rapid Growth in Pharmaceutical and Biotechnology Industries; Rising R&D Expenditure in Life Science
- 3.3. Market Restrains
- 3.3.1. Stringent Government Regulations
- 3.4. Market Trends
- 3.4.1. The Monocyte Activation Test Segment is Expected to Witness Good Growth Over the Forecast Period
- 4. Market Factor Analysis
- 4.1. Porters Five Forces
- 4.2. Supply/Value Chain
- 4.3. PESTEL analysis
- 4.4. Market Entropy
- 4.5. Patent/Trademark Analysis
- 5. Global Pyrogen Testing Industry Analysis, Insights and Forecast, 2019-2031
- 5.1. Market Analysis, Insights and Forecast - by Product
- 5.1.1. Kits and Reagents
- 5.1.2. Services
- 5.1.3. Instruments
- 5.2. Market Analysis, Insights and Forecast - by Test Type
- 5.2.1. LAL Tests
- 5.2.1.1. Chromogenic Tests
- 5.2.1.2. Turbidimetric Tests
- 5.2.1.3. Gel Clot Tests
- 5.2.2. Rabbit Pyrogen Test
- 5.2.3. Monocyte Activation Test
- 5.2.4. Other Test Types
- 5.2.1. LAL Tests
- 5.3. Market Analysis, Insights and Forecast - by End User
- 5.3.1. Pharmaceutical and Biotechnology Companies
- 5.3.2. Medical Device Companies
- 5.3.3. Other End Users
- 5.4. Market Analysis, Insights and Forecast - by Region
- 5.4.1. North America
- 5.4.2. Europe
- 5.4.3. Asia Pacific
- 5.4.4. Middle East and Africa
- 5.4.5. South America
- 5.1. Market Analysis, Insights and Forecast - by Product
- 6. North America Pyrogen Testing Industry Analysis, Insights and Forecast, 2019-2031
- 6.1. Market Analysis, Insights and Forecast - by Product
- 6.1.1. Kits and Reagents
- 6.1.2. Services
- 6.1.3. Instruments
- 6.2. Market Analysis, Insights and Forecast - by Test Type
- 6.2.1. LAL Tests
- 6.2.1.1. Chromogenic Tests
- 6.2.1.2. Turbidimetric Tests
- 6.2.1.3. Gel Clot Tests
- 6.2.2. Rabbit Pyrogen Test
- 6.2.3. Monocyte Activation Test
- 6.2.4. Other Test Types
- 6.2.1. LAL Tests
- 6.3. Market Analysis, Insights and Forecast - by End User
- 6.3.1. Pharmaceutical and Biotechnology Companies
- 6.3.2. Medical Device Companies
- 6.3.3. Other End Users
- 6.1. Market Analysis, Insights and Forecast - by Product
- 7. Europe Pyrogen Testing Industry Analysis, Insights and Forecast, 2019-2031
- 7.1. Market Analysis, Insights and Forecast - by Product
- 7.1.1. Kits and Reagents
- 7.1.2. Services
- 7.1.3. Instruments
- 7.2. Market Analysis, Insights and Forecast - by Test Type
- 7.2.1. LAL Tests
- 7.2.1.1. Chromogenic Tests
- 7.2.1.2. Turbidimetric Tests
- 7.2.1.3. Gel Clot Tests
- 7.2.2. Rabbit Pyrogen Test
- 7.2.3. Monocyte Activation Test
- 7.2.4. Other Test Types
- 7.2.1. LAL Tests
- 7.3. Market Analysis, Insights and Forecast - by End User
- 7.3.1. Pharmaceutical and Biotechnology Companies
- 7.3.2. Medical Device Companies
- 7.3.3. Other End Users
- 7.1. Market Analysis, Insights and Forecast - by Product
- 8. Asia Pacific Pyrogen Testing Industry Analysis, Insights and Forecast, 2019-2031
- 8.1. Market Analysis, Insights and Forecast - by Product
- 8.1.1. Kits and Reagents
- 8.1.2. Services
- 8.1.3. Instruments
- 8.2. Market Analysis, Insights and Forecast - by Test Type
- 8.2.1. LAL Tests
- 8.2.1.1. Chromogenic Tests
- 8.2.1.2. Turbidimetric Tests
- 8.2.1.3. Gel Clot Tests
- 8.2.2. Rabbit Pyrogen Test
- 8.2.3. Monocyte Activation Test
- 8.2.4. Other Test Types
- 8.2.1. LAL Tests
- 8.3. Market Analysis, Insights and Forecast - by End User
- 8.3.1. Pharmaceutical and Biotechnology Companies
- 8.3.2. Medical Device Companies
- 8.3.3. Other End Users
- 8.1. Market Analysis, Insights and Forecast - by Product
- 9. Middle East and Africa Pyrogen Testing Industry Analysis, Insights and Forecast, 2019-2031
- 9.1. Market Analysis, Insights and Forecast - by Product
- 9.1.1. Kits and Reagents
- 9.1.2. Services
- 9.1.3. Instruments
- 9.2. Market Analysis, Insights and Forecast - by Test Type
- 9.2.1. LAL Tests
- 9.2.1.1. Chromogenic Tests
- 9.2.1.2. Turbidimetric Tests
- 9.2.1.3. Gel Clot Tests
- 9.2.2. Rabbit Pyrogen Test
- 9.2.3. Monocyte Activation Test
- 9.2.4. Other Test Types
- 9.2.1. LAL Tests
- 9.3. Market Analysis, Insights and Forecast - by End User
- 9.3.1. Pharmaceutical and Biotechnology Companies
- 9.3.2. Medical Device Companies
- 9.3.3. Other End Users
- 9.1. Market Analysis, Insights and Forecast - by Product
- 10. South America Pyrogen Testing Industry Analysis, Insights and Forecast, 2019-2031
- 10.1. Market Analysis, Insights and Forecast - by Product
- 10.1.1. Kits and Reagents
- 10.1.2. Services
- 10.1.3. Instruments
- 10.2. Market Analysis, Insights and Forecast - by Test Type
- 10.2.1. LAL Tests
- 10.2.1.1. Chromogenic Tests
- 10.2.1.2. Turbidimetric Tests
- 10.2.1.3. Gel Clot Tests
- 10.2.2. Rabbit Pyrogen Test
- 10.2.3. Monocyte Activation Test
- 10.2.4. Other Test Types
- 10.2.1. LAL Tests
- 10.3. Market Analysis, Insights and Forecast - by End User
- 10.3.1. Pharmaceutical and Biotechnology Companies
- 10.3.2. Medical Device Companies
- 10.3.3. Other End Users
- 10.1. Market Analysis, Insights and Forecast - by Product
- 11. North America Pyrogen Testing Industry Analysis, Insights and Forecast, 2019-2031
- 11.1. Market Analysis, Insights and Forecast - By Country/Sub-region
- 11.1.1. undefined
- 12. Europe Pyrogen Testing Industry Analysis, Insights and Forecast, 2019-2031
- 12.1. Market Analysis, Insights and Forecast - By Country/Sub-region
- 12.1.1. undefined
- 13. Asia Pacific Pyrogen Testing Industry Analysis, Insights and Forecast, 2019-2031
- 13.1. Market Analysis, Insights and Forecast - By Country/Sub-region
- 13.1.1. undefined
- 14. Middle East and Africa Pyrogen Testing Industry Analysis, Insights and Forecast, 2019-2031
- 14.1. Market Analysis, Insights and Forecast - By Country/Sub-region
- 14.1.1. undefined
- 15. South America Pyrogen Testing Industry Analysis, Insights and Forecast, 2019-2031
- 15.1. Market Analysis, Insights and Forecast - By Country/Sub-region
- 15.1.1. undefined
- 16. Competitive Analysis
- 16.1. Global Market Share Analysis 2024
- 16.2. Company Profiles
- 16.2.1 Microcoat Biotechnologie GmbH
- 16.2.1.1. Overview
- 16.2.1.2. Products
- 16.2.1.3. SWOT Analysis
- 16.2.1.4. Recent Developments
- 16.2.1.5. Financials (Based on Availability)
- 16.2.2 BioMerieux SA
- 16.2.2.1. Overview
- 16.2.2.2. Products
- 16.2.2.3. SWOT Analysis
- 16.2.2.4. Recent Developments
- 16.2.2.5. Financials (Based on Availability)
- 16.2.3 Merck Kgaa
- 16.2.3.1. Overview
- 16.2.3.2. Products
- 16.2.3.3. SWOT Analysis
- 16.2.3.4. Recent Developments
- 16.2.3.5. Financials (Based on Availability)
- 16.2.4 Lonza Group
- 16.2.4.1. Overview
- 16.2.4.2. Products
- 16.2.4.3. SWOT Analysis
- 16.2.4.4. Recent Developments
- 16.2.4.5. Financials (Based on Availability)
- 16.2.5 Sotera Health (Nelson Laboratories LLC)
- 16.2.5.1. Overview
- 16.2.5.2. Products
- 16.2.5.3. SWOT Analysis
- 16.2.5.4. Recent Developments
- 16.2.5.5. Financials (Based on Availability)
- 16.2.6 Fujifilm Holdings Corporation (FUJIFILM Wako Pure Chemical Corporation)
- 16.2.6.1. Overview
- 16.2.6.2. Products
- 16.2.6.3. SWOT Analysis
- 16.2.6.4. Recent Developments
- 16.2.6.5. Financials (Based on Availability)
- 16.2.7 Eurofins Scientific
- 16.2.7.1. Overview
- 16.2.7.2. Products
- 16.2.7.3. SWOT Analysis
- 16.2.7.4. Recent Developments
- 16.2.7.5. Financials (Based on Availability)
- 16.2.8 Thermo Fisher Scientific Inc
- 16.2.8.1. Overview
- 16.2.8.2. Products
- 16.2.8.3. SWOT Analysis
- 16.2.8.4. Recent Developments
- 16.2.8.5. Financials (Based on Availability)
- 16.2.9 WUXI Pharmatech (Cayman) Inc
- 16.2.9.1. Overview
- 16.2.9.2. Products
- 16.2.9.3. SWOT Analysis
- 16.2.9.4. Recent Developments
- 16.2.9.5. Financials (Based on Availability)
- 16.2.10 Genscript
- 16.2.10.1. Overview
- 16.2.10.2. Products
- 16.2.10.3. SWOT Analysis
- 16.2.10.4. Recent Developments
- 16.2.10.5. Financials (Based on Availability)
- 16.2.11 Associates of Cape Cod Inc (Seikagaku Biobusiness Corporation)
- 16.2.11.1. Overview
- 16.2.11.2. Products
- 16.2.11.3. SWOT Analysis
- 16.2.11.4. Recent Developments
- 16.2.11.5. Financials (Based on Availability)
- 16.2.12 Microcoat Biotechnologie GmbH
- 16.2.12.1. Overview
- 16.2.12.2. Products
- 16.2.12.3. SWOT Analysis
- 16.2.12.4. Recent Developments
- 16.2.12.5. Financials (Based on Availability)
- 16.2.13 Charles River Laboratories Inc
- 16.2.13.1. Overview
- 16.2.13.2. Products
- 16.2.13.3. SWOT Analysis
- 16.2.13.4. Recent Developments
- 16.2.13.5. Financials (Based on Availability)
- 16.2.14 Sanquin
- 16.2.14.1. Overview
- 16.2.14.2. Products
- 16.2.14.3. SWOT Analysis
- 16.2.14.4. Recent Developments
- 16.2.14.5. Financials (Based on Availability)
- 16.2.15 Pyrostar
- 16.2.15.1. Overview
- 16.2.15.2. Products
- 16.2.15.3. SWOT Analysis
- 16.2.15.4. Recent Developments
- 16.2.15.5. Financials (Based on Availability)
- 16.2.16 Ellab AS
- 16.2.16.1. Overview
- 16.2.16.2. Products
- 16.2.16.3. SWOT Analysis
- 16.2.16.4. Recent Developments
- 16.2.16.5. Financials (Based on Availability)
- 16.2.1 Microcoat Biotechnologie GmbH
List of Figures
- Figure 1: Global Pyrogen Testing Industry Revenue Breakdown (Million, %) by Region 2024 & 2032
- Figure 2: Global Pyrogen Testing Industry Volume Breakdown (K Unit, %) by Region 2024 & 2032
- Figure 3: North America Pyrogen Testing Industry Revenue (Million), by Country 2024 & 2032
- Figure 4: North America Pyrogen Testing Industry Volume (K Unit), by Country 2024 & 2032
- Figure 5: North America Pyrogen Testing Industry Revenue Share (%), by Country 2024 & 2032
- Figure 6: North America Pyrogen Testing Industry Volume Share (%), by Country 2024 & 2032
- Figure 7: Europe Pyrogen Testing Industry Revenue (Million), by Country 2024 & 2032
- Figure 8: Europe Pyrogen Testing Industry Volume (K Unit), by Country 2024 & 2032
- Figure 9: Europe Pyrogen Testing Industry Revenue Share (%), by Country 2024 & 2032
- Figure 10: Europe Pyrogen Testing Industry Volume Share (%), by Country 2024 & 2032
- Figure 11: Asia Pacific Pyrogen Testing Industry Revenue (Million), by Country 2024 & 2032
- Figure 12: Asia Pacific Pyrogen Testing Industry Volume (K Unit), by Country 2024 & 2032
- Figure 13: Asia Pacific Pyrogen Testing Industry Revenue Share (%), by Country 2024 & 2032
- Figure 14: Asia Pacific Pyrogen Testing Industry Volume Share (%), by Country 2024 & 2032
- Figure 15: Middle East and Africa Pyrogen Testing Industry Revenue (Million), by Country 2024 & 2032
- Figure 16: Middle East and Africa Pyrogen Testing Industry Volume (K Unit), by Country 2024 & 2032
- Figure 17: Middle East and Africa Pyrogen Testing Industry Revenue Share (%), by Country 2024 & 2032
- Figure 18: Middle East and Africa Pyrogen Testing Industry Volume Share (%), by Country 2024 & 2032
- Figure 19: South America Pyrogen Testing Industry Revenue (Million), by Country 2024 & 2032
- Figure 20: South America Pyrogen Testing Industry Volume (K Unit), by Country 2024 & 2032
- Figure 21: South America Pyrogen Testing Industry Revenue Share (%), by Country 2024 & 2032
- Figure 22: South America Pyrogen Testing Industry Volume Share (%), by Country 2024 & 2032
- Figure 23: North America Pyrogen Testing Industry Revenue (Million), by Product 2024 & 2032
- Figure 24: North America Pyrogen Testing Industry Volume (K Unit), by Product 2024 & 2032
- Figure 25: North America Pyrogen Testing Industry Revenue Share (%), by Product 2024 & 2032
- Figure 26: North America Pyrogen Testing Industry Volume Share (%), by Product 2024 & 2032
- Figure 27: North America Pyrogen Testing Industry Revenue (Million), by Test Type 2024 & 2032
- Figure 28: North America Pyrogen Testing Industry Volume (K Unit), by Test Type 2024 & 2032
- Figure 29: North America Pyrogen Testing Industry Revenue Share (%), by Test Type 2024 & 2032
- Figure 30: North America Pyrogen Testing Industry Volume Share (%), by Test Type 2024 & 2032
- Figure 31: North America Pyrogen Testing Industry Revenue (Million), by End User 2024 & 2032
- Figure 32: North America Pyrogen Testing Industry Volume (K Unit), by End User 2024 & 2032
- Figure 33: North America Pyrogen Testing Industry Revenue Share (%), by End User 2024 & 2032
- Figure 34: North America Pyrogen Testing Industry Volume Share (%), by End User 2024 & 2032
- Figure 35: North America Pyrogen Testing Industry Revenue (Million), by Country 2024 & 2032
- Figure 36: North America Pyrogen Testing Industry Volume (K Unit), by Country 2024 & 2032
- Figure 37: North America Pyrogen Testing Industry Revenue Share (%), by Country 2024 & 2032
- Figure 38: North America Pyrogen Testing Industry Volume Share (%), by Country 2024 & 2032
- Figure 39: Europe Pyrogen Testing Industry Revenue (Million), by Product 2024 & 2032
- Figure 40: Europe Pyrogen Testing Industry Volume (K Unit), by Product 2024 & 2032
- Figure 41: Europe Pyrogen Testing Industry Revenue Share (%), by Product 2024 & 2032
- Figure 42: Europe Pyrogen Testing Industry Volume Share (%), by Product 2024 & 2032
- Figure 43: Europe Pyrogen Testing Industry Revenue (Million), by Test Type 2024 & 2032
- Figure 44: Europe Pyrogen Testing Industry Volume (K Unit), by Test Type 2024 & 2032
- Figure 45: Europe Pyrogen Testing Industry Revenue Share (%), by Test Type 2024 & 2032
- Figure 46: Europe Pyrogen Testing Industry Volume Share (%), by Test Type 2024 & 2032
- Figure 47: Europe Pyrogen Testing Industry Revenue (Million), by End User 2024 & 2032
- Figure 48: Europe Pyrogen Testing Industry Volume (K Unit), by End User 2024 & 2032
- Figure 49: Europe Pyrogen Testing Industry Revenue Share (%), by End User 2024 & 2032
- Figure 50: Europe Pyrogen Testing Industry Volume Share (%), by End User 2024 & 2032
- Figure 51: Europe Pyrogen Testing Industry Revenue (Million), by Country 2024 & 2032
- Figure 52: Europe Pyrogen Testing Industry Volume (K Unit), by Country 2024 & 2032
- Figure 53: Europe Pyrogen Testing Industry Revenue Share (%), by Country 2024 & 2032
- Figure 54: Europe Pyrogen Testing Industry Volume Share (%), by Country 2024 & 2032
- Figure 55: Asia Pacific Pyrogen Testing Industry Revenue (Million), by Product 2024 & 2032
- Figure 56: Asia Pacific Pyrogen Testing Industry Volume (K Unit), by Product 2024 & 2032
- Figure 57: Asia Pacific Pyrogen Testing Industry Revenue Share (%), by Product 2024 & 2032
- Figure 58: Asia Pacific Pyrogen Testing Industry Volume Share (%), by Product 2024 & 2032
- Figure 59: Asia Pacific Pyrogen Testing Industry Revenue (Million), by Test Type 2024 & 2032
- Figure 60: Asia Pacific Pyrogen Testing Industry Volume (K Unit), by Test Type 2024 & 2032
- Figure 61: Asia Pacific Pyrogen Testing Industry Revenue Share (%), by Test Type 2024 & 2032
- Figure 62: Asia Pacific Pyrogen Testing Industry Volume Share (%), by Test Type 2024 & 2032
- Figure 63: Asia Pacific Pyrogen Testing Industry Revenue (Million), by End User 2024 & 2032
- Figure 64: Asia Pacific Pyrogen Testing Industry Volume (K Unit), by End User 2024 & 2032
- Figure 65: Asia Pacific Pyrogen Testing Industry Revenue Share (%), by End User 2024 & 2032
- Figure 66: Asia Pacific Pyrogen Testing Industry Volume Share (%), by End User 2024 & 2032
- Figure 67: Asia Pacific Pyrogen Testing Industry Revenue (Million), by Country 2024 & 2032
- Figure 68: Asia Pacific Pyrogen Testing Industry Volume (K Unit), by Country 2024 & 2032
- Figure 69: Asia Pacific Pyrogen Testing Industry Revenue Share (%), by Country 2024 & 2032
- Figure 70: Asia Pacific Pyrogen Testing Industry Volume Share (%), by Country 2024 & 2032
- Figure 71: Middle East and Africa Pyrogen Testing Industry Revenue (Million), by Product 2024 & 2032
- Figure 72: Middle East and Africa Pyrogen Testing Industry Volume (K Unit), by Product 2024 & 2032
- Figure 73: Middle East and Africa Pyrogen Testing Industry Revenue Share (%), by Product 2024 & 2032
- Figure 74: Middle East and Africa Pyrogen Testing Industry Volume Share (%), by Product 2024 & 2032
- Figure 75: Middle East and Africa Pyrogen Testing Industry Revenue (Million), by Test Type 2024 & 2032
- Figure 76: Middle East and Africa Pyrogen Testing Industry Volume (K Unit), by Test Type 2024 & 2032
- Figure 77: Middle East and Africa Pyrogen Testing Industry Revenue Share (%), by Test Type 2024 & 2032
- Figure 78: Middle East and Africa Pyrogen Testing Industry Volume Share (%), by Test Type 2024 & 2032
- Figure 79: Middle East and Africa Pyrogen Testing Industry Revenue (Million), by End User 2024 & 2032
- Figure 80: Middle East and Africa Pyrogen Testing Industry Volume (K Unit), by End User 2024 & 2032
- Figure 81: Middle East and Africa Pyrogen Testing Industry Revenue Share (%), by End User 2024 & 2032
- Figure 82: Middle East and Africa Pyrogen Testing Industry Volume Share (%), by End User 2024 & 2032
- Figure 83: Middle East and Africa Pyrogen Testing Industry Revenue (Million), by Country 2024 & 2032
- Figure 84: Middle East and Africa Pyrogen Testing Industry Volume (K Unit), by Country 2024 & 2032
- Figure 85: Middle East and Africa Pyrogen Testing Industry Revenue Share (%), by Country 2024 & 2032
- Figure 86: Middle East and Africa Pyrogen Testing Industry Volume Share (%), by Country 2024 & 2032
- Figure 87: South America Pyrogen Testing Industry Revenue (Million), by Product 2024 & 2032
- Figure 88: South America Pyrogen Testing Industry Volume (K Unit), by Product 2024 & 2032
- Figure 89: South America Pyrogen Testing Industry Revenue Share (%), by Product 2024 & 2032
- Figure 90: South America Pyrogen Testing Industry Volume Share (%), by Product 2024 & 2032
- Figure 91: South America Pyrogen Testing Industry Revenue (Million), by Test Type 2024 & 2032
- Figure 92: South America Pyrogen Testing Industry Volume (K Unit), by Test Type 2024 & 2032
- Figure 93: South America Pyrogen Testing Industry Revenue Share (%), by Test Type 2024 & 2032
- Figure 94: South America Pyrogen Testing Industry Volume Share (%), by Test Type 2024 & 2032
- Figure 95: South America Pyrogen Testing Industry Revenue (Million), by End User 2024 & 2032
- Figure 96: South America Pyrogen Testing Industry Volume (K Unit), by End User 2024 & 2032
- Figure 97: South America Pyrogen Testing Industry Revenue Share (%), by End User 2024 & 2032
- Figure 98: South America Pyrogen Testing Industry Volume Share (%), by End User 2024 & 2032
- Figure 99: South America Pyrogen Testing Industry Revenue (Million), by Country 2024 & 2032
- Figure 100: South America Pyrogen Testing Industry Volume (K Unit), by Country 2024 & 2032
- Figure 101: South America Pyrogen Testing Industry Revenue Share (%), by Country 2024 & 2032
- Figure 102: South America Pyrogen Testing Industry Volume Share (%), by Country 2024 & 2032
List of Tables
- Table 1: Global Pyrogen Testing Industry Revenue Million Forecast, by Region 2019 & 2032
- Table 2: Global Pyrogen Testing Industry Volume K Unit Forecast, by Region 2019 & 2032
- Table 3: Global Pyrogen Testing Industry Revenue Million Forecast, by Product 2019 & 2032
- Table 4: Global Pyrogen Testing Industry Volume K Unit Forecast, by Product 2019 & 2032
- Table 5: Global Pyrogen Testing Industry Revenue Million Forecast, by Test Type 2019 & 2032
- Table 6: Global Pyrogen Testing Industry Volume K Unit Forecast, by Test Type 2019 & 2032
- Table 7: Global Pyrogen Testing Industry Revenue Million Forecast, by End User 2019 & 2032
- Table 8: Global Pyrogen Testing Industry Volume K Unit Forecast, by End User 2019 & 2032
- Table 9: Global Pyrogen Testing Industry Revenue Million Forecast, by Region 2019 & 2032
- Table 10: Global Pyrogen Testing Industry Volume K Unit Forecast, by Region 2019 & 2032
- Table 11: Global Pyrogen Testing Industry Revenue Million Forecast, by Country 2019 & 2032
- Table 12: Global Pyrogen Testing Industry Volume K Unit Forecast, by Country 2019 & 2032
- Table 13: Global Pyrogen Testing Industry Revenue Million Forecast, by Country 2019 & 2032
- Table 14: Global Pyrogen Testing Industry Volume K Unit Forecast, by Country 2019 & 2032
- Table 15: Global Pyrogen Testing Industry Revenue Million Forecast, by Country 2019 & 2032
- Table 16: Global Pyrogen Testing Industry Volume K Unit Forecast, by Country 2019 & 2032
- Table 17: Global Pyrogen Testing Industry Revenue Million Forecast, by Country 2019 & 2032
- Table 18: Global Pyrogen Testing Industry Volume K Unit Forecast, by Country 2019 & 2032
- Table 19: Global Pyrogen Testing Industry Revenue Million Forecast, by Country 2019 & 2032
- Table 20: Global Pyrogen Testing Industry Volume K Unit Forecast, by Country 2019 & 2032
- Table 21: Global Pyrogen Testing Industry Revenue Million Forecast, by Product 2019 & 2032
- Table 22: Global Pyrogen Testing Industry Volume K Unit Forecast, by Product 2019 & 2032
- Table 23: Global Pyrogen Testing Industry Revenue Million Forecast, by Test Type 2019 & 2032
- Table 24: Global Pyrogen Testing Industry Volume K Unit Forecast, by Test Type 2019 & 2032
- Table 25: Global Pyrogen Testing Industry Revenue Million Forecast, by End User 2019 & 2032
- Table 26: Global Pyrogen Testing Industry Volume K Unit Forecast, by End User 2019 & 2032
- Table 27: Global Pyrogen Testing Industry Revenue Million Forecast, by Country 2019 & 2032
- Table 28: Global Pyrogen Testing Industry Volume K Unit Forecast, by Country 2019 & 2032
- Table 29: United States Pyrogen Testing Industry Revenue (Million) Forecast, by Application 2019 & 2032
- Table 30: United States Pyrogen Testing Industry Volume (K Unit) Forecast, by Application 2019 & 2032
- Table 31: Canada Pyrogen Testing Industry Revenue (Million) Forecast, by Application 2019 & 2032
- Table 32: Canada Pyrogen Testing Industry Volume (K Unit) Forecast, by Application 2019 & 2032
- Table 33: Mexico Pyrogen Testing Industry Revenue (Million) Forecast, by Application 2019 & 2032
- Table 34: Mexico Pyrogen Testing Industry Volume (K Unit) Forecast, by Application 2019 & 2032
- Table 35: Global Pyrogen Testing Industry Revenue Million Forecast, by Product 2019 & 2032
- Table 36: Global Pyrogen Testing Industry Volume K Unit Forecast, by Product 2019 & 2032
- Table 37: Global Pyrogen Testing Industry Revenue Million Forecast, by Test Type 2019 & 2032
- Table 38: Global Pyrogen Testing Industry Volume K Unit Forecast, by Test Type 2019 & 2032
- Table 39: Global Pyrogen Testing Industry Revenue Million Forecast, by End User 2019 & 2032
- Table 40: Global Pyrogen Testing Industry Volume K Unit Forecast, by End User 2019 & 2032
- Table 41: Global Pyrogen Testing Industry Revenue Million Forecast, by Country 2019 & 2032
- Table 42: Global Pyrogen Testing Industry Volume K Unit Forecast, by Country 2019 & 2032
- Table 43: Germany Pyrogen Testing Industry Revenue (Million) Forecast, by Application 2019 & 2032
- Table 44: Germany Pyrogen Testing Industry Volume (K Unit) Forecast, by Application 2019 & 2032
- Table 45: United Kingdom Pyrogen Testing Industry Revenue (Million) Forecast, by Application 2019 & 2032
- Table 46: United Kingdom Pyrogen Testing Industry Volume (K Unit) Forecast, by Application 2019 & 2032
- Table 47: France Pyrogen Testing Industry Revenue (Million) Forecast, by Application 2019 & 2032
- Table 48: France Pyrogen Testing Industry Volume (K Unit) Forecast, by Application 2019 & 2032
- Table 49: Italy Pyrogen Testing Industry Revenue (Million) Forecast, by Application 2019 & 2032
- Table 50: Italy Pyrogen Testing Industry Volume (K Unit) Forecast, by Application 2019 & 2032
- Table 51: Spain Pyrogen Testing Industry Revenue (Million) Forecast, by Application 2019 & 2032
- Table 52: Spain Pyrogen Testing Industry Volume (K Unit) Forecast, by Application 2019 & 2032
- Table 53: Rest of Europe Pyrogen Testing Industry Revenue (Million) Forecast, by Application 2019 & 2032
- Table 54: Rest of Europe Pyrogen Testing Industry Volume (K Unit) Forecast, by Application 2019 & 2032
- Table 55: Global Pyrogen Testing Industry Revenue Million Forecast, by Product 2019 & 2032
- Table 56: Global Pyrogen Testing Industry Volume K Unit Forecast, by Product 2019 & 2032
- Table 57: Global Pyrogen Testing Industry Revenue Million Forecast, by Test Type 2019 & 2032
- Table 58: Global Pyrogen Testing Industry Volume K Unit Forecast, by Test Type 2019 & 2032
- Table 59: Global Pyrogen Testing Industry Revenue Million Forecast, by End User 2019 & 2032
- Table 60: Global Pyrogen Testing Industry Volume K Unit Forecast, by End User 2019 & 2032
- Table 61: Global Pyrogen Testing Industry Revenue Million Forecast, by Country 2019 & 2032
- Table 62: Global Pyrogen Testing Industry Volume K Unit Forecast, by Country 2019 & 2032
- Table 63: China Pyrogen Testing Industry Revenue (Million) Forecast, by Application 2019 & 2032
- Table 64: China Pyrogen Testing Industry Volume (K Unit) Forecast, by Application 2019 & 2032
- Table 65: Japan Pyrogen Testing Industry Revenue (Million) Forecast, by Application 2019 & 2032
- Table 66: Japan Pyrogen Testing Industry Volume (K Unit) Forecast, by Application 2019 & 2032
- Table 67: India Pyrogen Testing Industry Revenue (Million) Forecast, by Application 2019 & 2032
- Table 68: India Pyrogen Testing Industry Volume (K Unit) Forecast, by Application 2019 & 2032
- Table 69: Australia Pyrogen Testing Industry Revenue (Million) Forecast, by Application 2019 & 2032
- Table 70: Australia Pyrogen Testing Industry Volume (K Unit) Forecast, by Application 2019 & 2032
- Table 71: South Korea Pyrogen Testing Industry Revenue (Million) Forecast, by Application 2019 & 2032
- Table 72: South Korea Pyrogen Testing Industry Volume (K Unit) Forecast, by Application 2019 & 2032
- Table 73: Rest of Asia Pacific Pyrogen Testing Industry Revenue (Million) Forecast, by Application 2019 & 2032
- Table 74: Rest of Asia Pacific Pyrogen Testing Industry Volume (K Unit) Forecast, by Application 2019 & 2032
- Table 75: Global Pyrogen Testing Industry Revenue Million Forecast, by Product 2019 & 2032
- Table 76: Global Pyrogen Testing Industry Volume K Unit Forecast, by Product 2019 & 2032
- Table 77: Global Pyrogen Testing Industry Revenue Million Forecast, by Test Type 2019 & 2032
- Table 78: Global Pyrogen Testing Industry Volume K Unit Forecast, by Test Type 2019 & 2032
- Table 79: Global Pyrogen Testing Industry Revenue Million Forecast, by End User 2019 & 2032
- Table 80: Global Pyrogen Testing Industry Volume K Unit Forecast, by End User 2019 & 2032
- Table 81: Global Pyrogen Testing Industry Revenue Million Forecast, by Country 2019 & 2032
- Table 82: Global Pyrogen Testing Industry Volume K Unit Forecast, by Country 2019 & 2032
- Table 83: GCC Pyrogen Testing Industry Revenue (Million) Forecast, by Application 2019 & 2032
- Table 84: GCC Pyrogen Testing Industry Volume (K Unit) Forecast, by Application 2019 & 2032
- Table 85: South Africa Pyrogen Testing Industry Revenue (Million) Forecast, by Application 2019 & 2032
- Table 86: South Africa Pyrogen Testing Industry Volume (K Unit) Forecast, by Application 2019 & 2032
- Table 87: Rest of Middle East and Africa Pyrogen Testing Industry Revenue (Million) Forecast, by Application 2019 & 2032
- Table 88: Rest of Middle East and Africa Pyrogen Testing Industry Volume (K Unit) Forecast, by Application 2019 & 2032
- Table 89: Global Pyrogen Testing Industry Revenue Million Forecast, by Product 2019 & 2032
- Table 90: Global Pyrogen Testing Industry Volume K Unit Forecast, by Product 2019 & 2032
- Table 91: Global Pyrogen Testing Industry Revenue Million Forecast, by Test Type 2019 & 2032
- Table 92: Global Pyrogen Testing Industry Volume K Unit Forecast, by Test Type 2019 & 2032
- Table 93: Global Pyrogen Testing Industry Revenue Million Forecast, by End User 2019 & 2032
- Table 94: Global Pyrogen Testing Industry Volume K Unit Forecast, by End User 2019 & 2032
- Table 95: Global Pyrogen Testing Industry Revenue Million Forecast, by Country 2019 & 2032
- Table 96: Global Pyrogen Testing Industry Volume K Unit Forecast, by Country 2019 & 2032
- Table 97: Brazil Pyrogen Testing Industry Revenue (Million) Forecast, by Application 2019 & 2032
- Table 98: Brazil Pyrogen Testing Industry Volume (K Unit) Forecast, by Application 2019 & 2032
- Table 99: Argentina Pyrogen Testing Industry Revenue (Million) Forecast, by Application 2019 & 2032
- Table 100: Argentina Pyrogen Testing Industry Volume (K Unit) Forecast, by Application 2019 & 2032
- Table 101: Rest of South America Pyrogen Testing Industry Revenue (Million) Forecast, by Application 2019 & 2032
- Table 102: Rest of South America Pyrogen Testing Industry Volume (K Unit) Forecast, by Application 2019 & 2032
Frequently Asked Questions
1. What is the projected Compound Annual Growth Rate (CAGR) of the Pyrogen Testing Industry?
The projected CAGR is approximately 7.13%.
2. Which companies are prominent players in the Pyrogen Testing Industry?
Key companies in the market include Microcoat Biotechnologie GmbH, BioMerieux SA, Merck Kgaa, Lonza Group, Sotera Health (Nelson Laboratories LLC), Fujifilm Holdings Corporation (FUJIFILM Wako Pure Chemical Corporation), Eurofins Scientific, Thermo Fisher Scientific Inc, WUXI Pharmatech (Cayman) Inc, Genscript, Associates of Cape Cod Inc (Seikagaku Biobusiness Corporation), Microcoat Biotechnologie GmbH, Charles River Laboratories Inc, Sanquin, Pyrostar, Ellab AS.
3. What are the main segments of the Pyrogen Testing Industry?
The market segments include Product, Test Type, End User.
4. Can you provide details about the market size?
The market size is estimated to be USD 1.48 Million as of 2022.
5. What are some drivers contributing to market growth?
Rapid Growth in Pharmaceutical and Biotechnology Industries; Rising R&D Expenditure in Life Science.
6. What are the notable trends driving market growth?
The Monocyte Activation Test Segment is Expected to Witness Good Growth Over the Forecast Period.
7. Are there any restraints impacting market growth?
Stringent Government Regulations.
8. Can you provide examples of recent developments in the market?
N/A
9. What pricing options are available for accessing the report?
Pricing options include single-user, multi-user, and enterprise licenses priced at USD 4750, USD 5250, and USD 8750 respectively.
10. Is the market size provided in terms of value or volume?
The market size is provided in terms of value, measured in Million and volume, measured in K Unit.
11. Are there any specific market keywords associated with the report?
Yes, the market keyword associated with the report is "Pyrogen Testing Industry," which aids in identifying and referencing the specific market segment covered.
12. How do I determine which pricing option suits my needs best?
The pricing options vary based on user requirements and access needs. Individual users may opt for single-user licenses, while businesses requiring broader access may choose multi-user or enterprise licenses for cost-effective access to the report.
13. Are there any additional resources or data provided in the Pyrogen Testing Industry report?
While the report offers comprehensive insights, it's advisable to review the specific contents or supplementary materials provided to ascertain if additional resources or data are available.
14. How can I stay updated on further developments or reports in the Pyrogen Testing Industry?
To stay informed about further developments, trends, and reports in the Pyrogen Testing Industry, consider subscribing to industry newsletters, following relevant companies and organizations, or regularly checking reputable industry news sources and publications.
Methodology
Step 1 - Identification of Relevant Samples Size from Population Database


Step 2 - Approaches for Defining Global Market Size (Value, Volume* & Price*)

Note*: In applicable scenarios
Step 3 - Data Sources
Primary Research
- Web Analytics
- Survey Reports
- Research Institute
- Latest Research Reports
- Opinion Leaders
Secondary Research
- Annual Reports
- White Paper
- Latest Press Release
- Industry Association
- Paid Database
- Investor Presentations

Step 4 - Data Triangulation
Involves using different sources of information in order to increase the validity of a study
These sources are likely to be stakeholders in a program - participants, other researchers, program staff, other community members, and so on.
Then we put all data in single framework & apply various statistical tools to find out the dynamic on the market.
During the analysis stage, feedback from the stakeholder groups would be compared to determine areas of agreement as well as areas of divergence
