

Key Insights
The refurbished computers and laptops market is experiencing robust growth, driven by increasing consumer demand for affordable technology and a growing awareness of environmental sustainability. A Compound Annual Growth Rate (CAGR) of 10.24% from 2019 to 2024 indicates a significant upward trajectory. This growth is fueled by several factors. Firstly, the rising cost of new electronics makes refurbished options an attractive alternative for budget-conscious consumers, particularly students and small businesses. Secondly, the increasing focus on e-waste reduction and circular economy principles is driving consumer preference towards refurbished products, contributing to a more sustainable technological landscape. Furthermore, the expanding availability of certified refurbished devices through reputable online and offline retailers builds consumer trust and facilitates market expansion. The market is segmented by application, with significant contributions from the consumer electronics, education, and business sectors. Geographically, North America and Europe currently hold substantial market share, but the Asia-Pacific region exhibits high growth potential, fueled by increasing internet penetration and rising disposable incomes. While challenges such as concerns about device reliability and potential warranty issues exist, the market is effectively addressing these through enhanced quality control measures and extended warranty options offered by many reputable vendors.
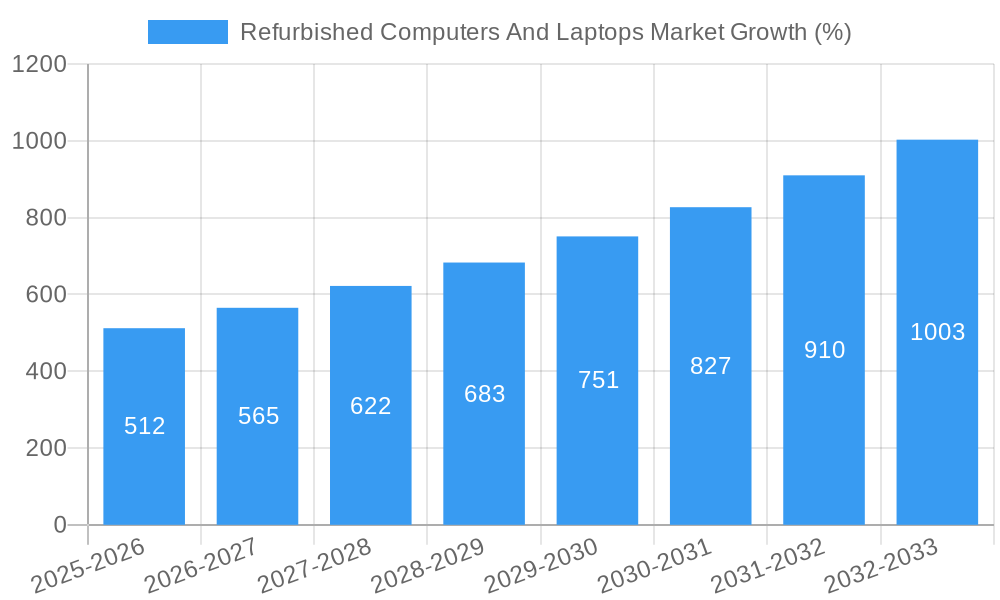
The continued growth of the refurbished computers and laptops market is projected to continue through 2033. This positive outlook is based on the sustained demand for affordable electronics, coupled with the increasing adoption of sustainable consumption practices. The ongoing advancements in technology also contribute positively; as newer models are released, the supply of high-quality, refurbished older models increases, making them even more competitive price-wise. However, potential restraints include fluctuations in the price of raw materials and components, impacting the cost of refurbishment and potentially affecting market pricing. Nevertheless, the market's resilience and adaptability suggest that it will continue to expand, driven by strong consumer demand and the increasing focus on environmental responsibility. Key players like Microsoft, Apple, and Dell are leveraging their brand recognition to establish a robust presence in this growing market segment, further contributing to its overall expansion.
Refurbished Computers and Laptops Market: A Comprehensive Report (2019-2033)
This in-depth report provides a comprehensive analysis of the refurbished computers and laptops market, encompassing market dynamics, growth trends, regional segmentation, product landscape, key drivers and challenges, emerging opportunities, and a detailed outlook for the forecast period 2025-2033. The report leverages extensive data analysis to provide valuable insights for industry professionals, investors, and businesses involved in the parent market of Used Electronics Market and the child market of Refurbished Computers and Laptops Market. The base year for this analysis is 2025, with historical data spanning from 2019 to 2024 and projections extending to 2033. The market size is presented in million units.
Refurbished Computers And Laptops Market Market Dynamics & Structure
The refurbished computers and laptops market is characterized by a moderately fragmented structure with a handful of dominant players and numerous smaller regional actors. Market concentration is influenced by brand recognition, supply chain capabilities, and the scale of refurbishment operations. Technological innovation, particularly in areas like energy efficiency and extended battery life, significantly impacts market dynamics. Stringent e-waste regulations are driving growth by incentivizing refurbishment over disposal. Competitive pressure from new and used devices necessitates continuous product improvement. End-user demographics, primarily driven by price sensitivity and sustainability concerns, are a crucial factor. M&A activity, though not extensive, contributes to market consolidation and expansion.
- Market Concentration: Moderately fragmented, with top 5 players holding xx% market share in 2024.
- Technological Innovation: Focus on energy efficiency, extended battery life, and improved performance.
- Regulatory Frameworks: Increasingly stringent e-waste regulations globally.
- Competitive Product Substitutes: New and used devices pose competition.
- End-User Demographics: Price-conscious consumers and environmentally conscious buyers are key segments.
- M&A Trends: Low to moderate activity, with xx major deals recorded between 2019-2024.
Refurbished Computers And Laptops Market Growth Trends & Insights
The refurbished computers and laptops market has experienced significant growth over the historical period (2019-2024), driven primarily by increasing affordability, growing environmental consciousness, and the rising demand for accessible technology. The market size reached xx million units in 2024, exhibiting a Compound Annual Growth Rate (CAGR) of xx% during this period. Technological advancements, such as improved processing power and storage capacity in refurbished devices, are contributing to increased adoption rates. Shifts in consumer behavior, such as a preference for cost-effective options and sustainable consumption, further fuel market expansion. Market penetration is expected to increase steadily in the forecast period, with the consumer electronics segment showing the highest adoption. We project a CAGR of xx% for the forecast period (2025-2033), with the market reaching xx million units by 2033.
Dominant Regions, Countries, or Segments in Refurbished Computers And Laptops Market
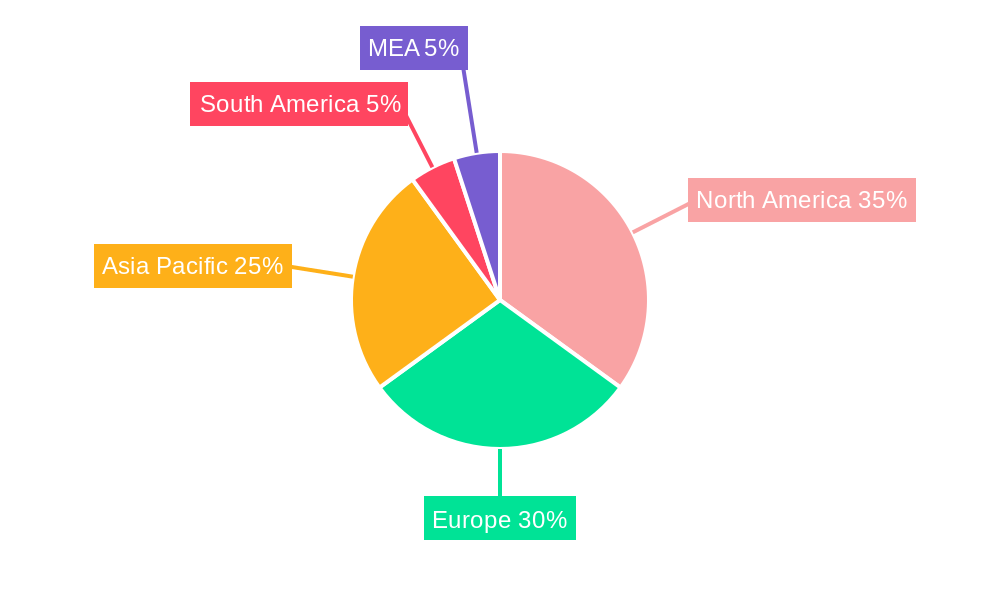
The North American region currently holds the largest market share within the refurbished computers and laptops market, primarily due to strong consumer demand, established refurbishment infrastructure, and favorable regulatory environments. The consumer electronics segment is the leading application driving market growth due to high demand for affordable devices. Other regions, including Europe and Asia-Pacific, also exhibit significant potential, with growth fueled by rising disposable incomes and increasing awareness of sustainable practices.
- Key Drivers in North America: Strong consumer demand, robust refurbishment infrastructure, and favorable e-waste regulations.
- Key Drivers in Europe: Growing environmental consciousness and increasing adoption of sustainable practices.
- Key Drivers in Asia-Pacific: Rising disposable incomes and expanding e-commerce platforms.
- Dominant Application Segment: Consumer electronics accounts for xx% market share in 2024, driven by affordability and demand for secondary devices.
Refurbished Computers And Laptops Market Product Landscape
The refurbished computer and laptop market offers a diverse range of products, categorized by device type (laptops, desktops, tablets), brand, specifications (processor, RAM, storage), and operating system. Refurbished devices typically undergo rigorous testing and quality checks to ensure functionality and performance. Many refurbished devices are offered with warranties and support services, enhancing their appeal to consumers. Unique selling propositions often include significantly lower prices compared to new devices, while technological advancements concentrate on extending the lifespan and usability of existing hardware.
Key Drivers, Barriers & Challenges in Refurbished Computers And Laptops Market
Key Drivers:
- Affordability: Refurbished devices offer a significant cost advantage compared to new units.
- Sustainability: Environmental concerns are boosting demand for refurbished products.
- Technological Advancements: Improved performance and capabilities of refurbished devices.
- Government Initiatives: Policies supporting e-waste management and digital inclusion are driving adoption.
Key Challenges:
- Supply Chain Issues: The availability of used devices and spare parts can be unpredictable.
- Data Security Concerns: Ensuring data erasure and privacy protection is paramount.
- Quality Control: Maintaining consistent quality across refurbished devices is crucial.
- Competitive Pressure: Competition from new devices and other used electronics markets.
Emerging Opportunities in Refurbished Computers And Laptops Market
- Expansion into Untapped Markets: Developing countries with high technology needs represent significant opportunities.
- Innovative Applications: Refurbished devices can be repurposed for educational, business, or industrial uses.
- Subscription Models: Offering refurbished devices on a subscription basis could increase accessibility.
- E-commerce Growth: Online marketplaces are expanding sales channels for refurbished products.
Growth Accelerators in the Refurbished Computers And Laptops Market Industry
Technological breakthroughs in battery technology, improved data security measures, and partnerships with original equipment manufacturers (OEMs) will significantly accelerate market growth. Expansion into underserved markets, particularly in developing economies, presents a significant growth driver. Strategic alliances and collaborations between refurbishment companies, tech giants, and recycling initiatives are enhancing the market’s sustainability.
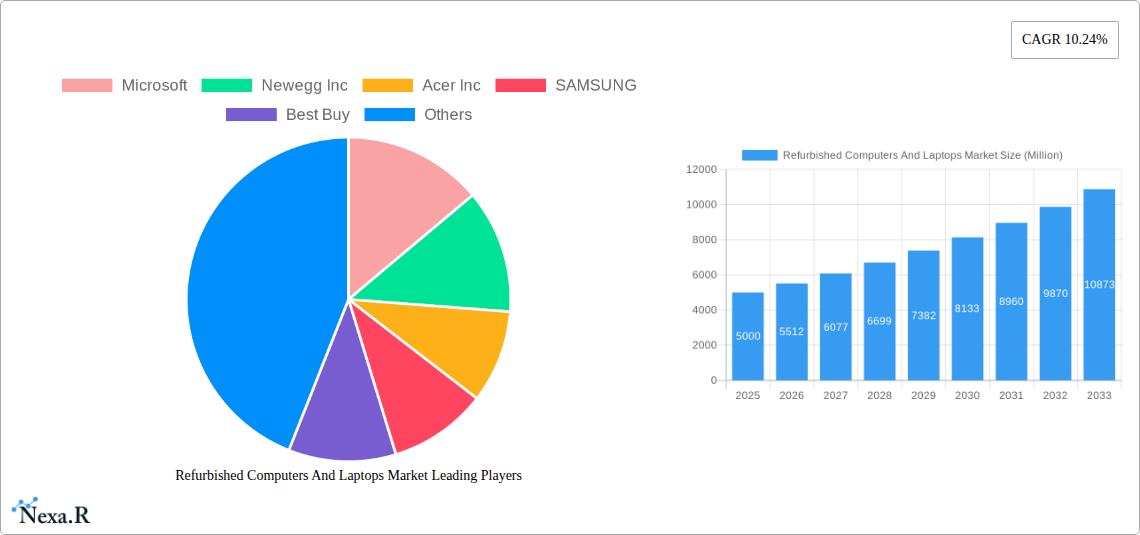
Key Players Shaping the Refurbished Computers And Laptops Market Market
- Microsoft
- Newegg Inc
- Acer Inc
- SAMSUNG
- Best Buy
- HP Development Company L P
- Dell Inc
- Budli Internet Private Limited
- Amazon Renewed
- Lenovo Group Ltd
- Apple Inc
Notable Milestones in Refurbished Computers And Laptops Market Sector
- May 2023: Li-Cycle Holdings Corp. and Shift2 donated 60 refurbished laptops to graduating seniors, highlighting the social impact of the industry.
- June 2023: AT&T's initiative provided free refurbished laptops to families in Vanderburgh County, addressing the digital divide.
In-Depth Refurbished Computers And Laptops Market Market Outlook
The refurbished computers and laptops market is poised for sustained growth, driven by affordability, sustainability concerns, and technological advancements. Strategic partnerships, expansion into emerging markets, and innovative business models will further propel market expansion. The focus on extending the lifespan of electronic devices, improving data security, and integrating sustainable practices will shape the future landscape of this dynamic market.
Refurbished Computers And Laptops Market Segmentation
- 1. Production Analysis
- 2. Consumption Analysis
- 3. Import Market Analysis (Value & Volume)
- 4. Export Market Analysis (Value & Volume)
- 5. Price Trend Analysis
Refurbished Computers And Laptops Market Segmentation By Geography
- 1. North America
- 2. Europe
- 3. Asia
- 4. Australia and New Zealand
- 5. Latin America
- 6. Middle East and Africa
Refurbished Computers And Laptops Market REPORT HIGHLIGHTS
| Aspects | Details |
|---|---|
| Study Period | 2019-2033 |
| Base Year | 2024 |
| Estimated Year | 2025 |
| Forecast Period | 2025-2033 |
| Historical Period | 2019-2024 |
| Growth Rate | CAGR of 10.24% from 2019-2033 |
| Segmentation |
|
Table of Contents
- 1. Introduction
- 1.1. Research Scope
- 1.2. Market Segmentation
- 1.3. Research Methodology
- 1.4. Definitions and Assumptions
- 2. Executive Summary
- 2.1. Introduction
- 3. Market Dynamics
- 3.1. Introduction
- 3.2. Market Drivers
- 3.2.1. Cost Savings and Affordability of the Refurbished Devices; Growing awareness about E waste and Environmental Consciousness
- 3.3. Market Restrains
- 3.3.1. Lack of Awareness About Intellectual Property Outsourcing
- 3.4. Market Trends
- 3.4.1. Growing awareness about E waste and Environmental Consciousness
- 4. Market Factor Analysis
- 4.1. Porters Five Forces
- 4.2. Supply/Value Chain
- 4.3. PESTEL analysis
- 4.4. Market Entropy
- 4.5. Patent/Trademark Analysis
- 5. Global Refurbished Computers And Laptops Market Analysis, Insights and Forecast, 2019-2031
- 5.1. Market Analysis, Insights and Forecast - by Production Analysis
- 5.2. Market Analysis, Insights and Forecast - by Consumption Analysis
- 5.3. Market Analysis, Insights and Forecast - by Import Market Analysis (Value & Volume)
- 5.4. Market Analysis, Insights and Forecast - by Export Market Analysis (Value & Volume)
- 5.5. Market Analysis, Insights and Forecast - by Price Trend Analysis
- 5.6. Market Analysis, Insights and Forecast - by Region
- 5.6.1. North America
- 5.6.2. Europe
- 5.6.3. Asia
- 5.6.4. Australia and New Zealand
- 5.6.5. Latin America
- 5.6.6. Middle East and Africa
- 5.1. Market Analysis, Insights and Forecast - by Production Analysis
- 6. North America Refurbished Computers And Laptops Market Analysis, Insights and Forecast, 2019-2031
- 6.1. Market Analysis, Insights and Forecast - by Production Analysis
- 6.2. Market Analysis, Insights and Forecast - by Consumption Analysis
- 6.3. Market Analysis, Insights and Forecast - by Import Market Analysis (Value & Volume)
- 6.4. Market Analysis, Insights and Forecast - by Export Market Analysis (Value & Volume)
- 6.5. Market Analysis, Insights and Forecast - by Price Trend Analysis
- 6.1. Market Analysis, Insights and Forecast - by Production Analysis
- 7. Europe Refurbished Computers And Laptops Market Analysis, Insights and Forecast, 2019-2031
- 7.1. Market Analysis, Insights and Forecast - by Production Analysis
- 7.2. Market Analysis, Insights and Forecast - by Consumption Analysis
- 7.3. Market Analysis, Insights and Forecast - by Import Market Analysis (Value & Volume)
- 7.4. Market Analysis, Insights and Forecast - by Export Market Analysis (Value & Volume)
- 7.5. Market Analysis, Insights and Forecast - by Price Trend Analysis
- 7.1. Market Analysis, Insights and Forecast - by Production Analysis
- 8. Asia Refurbished Computers And Laptops Market Analysis, Insights and Forecast, 2019-2031
- 8.1. Market Analysis, Insights and Forecast - by Production Analysis
- 8.2. Market Analysis, Insights and Forecast - by Consumption Analysis
- 8.3. Market Analysis, Insights and Forecast - by Import Market Analysis (Value & Volume)
- 8.4. Market Analysis, Insights and Forecast - by Export Market Analysis (Value & Volume)
- 8.5. Market Analysis, Insights and Forecast - by Price Trend Analysis
- 8.1. Market Analysis, Insights and Forecast - by Production Analysis
- 9. Australia and New Zealand Refurbished Computers And Laptops Market Analysis, Insights and Forecast, 2019-2031
- 9.1. Market Analysis, Insights and Forecast - by Production Analysis
- 9.2. Market Analysis, Insights and Forecast - by Consumption Analysis
- 9.3. Market Analysis, Insights and Forecast - by Import Market Analysis (Value & Volume)
- 9.4. Market Analysis, Insights and Forecast - by Export Market Analysis (Value & Volume)
- 9.5. Market Analysis, Insights and Forecast - by Price Trend Analysis
- 9.1. Market Analysis, Insights and Forecast - by Production Analysis
- 10. Latin America Refurbished Computers And Laptops Market Analysis, Insights and Forecast, 2019-2031
- 10.1. Market Analysis, Insights and Forecast - by Production Analysis
- 10.2. Market Analysis, Insights and Forecast - by Consumption Analysis
- 10.3. Market Analysis, Insights and Forecast - by Import Market Analysis (Value & Volume)
- 10.4. Market Analysis, Insights and Forecast - by Export Market Analysis (Value & Volume)
- 10.5. Market Analysis, Insights and Forecast - by Price Trend Analysis
- 10.1. Market Analysis, Insights and Forecast - by Production Analysis
- 11. Middle East and Africa Refurbished Computers And Laptops Market Analysis, Insights and Forecast, 2019-2031
- 11.1. Market Analysis, Insights and Forecast - by Production Analysis
- 11.2. Market Analysis, Insights and Forecast - by Consumption Analysis
- 11.3. Market Analysis, Insights and Forecast - by Import Market Analysis (Value & Volume)
- 11.4. Market Analysis, Insights and Forecast - by Export Market Analysis (Value & Volume)
- 11.5. Market Analysis, Insights and Forecast - by Price Trend Analysis
- 11.1. Market Analysis, Insights and Forecast - by Production Analysis
- 12. North America Refurbished Computers And Laptops Market Analysis, Insights and Forecast, 2019-2031
- 12.1. Market Analysis, Insights and Forecast - By Country/Sub-region
- 12.1.1 United States
- 12.1.2 Canada
- 12.1.3 Mexico
- 13. Europe Refurbished Computers And Laptops Market Analysis, Insights and Forecast, 2019-2031
- 13.1. Market Analysis, Insights and Forecast - By Country/Sub-region
- 13.1.1 Germany
- 13.1.2 United Kingdom
- 13.1.3 France
- 13.1.4 Spain
- 13.1.5 Italy
- 13.1.6 Spain
- 13.1.7 Belgium
- 13.1.8 Netherland
- 13.1.9 Nordics
- 13.1.10 Rest of Europe
- 14. Asia Pacific Refurbished Computers And Laptops Market Analysis, Insights and Forecast, 2019-2031
- 14.1. Market Analysis, Insights and Forecast - By Country/Sub-region
- 14.1.1 China
- 14.1.2 Japan
- 14.1.3 India
- 14.1.4 South Korea
- 14.1.5 Southeast Asia
- 14.1.6 Australia
- 14.1.7 Indonesia
- 14.1.8 Phillipes
- 14.1.9 Singapore
- 14.1.10 Thailandc
- 14.1.11 Rest of Asia Pacific
- 15. South America Refurbished Computers And Laptops Market Analysis, Insights and Forecast, 2019-2031
- 15.1. Market Analysis, Insights and Forecast - By Country/Sub-region
- 15.1.1 Brazil
- 15.1.2 Argentina
- 15.1.3 Peru
- 15.1.4 Chile
- 15.1.5 Colombia
- 15.1.6 Ecuador
- 15.1.7 Venezuela
- 15.1.8 Rest of South America
- 16. MEA Refurbished Computers And Laptops Market Analysis, Insights and Forecast, 2019-2031
- 16.1. Market Analysis, Insights and Forecast - By Country/Sub-region
- 16.1.1 United Arab Emirates
- 16.1.2 Saudi Arabia
- 16.1.3 South Africa
- 16.1.4 Rest of Middle East and Africa
- 17. Competitive Analysis
- 17.1. Global Market Share Analysis 2024
- 17.2. Company Profiles
- 17.2.1 Microsoft
- 17.2.1.1. Overview
- 17.2.1.2. Products
- 17.2.1.3. SWOT Analysis
- 17.2.1.4. Recent Developments
- 17.2.1.5. Financials (Based on Availability)
- 17.2.2 Newegg Inc
- 17.2.2.1. Overview
- 17.2.2.2. Products
- 17.2.2.3. SWOT Analysis
- 17.2.2.4. Recent Developments
- 17.2.2.5. Financials (Based on Availability)
- 17.2.3 Acer Inc
- 17.2.3.1. Overview
- 17.2.3.2. Products
- 17.2.3.3. SWOT Analysis
- 17.2.3.4. Recent Developments
- 17.2.3.5. Financials (Based on Availability)
- 17.2.4 SAMSUNG
- 17.2.4.1. Overview
- 17.2.4.2. Products
- 17.2.4.3. SWOT Analysis
- 17.2.4.4. Recent Developments
- 17.2.4.5. Financials (Based on Availability)
- 17.2.5 Best Buy
- 17.2.5.1. Overview
- 17.2.5.2. Products
- 17.2.5.3. SWOT Analysis
- 17.2.5.4. Recent Developments
- 17.2.5.5. Financials (Based on Availability)
- 17.2.6 HP Development Company L P
- 17.2.6.1. Overview
- 17.2.6.2. Products
- 17.2.6.3. SWOT Analysis
- 17.2.6.4. Recent Developments
- 17.2.6.5. Financials (Based on Availability)
- 17.2.7 Dell Inc
- 17.2.7.1. Overview
- 17.2.7.2. Products
- 17.2.7.3. SWOT Analysis
- 17.2.7.4. Recent Developments
- 17.2.7.5. Financials (Based on Availability)
- 17.2.8 Budli Internet Private Limited
- 17.2.8.1. Overview
- 17.2.8.2. Products
- 17.2.8.3. SWOT Analysis
- 17.2.8.4. Recent Developments
- 17.2.8.5. Financials (Based on Availability)
- 17.2.9 Amazon Renewed
- 17.2.9.1. Overview
- 17.2.9.2. Products
- 17.2.9.3. SWOT Analysis
- 17.2.9.4. Recent Developments
- 17.2.9.5. Financials (Based on Availability)
- 17.2.10 Lenovo Group Ltd
- 17.2.10.1. Overview
- 17.2.10.2. Products
- 17.2.10.3. SWOT Analysis
- 17.2.10.4. Recent Developments
- 17.2.10.5. Financials (Based on Availability)
- 17.2.11 Apple Inc
- 17.2.11.1. Overview
- 17.2.11.2. Products
- 17.2.11.3. SWOT Analysis
- 17.2.11.4. Recent Developments
- 17.2.11.5. Financials (Based on Availability)
- 17.2.1 Microsoft
List of Figures
- Figure 1: Global Refurbished Computers And Laptops Market Revenue Breakdown (Million, %) by Region 2024 & 2032
- Figure 2: Global Refurbished Computers And Laptops Market Volume Breakdown (K Unit, %) by Region 2024 & 2032
- Figure 3: North America Refurbished Computers And Laptops Market Revenue (Million), by Country 2024 & 2032
- Figure 4: North America Refurbished Computers And Laptops Market Volume (K Unit), by Country 2024 & 2032
- Figure 5: North America Refurbished Computers And Laptops Market Revenue Share (%), by Country 2024 & 2032
- Figure 6: North America Refurbished Computers And Laptops Market Volume Share (%), by Country 2024 & 2032
- Figure 7: Europe Refurbished Computers And Laptops Market Revenue (Million), by Country 2024 & 2032
- Figure 8: Europe Refurbished Computers And Laptops Market Volume (K Unit), by Country 2024 & 2032
- Figure 9: Europe Refurbished Computers And Laptops Market Revenue Share (%), by Country 2024 & 2032
- Figure 10: Europe Refurbished Computers And Laptops Market Volume Share (%), by Country 2024 & 2032
- Figure 11: Asia Pacific Refurbished Computers And Laptops Market Revenue (Million), by Country 2024 & 2032
- Figure 12: Asia Pacific Refurbished Computers And Laptops Market Volume (K Unit), by Country 2024 & 2032
- Figure 13: Asia Pacific Refurbished Computers And Laptops Market Revenue Share (%), by Country 2024 & 2032
- Figure 14: Asia Pacific Refurbished Computers And Laptops Market Volume Share (%), by Country 2024 & 2032
- Figure 15: South America Refurbished Computers And Laptops Market Revenue (Million), by Country 2024 & 2032
- Figure 16: South America Refurbished Computers And Laptops Market Volume (K Unit), by Country 2024 & 2032
- Figure 17: South America Refurbished Computers And Laptops Market Revenue Share (%), by Country 2024 & 2032
- Figure 18: South America Refurbished Computers And Laptops Market Volume Share (%), by Country 2024 & 2032
- Figure 19: MEA Refurbished Computers And Laptops Market Revenue (Million), by Country 2024 & 2032
- Figure 20: MEA Refurbished Computers And Laptops Market Volume (K Unit), by Country 2024 & 2032
- Figure 21: MEA Refurbished Computers And Laptops Market Revenue Share (%), by Country 2024 & 2032
- Figure 22: MEA Refurbished Computers And Laptops Market Volume Share (%), by Country 2024 & 2032
- Figure 23: North America Refurbished Computers And Laptops Market Revenue (Million), by Production Analysis 2024 & 2032
- Figure 24: North America Refurbished Computers And Laptops Market Volume (K Unit), by Production Analysis 2024 & 2032
- Figure 25: North America Refurbished Computers And Laptops Market Revenue Share (%), by Production Analysis 2024 & 2032
- Figure 26: North America Refurbished Computers And Laptops Market Volume Share (%), by Production Analysis 2024 & 2032
- Figure 27: North America Refurbished Computers And Laptops Market Revenue (Million), by Consumption Analysis 2024 & 2032
- Figure 28: North America Refurbished Computers And Laptops Market Volume (K Unit), by Consumption Analysis 2024 & 2032
- Figure 29: North America Refurbished Computers And Laptops Market Revenue Share (%), by Consumption Analysis 2024 & 2032
- Figure 30: North America Refurbished Computers And Laptops Market Volume Share (%), by Consumption Analysis 2024 & 2032
- Figure 31: North America Refurbished Computers And Laptops Market Revenue (Million), by Import Market Analysis (Value & Volume) 2024 & 2032
- Figure 32: North America Refurbished Computers And Laptops Market Volume (K Unit), by Import Market Analysis (Value & Volume) 2024 & 2032
- Figure 33: North America Refurbished Computers And Laptops Market Revenue Share (%), by Import Market Analysis (Value & Volume) 2024 & 2032
- Figure 34: North America Refurbished Computers And Laptops Market Volume Share (%), by Import Market Analysis (Value & Volume) 2024 & 2032
- Figure 35: North America Refurbished Computers And Laptops Market Revenue (Million), by Export Market Analysis (Value & Volume) 2024 & 2032
- Figure 36: North America Refurbished Computers And Laptops Market Volume (K Unit), by Export Market Analysis (Value & Volume) 2024 & 2032
- Figure 37: North America Refurbished Computers And Laptops Market Revenue Share (%), by Export Market Analysis (Value & Volume) 2024 & 2032
- Figure 38: North America Refurbished Computers And Laptops Market Volume Share (%), by Export Market Analysis (Value & Volume) 2024 & 2032
- Figure 39: North America Refurbished Computers And Laptops Market Revenue (Million), by Price Trend Analysis 2024 & 2032
- Figure 40: North America Refurbished Computers And Laptops Market Volume (K Unit), by Price Trend Analysis 2024 & 2032
- Figure 41: North America Refurbished Computers And Laptops Market Revenue Share (%), by Price Trend Analysis 2024 & 2032
- Figure 42: North America Refurbished Computers And Laptops Market Volume Share (%), by Price Trend Analysis 2024 & 2032
- Figure 43: North America Refurbished Computers And Laptops Market Revenue (Million), by Country 2024 & 2032
- Figure 44: North America Refurbished Computers And Laptops Market Volume (K Unit), by Country 2024 & 2032
- Figure 45: North America Refurbished Computers And Laptops Market Revenue Share (%), by Country 2024 & 2032
- Figure 46: North America Refurbished Computers And Laptops Market Volume Share (%), by Country 2024 & 2032
- Figure 47: Europe Refurbished Computers And Laptops Market Revenue (Million), by Production Analysis 2024 & 2032
- Figure 48: Europe Refurbished Computers And Laptops Market Volume (K Unit), by Production Analysis 2024 & 2032
- Figure 49: Europe Refurbished Computers And Laptops Market Revenue Share (%), by Production Analysis 2024 & 2032
- Figure 50: Europe Refurbished Computers And Laptops Market Volume Share (%), by Production Analysis 2024 & 2032
- Figure 51: Europe Refurbished Computers And Laptops Market Revenue (Million), by Consumption Analysis 2024 & 2032
- Figure 52: Europe Refurbished Computers And Laptops Market Volume (K Unit), by Consumption Analysis 2024 & 2032
- Figure 53: Europe Refurbished Computers And Laptops Market Revenue Share (%), by Consumption Analysis 2024 & 2032
- Figure 54: Europe Refurbished Computers And Laptops Market Volume Share (%), by Consumption Analysis 2024 & 2032
- Figure 55: Europe Refurbished Computers And Laptops Market Revenue (Million), by Import Market Analysis (Value & Volume) 2024 & 2032
- Figure 56: Europe Refurbished Computers And Laptops Market Volume (K Unit), by Import Market Analysis (Value & Volume) 2024 & 2032
- Figure 57: Europe Refurbished Computers And Laptops Market Revenue Share (%), by Import Market Analysis (Value & Volume) 2024 & 2032
- Figure 58: Europe Refurbished Computers And Laptops Market Volume Share (%), by Import Market Analysis (Value & Volume) 2024 & 2032
- Figure 59: Europe Refurbished Computers And Laptops Market Revenue (Million), by Export Market Analysis (Value & Volume) 2024 & 2032
- Figure 60: Europe Refurbished Computers And Laptops Market Volume (K Unit), by Export Market Analysis (Value & Volume) 2024 & 2032
- Figure 61: Europe Refurbished Computers And Laptops Market Revenue Share (%), by Export Market Analysis (Value & Volume) 2024 & 2032
- Figure 62: Europe Refurbished Computers And Laptops Market Volume Share (%), by Export Market Analysis (Value & Volume) 2024 & 2032
- Figure 63: Europe Refurbished Computers And Laptops Market Revenue (Million), by Price Trend Analysis 2024 & 2032
- Figure 64: Europe Refurbished Computers And Laptops Market Volume (K Unit), by Price Trend Analysis 2024 & 2032
- Figure 65: Europe Refurbished Computers And Laptops Market Revenue Share (%), by Price Trend Analysis 2024 & 2032
- Figure 66: Europe Refurbished Computers And Laptops Market Volume Share (%), by Price Trend Analysis 2024 & 2032
- Figure 67: Europe Refurbished Computers And Laptops Market Revenue (Million), by Country 2024 & 2032
- Figure 68: Europe Refurbished Computers And Laptops Market Volume (K Unit), by Country 2024 & 2032
- Figure 69: Europe Refurbished Computers And Laptops Market Revenue Share (%), by Country 2024 & 2032
- Figure 70: Europe Refurbished Computers And Laptops Market Volume Share (%), by Country 2024 & 2032
- Figure 71: Asia Refurbished Computers And Laptops Market Revenue (Million), by Production Analysis 2024 & 2032
- Figure 72: Asia Refurbished Computers And Laptops Market Volume (K Unit), by Production Analysis 2024 & 2032
- Figure 73: Asia Refurbished Computers And Laptops Market Revenue Share (%), by Production Analysis 2024 & 2032
- Figure 74: Asia Refurbished Computers And Laptops Market Volume Share (%), by Production Analysis 2024 & 2032
- Figure 75: Asia Refurbished Computers And Laptops Market Revenue (Million), by Consumption Analysis 2024 & 2032
- Figure 76: Asia Refurbished Computers And Laptops Market Volume (K Unit), by Consumption Analysis 2024 & 2032
- Figure 77: Asia Refurbished Computers And Laptops Market Revenue Share (%), by Consumption Analysis 2024 & 2032
- Figure 78: Asia Refurbished Computers And Laptops Market Volume Share (%), by Consumption Analysis 2024 & 2032
- Figure 79: Asia Refurbished Computers And Laptops Market Revenue (Million), by Import Market Analysis (Value & Volume) 2024 & 2032
- Figure 80: Asia Refurbished Computers And Laptops Market Volume (K Unit), by Import Market Analysis (Value & Volume) 2024 & 2032
- Figure 81: Asia Refurbished Computers And Laptops Market Revenue Share (%), by Import Market Analysis (Value & Volume) 2024 & 2032
- Figure 82: Asia Refurbished Computers And Laptops Market Volume Share (%), by Import Market Analysis (Value & Volume) 2024 & 2032
- Figure 83: Asia Refurbished Computers And Laptops Market Revenue (Million), by Export Market Analysis (Value & Volume) 2024 & 2032
- Figure 84: Asia Refurbished Computers And Laptops Market Volume (K Unit), by Export Market Analysis (Value & Volume) 2024 & 2032
- Figure 85: Asia Refurbished Computers And Laptops Market Revenue Share (%), by Export Market Analysis (Value & Volume) 2024 & 2032
- Figure 86: Asia Refurbished Computers And Laptops Market Volume Share (%), by Export Market Analysis (Value & Volume) 2024 & 2032
- Figure 87: Asia Refurbished Computers And Laptops Market Revenue (Million), by Price Trend Analysis 2024 & 2032
- Figure 88: Asia Refurbished Computers And Laptops Market Volume (K Unit), by Price Trend Analysis 2024 & 2032
- Figure 89: Asia Refurbished Computers And Laptops Market Revenue Share (%), by Price Trend Analysis 2024 & 2032
- Figure 90: Asia Refurbished Computers And Laptops Market Volume Share (%), by Price Trend Analysis 2024 & 2032
- Figure 91: Asia Refurbished Computers And Laptops Market Revenue (Million), by Country 2024 & 2032
- Figure 92: Asia Refurbished Computers And Laptops Market Volume (K Unit), by Country 2024 & 2032
- Figure 93: Asia Refurbished Computers And Laptops Market Revenue Share (%), by Country 2024 & 2032
- Figure 94: Asia Refurbished Computers And Laptops Market Volume Share (%), by Country 2024 & 2032
- Figure 95: Australia and New Zealand Refurbished Computers And Laptops Market Revenue (Million), by Production Analysis 2024 & 2032
- Figure 96: Australia and New Zealand Refurbished Computers And Laptops Market Volume (K Unit), by Production Analysis 2024 & 2032
- Figure 97: Australia and New Zealand Refurbished Computers And Laptops Market Revenue Share (%), by Production Analysis 2024 & 2032
- Figure 98: Australia and New Zealand Refurbished Computers And Laptops Market Volume Share (%), by Production Analysis 2024 & 2032
- Figure 99: Australia and New Zealand Refurbished Computers And Laptops Market Revenue (Million), by Consumption Analysis 2024 & 2032
- Figure 100: Australia and New Zealand Refurbished Computers And Laptops Market Volume (K Unit), by Consumption Analysis 2024 & 2032
- Figure 101: Australia and New Zealand Refurbished Computers And Laptops Market Revenue Share (%), by Consumption Analysis 2024 & 2032
- Figure 102: Australia and New Zealand Refurbished Computers And Laptops Market Volume Share (%), by Consumption Analysis 2024 & 2032
- Figure 103: Australia and New Zealand Refurbished Computers And Laptops Market Revenue (Million), by Import Market Analysis (Value & Volume) 2024 & 2032
- Figure 104: Australia and New Zealand Refurbished Computers And Laptops Market Volume (K Unit), by Import Market Analysis (Value & Volume) 2024 & 2032
- Figure 105: Australia and New Zealand Refurbished Computers And Laptops Market Revenue Share (%), by Import Market Analysis (Value & Volume) 2024 & 2032
- Figure 106: Australia and New Zealand Refurbished Computers And Laptops Market Volume Share (%), by Import Market Analysis (Value & Volume) 2024 & 2032
- Figure 107: Australia and New Zealand Refurbished Computers And Laptops Market Revenue (Million), by Export Market Analysis (Value & Volume) 2024 & 2032
- Figure 108: Australia and New Zealand Refurbished Computers And Laptops Market Volume (K Unit), by Export Market Analysis (Value & Volume) 2024 & 2032
- Figure 109: Australia and New Zealand Refurbished Computers And Laptops Market Revenue Share (%), by Export Market Analysis (Value & Volume) 2024 & 2032
- Figure 110: Australia and New Zealand Refurbished Computers And Laptops Market Volume Share (%), by Export Market Analysis (Value & Volume) 2024 & 2032
- Figure 111: Australia and New Zealand Refurbished Computers And Laptops Market Revenue (Million), by Price Trend Analysis 2024 & 2032
- Figure 112: Australia and New Zealand Refurbished Computers And Laptops Market Volume (K Unit), by Price Trend Analysis 2024 & 2032
- Figure 113: Australia and New Zealand Refurbished Computers And Laptops Market Revenue Share (%), by Price Trend Analysis 2024 & 2032
- Figure 114: Australia and New Zealand Refurbished Computers And Laptops Market Volume Share (%), by Price Trend Analysis 2024 & 2032
- Figure 115: Australia and New Zealand Refurbished Computers And Laptops Market Revenue (Million), by Country 2024 & 2032
- Figure 116: Australia and New Zealand Refurbished Computers And Laptops Market Volume (K Unit), by Country 2024 & 2032
- Figure 117: Australia and New Zealand Refurbished Computers And Laptops Market Revenue Share (%), by Country 2024 & 2032
- Figure 118: Australia and New Zealand Refurbished Computers And Laptops Market Volume Share (%), by Country 2024 & 2032
- Figure 119: Latin America Refurbished Computers And Laptops Market Revenue (Million), by Production Analysis 2024 & 2032
- Figure 120: Latin America Refurbished Computers And Laptops Market Volume (K Unit), by Production Analysis 2024 & 2032
- Figure 121: Latin America Refurbished Computers And Laptops Market Revenue Share (%), by Production Analysis 2024 & 2032
- Figure 122: Latin America Refurbished Computers And Laptops Market Volume Share (%), by Production Analysis 2024 & 2032
- Figure 123: Latin America Refurbished Computers And Laptops Market Revenue (Million), by Consumption Analysis 2024 & 2032
- Figure 124: Latin America Refurbished Computers And Laptops Market Volume (K Unit), by Consumption Analysis 2024 & 2032
- Figure 125: Latin America Refurbished Computers And Laptops Market Revenue Share (%), by Consumption Analysis 2024 & 2032
- Figure 126: Latin America Refurbished Computers And Laptops Market Volume Share (%), by Consumption Analysis 2024 & 2032
- Figure 127: Latin America Refurbished Computers And Laptops Market Revenue (Million), by Import Market Analysis (Value & Volume) 2024 & 2032
- Figure 128: Latin America Refurbished Computers And Laptops Market Volume (K Unit), by Import Market Analysis (Value & Volume) 2024 & 2032
- Figure 129: Latin America Refurbished Computers And Laptops Market Revenue Share (%), by Import Market Analysis (Value & Volume) 2024 & 2032
- Figure 130: Latin America Refurbished Computers And Laptops Market Volume Share (%), by Import Market Analysis (Value & Volume) 2024 & 2032
- Figure 131: Latin America Refurbished Computers And Laptops Market Revenue (Million), by Export Market Analysis (Value & Volume) 2024 & 2032
- Figure 132: Latin America Refurbished Computers And Laptops Market Volume (K Unit), by Export Market Analysis (Value & Volume) 2024 & 2032
- Figure 133: Latin America Refurbished Computers And Laptops Market Revenue Share (%), by Export Market Analysis (Value & Volume) 2024 & 2032
- Figure 134: Latin America Refurbished Computers And Laptops Market Volume Share (%), by Export Market Analysis (Value & Volume) 2024 & 2032
- Figure 135: Latin America Refurbished Computers And Laptops Market Revenue (Million), by Price Trend Analysis 2024 & 2032
- Figure 136: Latin America Refurbished Computers And Laptops Market Volume (K Unit), by Price Trend Analysis 2024 & 2032
- Figure 137: Latin America Refurbished Computers And Laptops Market Revenue Share (%), by Price Trend Analysis 2024 & 2032
- Figure 138: Latin America Refurbished Computers And Laptops Market Volume Share (%), by Price Trend Analysis 2024 & 2032
- Figure 139: Latin America Refurbished Computers And Laptops Market Revenue (Million), by Country 2024 & 2032
- Figure 140: Latin America Refurbished Computers And Laptops Market Volume (K Unit), by Country 2024 & 2032
- Figure 141: Latin America Refurbished Computers And Laptops Market Revenue Share (%), by Country 2024 & 2032
- Figure 142: Latin America Refurbished Computers And Laptops Market Volume Share (%), by Country 2024 & 2032
- Figure 143: Middle East and Africa Refurbished Computers And Laptops Market Revenue (Million), by Production Analysis 2024 & 2032
- Figure 144: Middle East and Africa Refurbished Computers And Laptops Market Volume (K Unit), by Production Analysis 2024 & 2032
- Figure 145: Middle East and Africa Refurbished Computers And Laptops Market Revenue Share (%), by Production Analysis 2024 & 2032
- Figure 146: Middle East and Africa Refurbished Computers And Laptops Market Volume Share (%), by Production Analysis 2024 & 2032
- Figure 147: Middle East and Africa Refurbished Computers And Laptops Market Revenue (Million), by Consumption Analysis 2024 & 2032
- Figure 148: Middle East and Africa Refurbished Computers And Laptops Market Volume (K Unit), by Consumption Analysis 2024 & 2032
- Figure 149: Middle East and Africa Refurbished Computers And Laptops Market Revenue Share (%), by Consumption Analysis 2024 & 2032
- Figure 150: Middle East and Africa Refurbished Computers And Laptops Market Volume Share (%), by Consumption Analysis 2024 & 2032
- Figure 151: Middle East and Africa Refurbished Computers And Laptops Market Revenue (Million), by Import Market Analysis (Value & Volume) 2024 & 2032
- Figure 152: Middle East and Africa Refurbished Computers And Laptops Market Volume (K Unit), by Import Market Analysis (Value & Volume) 2024 & 2032
- Figure 153: Middle East and Africa Refurbished Computers And Laptops Market Revenue Share (%), by Import Market Analysis (Value & Volume) 2024 & 2032
- Figure 154: Middle East and Africa Refurbished Computers And Laptops Market Volume Share (%), by Import Market Analysis (Value & Volume) 2024 & 2032
- Figure 155: Middle East and Africa Refurbished Computers And Laptops Market Revenue (Million), by Export Market Analysis (Value & Volume) 2024 & 2032
- Figure 156: Middle East and Africa Refurbished Computers And Laptops Market Volume (K Unit), by Export Market Analysis (Value & Volume) 2024 & 2032
- Figure 157: Middle East and Africa Refurbished Computers And Laptops Market Revenue Share (%), by Export Market Analysis (Value & Volume) 2024 & 2032
- Figure 158: Middle East and Africa Refurbished Computers And Laptops Market Volume Share (%), by Export Market Analysis (Value & Volume) 2024 & 2032
- Figure 159: Middle East and Africa Refurbished Computers And Laptops Market Revenue (Million), by Price Trend Analysis 2024 & 2032
- Figure 160: Middle East and Africa Refurbished Computers And Laptops Market Volume (K Unit), by Price Trend Analysis 2024 & 2032
- Figure 161: Middle East and Africa Refurbished Computers And Laptops Market Revenue Share (%), by Price Trend Analysis 2024 & 2032
- Figure 162: Middle East and Africa Refurbished Computers And Laptops Market Volume Share (%), by Price Trend Analysis 2024 & 2032
- Figure 163: Middle East and Africa Refurbished Computers And Laptops Market Revenue (Million), by Country 2024 & 2032
- Figure 164: Middle East and Africa Refurbished Computers And Laptops Market Volume (K Unit), by Country 2024 & 2032
- Figure 165: Middle East and Africa Refurbished Computers And Laptops Market Revenue Share (%), by Country 2024 & 2032
- Figure 166: Middle East and Africa Refurbished Computers And Laptops Market Volume Share (%), by Country 2024 & 2032
List of Tables
- Table 1: Global Refurbished Computers And Laptops Market Revenue Million Forecast, by Region 2019 & 2032
- Table 2: Global Refurbished Computers And Laptops Market Volume K Unit Forecast, by Region 2019 & 2032
- Table 3: Global Refurbished Computers And Laptops Market Revenue Million Forecast, by Production Analysis 2019 & 2032
- Table 4: Global Refurbished Computers And Laptops Market Volume K Unit Forecast, by Production Analysis 2019 & 2032
- Table 5: Global Refurbished Computers And Laptops Market Revenue Million Forecast, by Consumption Analysis 2019 & 2032
- Table 6: Global Refurbished Computers And Laptops Market Volume K Unit Forecast, by Consumption Analysis 2019 & 2032
- Table 7: Global Refurbished Computers And Laptops Market Revenue Million Forecast, by Import Market Analysis (Value & Volume) 2019 & 2032
- Table 8: Global Refurbished Computers And Laptops Market Volume K Unit Forecast, by Import Market Analysis (Value & Volume) 2019 & 2032
- Table 9: Global Refurbished Computers And Laptops Market Revenue Million Forecast, by Export Market Analysis (Value & Volume) 2019 & 2032
- Table 10: Global Refurbished Computers And Laptops Market Volume K Unit Forecast, by Export Market Analysis (Value & Volume) 2019 & 2032
- Table 11: Global Refurbished Computers And Laptops Market Revenue Million Forecast, by Price Trend Analysis 2019 & 2032
- Table 12: Global Refurbished Computers And Laptops Market Volume K Unit Forecast, by Price Trend Analysis 2019 & 2032
- Table 13: Global Refurbished Computers And Laptops Market Revenue Million Forecast, by Region 2019 & 2032
- Table 14: Global Refurbished Computers And Laptops Market Volume K Unit Forecast, by Region 2019 & 2032
- Table 15: Global Refurbished Computers And Laptops Market Revenue Million Forecast, by Country 2019 & 2032
- Table 16: Global Refurbished Computers And Laptops Market Volume K Unit Forecast, by Country 2019 & 2032
- Table 17: United States Refurbished Computers And Laptops Market Revenue (Million) Forecast, by Application 2019 & 2032
- Table 18: United States Refurbished Computers And Laptops Market Volume (K Unit) Forecast, by Application 2019 & 2032
- Table 19: Canada Refurbished Computers And Laptops Market Revenue (Million) Forecast, by Application 2019 & 2032
- Table 20: Canada Refurbished Computers And Laptops Market Volume (K Unit) Forecast, by Application 2019 & 2032
- Table 21: Mexico Refurbished Computers And Laptops Market Revenue (Million) Forecast, by Application 2019 & 2032
- Table 22: Mexico Refurbished Computers And Laptops Market Volume (K Unit) Forecast, by Application 2019 & 2032
- Table 23: Global Refurbished Computers And Laptops Market Revenue Million Forecast, by Country 2019 & 2032
- Table 24: Global Refurbished Computers And Laptops Market Volume K Unit Forecast, by Country 2019 & 2032
- Table 25: Germany Refurbished Computers And Laptops Market Revenue (Million) Forecast, by Application 2019 & 2032
- Table 26: Germany Refurbished Computers And Laptops Market Volume (K Unit) Forecast, by Application 2019 & 2032
- Table 27: United Kingdom Refurbished Computers And Laptops Market Revenue (Million) Forecast, by Application 2019 & 2032
- Table 28: United Kingdom Refurbished Computers And Laptops Market Volume (K Unit) Forecast, by Application 2019 & 2032
- Table 29: France Refurbished Computers And Laptops Market Revenue (Million) Forecast, by Application 2019 & 2032
- Table 30: France Refurbished Computers And Laptops Market Volume (K Unit) Forecast, by Application 2019 & 2032
- Table 31: Spain Refurbished Computers And Laptops Market Revenue (Million) Forecast, by Application 2019 & 2032
- Table 32: Spain Refurbished Computers And Laptops Market Volume (K Unit) Forecast, by Application 2019 & 2032
- Table 33: Italy Refurbished Computers And Laptops Market Revenue (Million) Forecast, by Application 2019 & 2032
- Table 34: Italy Refurbished Computers And Laptops Market Volume (K Unit) Forecast, by Application 2019 & 2032
- Table 35: Spain Refurbished Computers And Laptops Market Revenue (Million) Forecast, by Application 2019 & 2032
- Table 36: Spain Refurbished Computers And Laptops Market Volume (K Unit) Forecast, by Application 2019 & 2032
- Table 37: Belgium Refurbished Computers And Laptops Market Revenue (Million) Forecast, by Application 2019 & 2032
- Table 38: Belgium Refurbished Computers And Laptops Market Volume (K Unit) Forecast, by Application 2019 & 2032
- Table 39: Netherland Refurbished Computers And Laptops Market Revenue (Million) Forecast, by Application 2019 & 2032
- Table 40: Netherland Refurbished Computers And Laptops Market Volume (K Unit) Forecast, by Application 2019 & 2032
- Table 41: Nordics Refurbished Computers And Laptops Market Revenue (Million) Forecast, by Application 2019 & 2032
- Table 42: Nordics Refurbished Computers And Laptops Market Volume (K Unit) Forecast, by Application 2019 & 2032
- Table 43: Rest of Europe Refurbished Computers And Laptops Market Revenue (Million) Forecast, by Application 2019 & 2032
- Table 44: Rest of Europe Refurbished Computers And Laptops Market Volume (K Unit) Forecast, by Application 2019 & 2032
- Table 45: Global Refurbished Computers And Laptops Market Revenue Million Forecast, by Country 2019 & 2032
- Table 46: Global Refurbished Computers And Laptops Market Volume K Unit Forecast, by Country 2019 & 2032
- Table 47: China Refurbished Computers And Laptops Market Revenue (Million) Forecast, by Application 2019 & 2032
- Table 48: China Refurbished Computers And Laptops Market Volume (K Unit) Forecast, by Application 2019 & 2032
- Table 49: Japan Refurbished Computers And Laptops Market Revenue (Million) Forecast, by Application 2019 & 2032
- Table 50: Japan Refurbished Computers And Laptops Market Volume (K Unit) Forecast, by Application 2019 & 2032
- Table 51: India Refurbished Computers And Laptops Market Revenue (Million) Forecast, by Application 2019 & 2032
- Table 52: India Refurbished Computers And Laptops Market Volume (K Unit) Forecast, by Application 2019 & 2032
- Table 53: South Korea Refurbished Computers And Laptops Market Revenue (Million) Forecast, by Application 2019 & 2032
- Table 54: South Korea Refurbished Computers And Laptops Market Volume (K Unit) Forecast, by Application 2019 & 2032
- Table 55: Southeast Asia Refurbished Computers And Laptops Market Revenue (Million) Forecast, by Application 2019 & 2032
- Table 56: Southeast Asia Refurbished Computers And Laptops Market Volume (K Unit) Forecast, by Application 2019 & 2032
- Table 57: Australia Refurbished Computers And Laptops Market Revenue (Million) Forecast, by Application 2019 & 2032
- Table 58: Australia Refurbished Computers And Laptops Market Volume (K Unit) Forecast, by Application 2019 & 2032
- Table 59: Indonesia Refurbished Computers And Laptops Market Revenue (Million) Forecast, by Application 2019 & 2032
- Table 60: Indonesia Refurbished Computers And Laptops Market Volume (K Unit) Forecast, by Application 2019 & 2032
- Table 61: Phillipes Refurbished Computers And Laptops Market Revenue (Million) Forecast, by Application 2019 & 2032
- Table 62: Phillipes Refurbished Computers And Laptops Market Volume (K Unit) Forecast, by Application 2019 & 2032
- Table 63: Singapore Refurbished Computers And Laptops Market Revenue (Million) Forecast, by Application 2019 & 2032
- Table 64: Singapore Refurbished Computers And Laptops Market Volume (K Unit) Forecast, by Application 2019 & 2032
- Table 65: Thailandc Refurbished Computers And Laptops Market Revenue (Million) Forecast, by Application 2019 & 2032
- Table 66: Thailandc Refurbished Computers And Laptops Market Volume (K Unit) Forecast, by Application 2019 & 2032
- Table 67: Rest of Asia Pacific Refurbished Computers And Laptops Market Revenue (Million) Forecast, by Application 2019 & 2032
- Table 68: Rest of Asia Pacific Refurbished Computers And Laptops Market Volume (K Unit) Forecast, by Application 2019 & 2032
- Table 69: Global Refurbished Computers And Laptops Market Revenue Million Forecast, by Country 2019 & 2032
- Table 70: Global Refurbished Computers And Laptops Market Volume K Unit Forecast, by Country 2019 & 2032
- Table 71: Brazil Refurbished Computers And Laptops Market Revenue (Million) Forecast, by Application 2019 & 2032
- Table 72: Brazil Refurbished Computers And Laptops Market Volume (K Unit) Forecast, by Application 2019 & 2032
- Table 73: Argentina Refurbished Computers And Laptops Market Revenue (Million) Forecast, by Application 2019 & 2032
- Table 74: Argentina Refurbished Computers And Laptops Market Volume (K Unit) Forecast, by Application 2019 & 2032
- Table 75: Peru Refurbished Computers And Laptops Market Revenue (Million) Forecast, by Application 2019 & 2032
- Table 76: Peru Refurbished Computers And Laptops Market Volume (K Unit) Forecast, by Application 2019 & 2032
- Table 77: Chile Refurbished Computers And Laptops Market Revenue (Million) Forecast, by Application 2019 & 2032
- Table 78: Chile Refurbished Computers And Laptops Market Volume (K Unit) Forecast, by Application 2019 & 2032
- Table 79: Colombia Refurbished Computers And Laptops Market Revenue (Million) Forecast, by Application 2019 & 2032
- Table 80: Colombia Refurbished Computers And Laptops Market Volume (K Unit) Forecast, by Application 2019 & 2032
- Table 81: Ecuador Refurbished Computers And Laptops Market Revenue (Million) Forecast, by Application 2019 & 2032
- Table 82: Ecuador Refurbished Computers And Laptops Market Volume (K Unit) Forecast, by Application 2019 & 2032
- Table 83: Venezuela Refurbished Computers And Laptops Market Revenue (Million) Forecast, by Application 2019 & 2032
- Table 84: Venezuela Refurbished Computers And Laptops Market Volume (K Unit) Forecast, by Application 2019 & 2032
- Table 85: Rest of South America Refurbished Computers And Laptops Market Revenue (Million) Forecast, by Application 2019 & 2032
- Table 86: Rest of South America Refurbished Computers And Laptops Market Volume (K Unit) Forecast, by Application 2019 & 2032
- Table 87: Global Refurbished Computers And Laptops Market Revenue Million Forecast, by Country 2019 & 2032
- Table 88: Global Refurbished Computers And Laptops Market Volume K Unit Forecast, by Country 2019 & 2032
- Table 89: United Arab Emirates Refurbished Computers And Laptops Market Revenue (Million) Forecast, by Application 2019 & 2032
- Table 90: United Arab Emirates Refurbished Computers And Laptops Market Volume (K Unit) Forecast, by Application 2019 & 2032
- Table 91: Saudi Arabia Refurbished Computers And Laptops Market Revenue (Million) Forecast, by Application 2019 & 2032
- Table 92: Saudi Arabia Refurbished Computers And Laptops Market Volume (K Unit) Forecast, by Application 2019 & 2032
- Table 93: South Africa Refurbished Computers And Laptops Market Revenue (Million) Forecast, by Application 2019 & 2032
- Table 94: South Africa Refurbished Computers And Laptops Market Volume (K Unit) Forecast, by Application 2019 & 2032
- Table 95: Rest of Middle East and Africa Refurbished Computers And Laptops Market Revenue (Million) Forecast, by Application 2019 & 2032
- Table 96: Rest of Middle East and Africa Refurbished Computers And Laptops Market Volume (K Unit) Forecast, by Application 2019 & 2032
- Table 97: Global Refurbished Computers And Laptops Market Revenue Million Forecast, by Production Analysis 2019 & 2032
- Table 98: Global Refurbished Computers And Laptops Market Volume K Unit Forecast, by Production Analysis 2019 & 2032
- Table 99: Global Refurbished Computers And Laptops Market Revenue Million Forecast, by Consumption Analysis 2019 & 2032
- Table 100: Global Refurbished Computers And Laptops Market Volume K Unit Forecast, by Consumption Analysis 2019 & 2032
- Table 101: Global Refurbished Computers And Laptops Market Revenue Million Forecast, by Import Market Analysis (Value & Volume) 2019 & 2032
- Table 102: Global Refurbished Computers And Laptops Market Volume K Unit Forecast, by Import Market Analysis (Value & Volume) 2019 & 2032
- Table 103: Global Refurbished Computers And Laptops Market Revenue Million Forecast, by Export Market Analysis (Value & Volume) 2019 & 2032
- Table 104: Global Refurbished Computers And Laptops Market Volume K Unit Forecast, by Export Market Analysis (Value & Volume) 2019 & 2032
- Table 105: Global Refurbished Computers And Laptops Market Revenue Million Forecast, by Price Trend Analysis 2019 & 2032
- Table 106: Global Refurbished Computers And Laptops Market Volume K Unit Forecast, by Price Trend Analysis 2019 & 2032
- Table 107: Global Refurbished Computers And Laptops Market Revenue Million Forecast, by Country 2019 & 2032
- Table 108: Global Refurbished Computers And Laptops Market Volume K Unit Forecast, by Country 2019 & 2032
- Table 109: Global Refurbished Computers And Laptops Market Revenue Million Forecast, by Production Analysis 2019 & 2032
- Table 110: Global Refurbished Computers And Laptops Market Volume K Unit Forecast, by Production Analysis 2019 & 2032
- Table 111: Global Refurbished Computers And Laptops Market Revenue Million Forecast, by Consumption Analysis 2019 & 2032
- Table 112: Global Refurbished Computers And Laptops Market Volume K Unit Forecast, by Consumption Analysis 2019 & 2032
- Table 113: Global Refurbished Computers And Laptops Market Revenue Million Forecast, by Import Market Analysis (Value & Volume) 2019 & 2032
- Table 114: Global Refurbished Computers And Laptops Market Volume K Unit Forecast, by Import Market Analysis (Value & Volume) 2019 & 2032
- Table 115: Global Refurbished Computers And Laptops Market Revenue Million Forecast, by Export Market Analysis (Value & Volume) 2019 & 2032
- Table 116: Global Refurbished Computers And Laptops Market Volume K Unit Forecast, by Export Market Analysis (Value & Volume) 2019 & 2032
- Table 117: Global Refurbished Computers And Laptops Market Revenue Million Forecast, by Price Trend Analysis 2019 & 2032
- Table 118: Global Refurbished Computers And Laptops Market Volume K Unit Forecast, by Price Trend Analysis 2019 & 2032
- Table 119: Global Refurbished Computers And Laptops Market Revenue Million Forecast, by Country 2019 & 2032
- Table 120: Global Refurbished Computers And Laptops Market Volume K Unit Forecast, by Country 2019 & 2032
- Table 121: Global Refurbished Computers And Laptops Market Revenue Million Forecast, by Production Analysis 2019 & 2032
- Table 122: Global Refurbished Computers And Laptops Market Volume K Unit Forecast, by Production Analysis 2019 & 2032
- Table 123: Global Refurbished Computers And Laptops Market Revenue Million Forecast, by Consumption Analysis 2019 & 2032
- Table 124: Global Refurbished Computers And Laptops Market Volume K Unit Forecast, by Consumption Analysis 2019 & 2032
- Table 125: Global Refurbished Computers And Laptops Market Revenue Million Forecast, by Import Market Analysis (Value & Volume) 2019 & 2032
- Table 126: Global Refurbished Computers And Laptops Market Volume K Unit Forecast, by Import Market Analysis (Value & Volume) 2019 & 2032
- Table 127: Global Refurbished Computers And Laptops Market Revenue Million Forecast, by Export Market Analysis (Value & Volume) 2019 & 2032
- Table 128: Global Refurbished Computers And Laptops Market Volume K Unit Forecast, by Export Market Analysis (Value & Volume) 2019 & 2032
- Table 129: Global Refurbished Computers And Laptops Market Revenue Million Forecast, by Price Trend Analysis 2019 & 2032
- Table 130: Global Refurbished Computers And Laptops Market Volume K Unit Forecast, by Price Trend Analysis 2019 & 2032
- Table 131: Global Refurbished Computers And Laptops Market Revenue Million Forecast, by Country 2019 & 2032
- Table 132: Global Refurbished Computers And Laptops Market Volume K Unit Forecast, by Country 2019 & 2032
- Table 133: Global Refurbished Computers And Laptops Market Revenue Million Forecast, by Production Analysis 2019 & 2032
- Table 134: Global Refurbished Computers And Laptops Market Volume K Unit Forecast, by Production Analysis 2019 & 2032
- Table 135: Global Refurbished Computers And Laptops Market Revenue Million Forecast, by Consumption Analysis 2019 & 2032
- Table 136: Global Refurbished Computers And Laptops Market Volume K Unit Forecast, by Consumption Analysis 2019 & 2032
- Table 137: Global Refurbished Computers And Laptops Market Revenue Million Forecast, by Import Market Analysis (Value & Volume) 2019 & 2032
- Table 138: Global Refurbished Computers And Laptops Market Volume K Unit Forecast, by Import Market Analysis (Value & Volume) 2019 & 2032
- Table 139: Global Refurbished Computers And Laptops Market Revenue Million Forecast, by Export Market Analysis (Value & Volume) 2019 & 2032
- Table 140: Global Refurbished Computers And Laptops Market Volume K Unit Forecast, by Export Market Analysis (Value & Volume) 2019 & 2032
- Table 141: Global Refurbished Computers And Laptops Market Revenue Million Forecast, by Price Trend Analysis 2019 & 2032
- Table 142: Global Refurbished Computers And Laptops Market Volume K Unit Forecast, by Price Trend Analysis 2019 & 2032
- Table 143: Global Refurbished Computers And Laptops Market Revenue Million Forecast, by Country 2019 & 2032
- Table 144: Global Refurbished Computers And Laptops Market Volume K Unit Forecast, by Country 2019 & 2032
- Table 145: Global Refurbished Computers And Laptops Market Revenue Million Forecast, by Production Analysis 2019 & 2032
- Table 146: Global Refurbished Computers And Laptops Market Volume K Unit Forecast, by Production Analysis 2019 & 2032
- Table 147: Global Refurbished Computers And Laptops Market Revenue Million Forecast, by Consumption Analysis 2019 & 2032
- Table 148: Global Refurbished Computers And Laptops Market Volume K Unit Forecast, by Consumption Analysis 2019 & 2032
- Table 149: Global Refurbished Computers And Laptops Market Revenue Million Forecast, by Import Market Analysis (Value & Volume) 2019 & 2032
- Table 150: Global Refurbished Computers And Laptops Market Volume K Unit Forecast, by Import Market Analysis (Value & Volume) 2019 & 2032
- Table 151: Global Refurbished Computers And Laptops Market Revenue Million Forecast, by Export Market Analysis (Value & Volume) 2019 & 2032
- Table 152: Global Refurbished Computers And Laptops Market Volume K Unit Forecast, by Export Market Analysis (Value & Volume) 2019 & 2032
- Table 153: Global Refurbished Computers And Laptops Market Revenue Million Forecast, by Price Trend Analysis 2019 & 2032
- Table 154: Global Refurbished Computers And Laptops Market Volume K Unit Forecast, by Price Trend Analysis 2019 & 2032
- Table 155: Global Refurbished Computers And Laptops Market Revenue Million Forecast, by Country 2019 & 2032
- Table 156: Global Refurbished Computers And Laptops Market Volume K Unit Forecast, by Country 2019 & 2032
- Table 157: Global Refurbished Computers And Laptops Market Revenue Million Forecast, by Production Analysis 2019 & 2032
- Table 158: Global Refurbished Computers And Laptops Market Volume K Unit Forecast, by Production Analysis 2019 & 2032
- Table 159: Global Refurbished Computers And Laptops Market Revenue Million Forecast, by Consumption Analysis 2019 & 2032
- Table 160: Global Refurbished Computers And Laptops Market Volume K Unit Forecast, by Consumption Analysis 2019 & 2032
- Table 161: Global Refurbished Computers And Laptops Market Revenue Million Forecast, by Import Market Analysis (Value & Volume) 2019 & 2032
- Table 162: Global Refurbished Computers And Laptops Market Volume K Unit Forecast, by Import Market Analysis (Value & Volume) 2019 & 2032
- Table 163: Global Refurbished Computers And Laptops Market Revenue Million Forecast, by Export Market Analysis (Value & Volume) 2019 & 2032
- Table 164: Global Refurbished Computers And Laptops Market Volume K Unit Forecast, by Export Market Analysis (Value & Volume) 2019 & 2032
- Table 165: Global Refurbished Computers And Laptops Market Revenue Million Forecast, by Price Trend Analysis 2019 & 2032
- Table 166: Global Refurbished Computers And Laptops Market Volume K Unit Forecast, by Price Trend Analysis 2019 & 2032
- Table 167: Global Refurbished Computers And Laptops Market Revenue Million Forecast, by Country 2019 & 2032
- Table 168: Global Refurbished Computers And Laptops Market Volume K Unit Forecast, by Country 2019 & 2032
Frequently Asked Questions
1. What is the projected Compound Annual Growth Rate (CAGR) of the Refurbished Computers And Laptops Market?
The projected CAGR is approximately 10.24%.
2. Which companies are prominent players in the Refurbished Computers And Laptops Market?
Key companies in the market include Microsoft, Newegg Inc, Acer Inc, SAMSUNG, Best Buy, HP Development Company L P, Dell Inc, Budli Internet Private Limited, Amazon Renewed, Lenovo Group Ltd, Apple Inc.
3. What are the main segments of the Refurbished Computers And Laptops Market?
The market segments include Production Analysis, Consumption Analysis, Import Market Analysis (Value & Volume), Export Market Analysis (Value & Volume), Price Trend Analysis.
4. Can you provide details about the market size?
The market size is estimated to be USD XX Million as of 2022.
5. What are some drivers contributing to market growth?
Cost Savings and Affordability of the Refurbished Devices; Growing awareness about E waste and Environmental Consciousness.
6. What are the notable trends driving market growth?
Growing awareness about E waste and Environmental Consciousness.
7. Are there any restraints impacting market growth?
Lack of Awareness About Intellectual Property Outsourcing.
8. Can you provide examples of recent developments in the market?
May 2023: In a collaborative effort, Li-Cycle Holdings Corp. and Shift2 joined forces to generously donate 60 refurbished laptops to the graduating seniors of Edison Career and Technology High School. Li-Cycle is a pioneering leader in lithium-ion battery reserve recovery and holds a prominent position as the leading lithium-ion battery recycling company in North America. These refurbished devices have been distributed to students who have either completed a college application, submitted a financial aid request, or actively pursued employment in related fields.
9. What pricing options are available for accessing the report?
Pricing options include single-user, multi-user, and enterprise licenses priced at USD 4750, USD 5250, and USD 8750 respectively.
10. Is the market size provided in terms of value or volume?
The market size is provided in terms of value, measured in Million and volume, measured in K Unit.
11. Are there any specific market keywords associated with the report?
Yes, the market keyword associated with the report is "Refurbished Computers And Laptops Market," which aids in identifying and referencing the specific market segment covered.
12. How do I determine which pricing option suits my needs best?
The pricing options vary based on user requirements and access needs. Individual users may opt for single-user licenses, while businesses requiring broader access may choose multi-user or enterprise licenses for cost-effective access to the report.
13. Are there any additional resources or data provided in the Refurbished Computers And Laptops Market report?
While the report offers comprehensive insights, it's advisable to review the specific contents or supplementary materials provided to ascertain if additional resources or data are available.
14. How can I stay updated on further developments or reports in the Refurbished Computers And Laptops Market?
To stay informed about further developments, trends, and reports in the Refurbished Computers And Laptops Market, consider subscribing to industry newsletters, following relevant companies and organizations, or regularly checking reputable industry news sources and publications.
Methodology
Step 1 - Identification of Relevant Samples Size from Population Database


Step 2 - Approaches for Defining Global Market Size (Value, Volume* & Price*)

Note*: In applicable scenarios
Step 3 - Data Sources
Primary Research
- Web Analytics
- Survey Reports
- Research Institute
- Latest Research Reports
- Opinion Leaders
Secondary Research
- Annual Reports
- White Paper
- Latest Press Release
- Industry Association
- Paid Database
- Investor Presentations

Step 4 - Data Triangulation
Involves using different sources of information in order to increase the validity of a study
These sources are likely to be stakeholders in a program - participants, other researchers, program staff, other community members, and so on.
Then we put all data in single framework & apply various statistical tools to find out the dynamic on the market.
During the analysis stage, feedback from the stakeholder groups would be compared to determine areas of agreement as well as areas of divergence
