

Key Insights
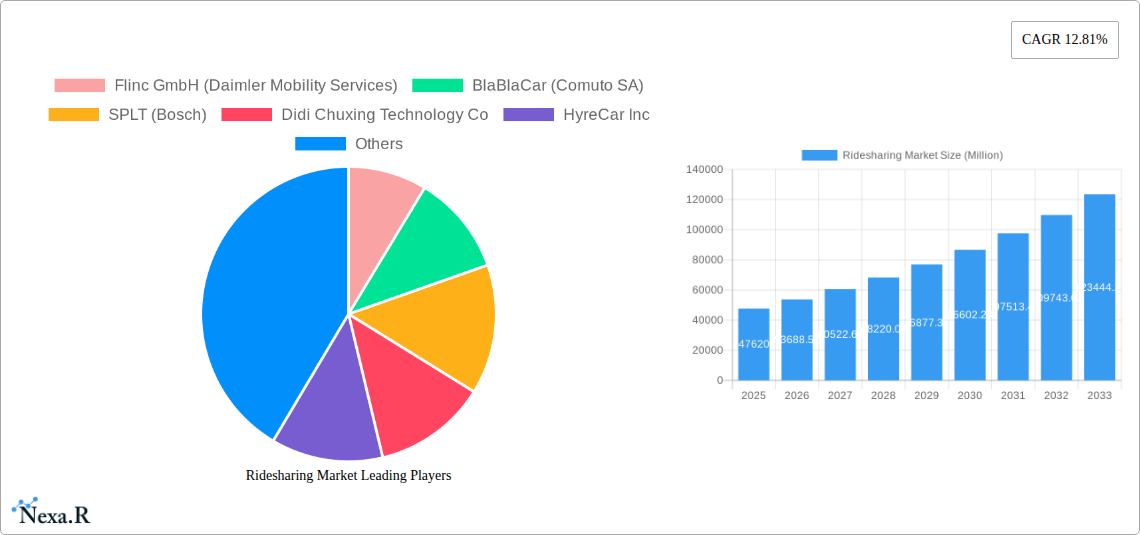
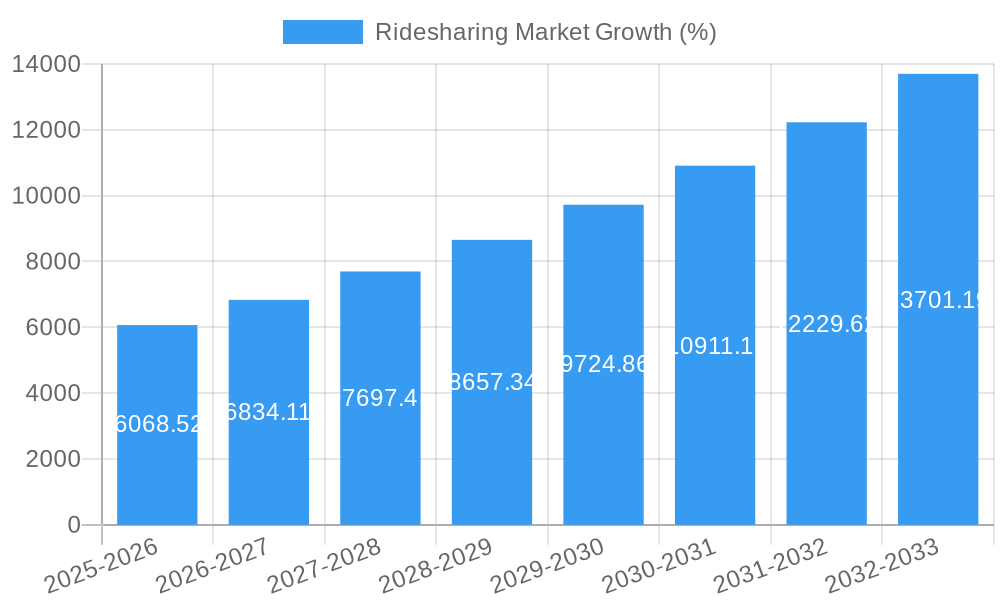
The ridesharing market, valued at $47.62 billion in 2025, is experiencing robust growth, projected to expand at a compound annual growth rate (CAGR) of 12.81% from 2025 to 2033. This surge is driven by several key factors. Increasing urbanization and traffic congestion in major cities globally are pushing commuters towards more efficient and cost-effective transportation alternatives. The rising adoption of smartphones and readily available mobile applications has significantly simplified the process of booking and using ridesharing services. Furthermore, the growing awareness of environmental concerns and the desire for sustainable transportation options are contributing to the market's expansion. The segment breakdown reveals a dynamic landscape: App-based services dominate, reflecting the user preference for convenience and real-time accessibility. While fixed ridesharing offers predictable pricing, the dynamic model’s flexibility appeals to a broader customer base. Corporate ridesharing is also gaining traction, driven by companies seeking efficient employee transportation solutions. North America and Europe currently hold significant market share, but rapid growth is anticipated in Asia-Pacific regions, fueled by increasing disposable incomes and expanding smartphone penetration. Competition among established players and emerging startups is intense, with companies continuously innovating to enhance user experience, improve safety features, and expand service offerings.
The market's growth, however, faces certain challenges. Regulatory hurdles and varying legal frameworks across different regions pose significant obstacles for widespread adoption. Concerns regarding driver safety and passenger security necessitate ongoing improvements in technology and operational procedures. Fluctuations in fuel prices and economic downturns can also impact consumer spending and affect market demand. The ongoing evolution of autonomous vehicle technology presents both opportunities and challenges, potentially disrupting the existing market structure in the long term. The successful players in this market will be those that effectively navigate regulatory landscapes, maintain a strong focus on safety and security, and adapt to the evolving technological landscape while offering competitive pricing and a superior user experience.
Ridesharing Market: A Comprehensive Report (2019-2033)
This comprehensive report provides an in-depth analysis of the Ridesharing Market, encompassing market dynamics, growth trends, regional dominance, product landscape, key players, and future opportunities. The study period covers 2019-2033, with 2025 as the base and estimated year. The report leverages extensive data analysis to provide actionable insights for industry professionals, investors, and strategic decision-makers. The report analyzes both parent market (Transportation Services) and child market (Ridesharing).
Ridesharing Market Dynamics & Structure
The ridesharing market is characterized by a dynamic interplay of factors influencing its structure and growth trajectory. Market concentration is currently moderate, with a few dominant players and numerous smaller niche players. Technological innovation, particularly in app development, autonomous vehicle technology, and electric vehicle integration, is a key driver. Regulatory frameworks, varying significantly across regions, present both opportunities and challenges. Competitive substitutes, including traditional taxis and public transport, continue to influence market share. End-user demographics are expanding, driven by increasing smartphone penetration and urban population growth. M&A activity has been significant in recent years, reflecting industry consolidation and expansion strategies.
- Market Concentration: Moderate, with a few major players holding significant market share (xx%).
- Technological Innovation: Autonomous vehicles, EV integration, and enhanced app features are key drivers.
- Regulatory Landscape: Varies significantly by region; presents opportunities and challenges for market expansion.
- Competitive Substitutes: Traditional taxis, public transport, and personal vehicles compete for market share.
- End-User Demographics: Growing urban populations and smartphone penetration are fueling demand.
- M&A Activity: Significant consolidation and strategic acquisitions in recent years (xx deals in the last 5 years).
Ridesharing Market Growth Trends & Insights
The ridesharing market experienced robust growth during the historical period (2019-2024), with a Compound Annual Growth Rate (CAGR) of xx%. Market size, valued at xx Million units in 2025, is projected to reach xx Million units by 2033, driven by increasing adoption rates across various segments. Technological disruptions, including the introduction of shared mobility platforms and advancements in ride-hailing technology, are significantly altering consumer behavior. The shift towards app-based services and the increasing preference for on-demand transportation are reshaping the industry landscape. Growth is influenced by factors including urbanization, changing consumer preferences, and technological advancements. Market penetration is expected to increase significantly in developing economies.
Dominant Regions, Countries, or Segments in Ridesharing Market
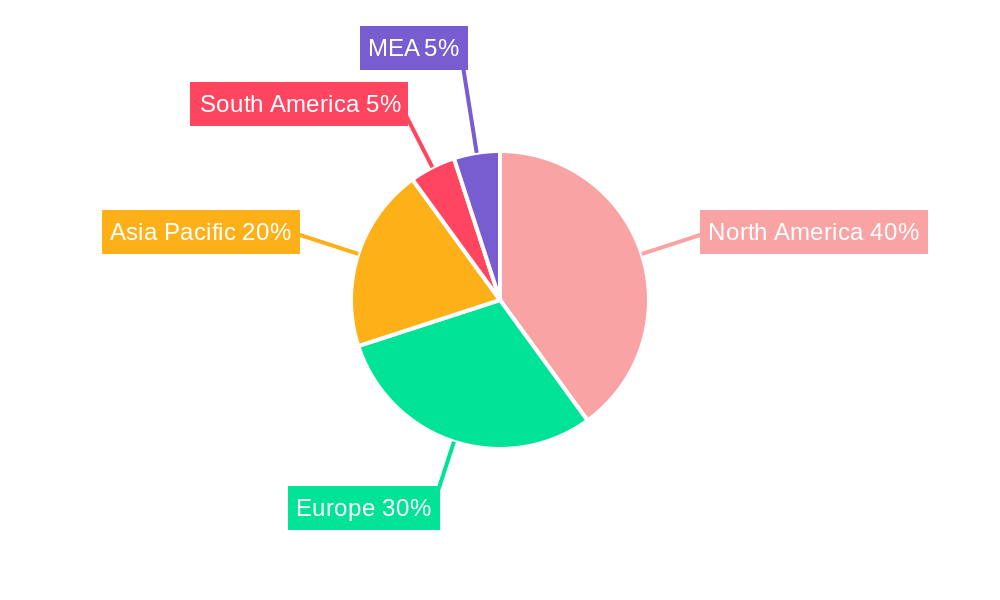
North America and Asia are the leading regions, with North America currently dominating due to high adoption rates and established market players. Within these regions, major metropolitan areas exhibit the highest market concentration. By Membership Type, Dynamic Ridesharing holds the largest market share, followed by Corporate Ridesharing. App-based services dominate the By Service Type segment due to their convenience and accessibility.
- Dominant Region: North America (xx% market share in 2025) followed by Asia (xx%)
- Key Drivers (North America): High smartphone penetration, robust technological infrastructure, and favorable regulatory environment.
- Key Drivers (Asia): Rapid urbanization, increasing disposable incomes, and growing adoption of smartphone-based services.
- Dominant Segment (Membership Type): Dynamic Ridesharing (xx% market share in 2025)
- Dominant Segment (Service Type): App-Based (xx% market share in 2025)
Ridesharing Market Product Landscape
Product innovation in the ridesharing market focuses on enhancing user experience, improving safety features, and integrating sustainable transportation options. Key features include real-time tracking, fare transparency, diverse vehicle options (including electric vehicles), and seamless payment systems. Performance metrics like ride completion rates, customer satisfaction scores, and driver retention are crucial indicators of success. Unique selling propositions often revolve around providing convenient, affordable, and safe transportation solutions. Technological advancements are continuously improving the efficiency and reliability of these services.
Key Drivers, Barriers & Challenges in Ridesharing Market
Key Drivers:
- Increasing urbanization and commuting needs.
- Growing adoption of smartphones and mobile apps.
- Technological advancements in ride-hailing platforms and autonomous driving.
- Government initiatives promoting shared mobility and sustainable transportation.
Key Challenges:
- Intense competition from established players and new entrants.
- Regulatory uncertainty and varying regulations across different jurisdictions ( xx% of companies face significant regulatory challenges).
- Driver shortages and associated labor costs.
- Safety and security concerns related to passenger and driver well-being.
Emerging Opportunities in Ridesharing Market
- Expansion into underserved markets and regions.
- Integration of innovative technologies such as AI, IoT, and blockchain.
- Development of specialized ridesharing services targeting specific demographics or needs (e.g., elderly care, pet transportation).
- Increased focus on sustainable transportation options, such as electric vehicle fleets and carbon offset programs.
Growth Accelerators in the Ridesharing Market Industry
Long-term growth in the ridesharing market will be driven by the continued adoption of advanced technologies, strategic partnerships between ridesharing platforms and other service providers, and aggressive market expansion strategies targeting underserved regions. The integration of autonomous vehicle technology holds significant potential for transforming the industry.
Key Players Shaping the Ridesharing Market Market
- Flinc GmbH (Daimler Mobility Services)
- BlaBlaCar (Comuto SA)
- SPLT (Bosch)
- Didi Chuxing Technology Co
- HyreCar Inc
- KINTO Join Limited
- Wunder Mobility Solutions GmbH
- Kangaride Canada Co
- GoMore
- Klaxit SAS (formerly Wayzup)
- Scoop Technologies Inc
- Vride Inc (Acquired by Enterprise Holdings Inc)
- CarpoolWorld (Datasphere Corporation)
- Via Transportation Inc
- Zimride Inc
Notable Milestones in Ridesharing Market Sector
- June 2022: Uber launches UberX Share, offering a 20% discount for shared rides. This reintroduces carpooling with a monetary incentive, impacting market competitiveness.
- February 2022: Avolon and AirAsia partner to create a ridesharing platform in Southeast Asia using eVTOL aircraft by 2025. This signifies a move towards advanced air mobility and potential disruption of ground-based ridesharing.
In-Depth Ridesharing Market Market Outlook
The ridesharing market is poised for continued strong growth, driven by technological advancements, increasing urbanization, and evolving consumer preferences. Strategic partnerships and expansion into new markets represent significant opportunities for established players and new entrants. The long-term potential is substantial, with the market projected to reach xx Million units by 2033. Companies that successfully adapt to evolving technological and regulatory landscapes are well-positioned for success.
Ridesharing Market Segmentation
-
1. Membership Type
- 1.1. Fixed Ridesharing
- 1.2. Dynamic Ridesharing
- 1.3. Corporate Ridesharing
-
2. Service Type
- 2.1. Web-Based
- 2.2. App-Based
- 2.3. Web and App Based
Ridesharing Market Segmentation By Geography
- 1. North America
- 2. Europe
- 3. Asia
- 4. Australia and New Zealand
- 5. Latin America
- 6. Middle East and Africa
Ridesharing Market REPORT HIGHLIGHTS
| Aspects | Details |
|---|---|
| Study Period | 2019-2033 |
| Base Year | 2024 |
| Estimated Year | 2025 |
| Forecast Period | 2025-2033 |
| Historical Period | 2019-2024 |
| Growth Rate | CAGR of 12.81% from 2019-2033 |
| Segmentation |
|
Table of Contents
- 1. Introduction
- 1.1. Research Scope
- 1.2. Market Segmentation
- 1.3. Research Methodology
- 1.4. Definitions and Assumptions
- 2. Executive Summary
- 2.1. Introduction
- 3. Market Dynamics
- 3.1. Introduction
- 3.2. Market Drivers
- 3.2.1 Cost Advantage and Increasing Availability of Carpooling/Corporate Pooling Services; Incentives and Rebates Provided by Governments in Major Markets
- 3.2.2 such as France; Increasing Cost of Vehicle Ownership and Environmental Benefits
- 3.3. Market Restrains
- 3.3.1. Technical Challenges Pertaining to CMP Technique
- 3.4. Market Trends
- 3.4.1. COVID-19 Has Posed Significant Threat to the Market
- 4. Market Factor Analysis
- 4.1. Porters Five Forces
- 4.2. Supply/Value Chain
- 4.3. PESTEL analysis
- 4.4. Market Entropy
- 4.5. Patent/Trademark Analysis
- 5. Global Ridesharing Market Analysis, Insights and Forecast, 2019-2031
- 5.1. Market Analysis, Insights and Forecast - by Membership Type
- 5.1.1. Fixed Ridesharing
- 5.1.2. Dynamic Ridesharing
- 5.1.3. Corporate Ridesharing
- 5.2. Market Analysis, Insights and Forecast - by Service Type
- 5.2.1. Web-Based
- 5.2.2. App-Based
- 5.2.3. Web and App Based
- 5.3. Market Analysis, Insights and Forecast - by Region
- 5.3.1. North America
- 5.3.2. Europe
- 5.3.3. Asia
- 5.3.4. Australia and New Zealand
- 5.3.5. Latin America
- 5.3.6. Middle East and Africa
- 5.1. Market Analysis, Insights and Forecast - by Membership Type
- 6. North America Ridesharing Market Analysis, Insights and Forecast, 2019-2031
- 6.1. Market Analysis, Insights and Forecast - by Membership Type
- 6.1.1. Fixed Ridesharing
- 6.1.2. Dynamic Ridesharing
- 6.1.3. Corporate Ridesharing
- 6.2. Market Analysis, Insights and Forecast - by Service Type
- 6.2.1. Web-Based
- 6.2.2. App-Based
- 6.2.3. Web and App Based
- 6.1. Market Analysis, Insights and Forecast - by Membership Type
- 7. Europe Ridesharing Market Analysis, Insights and Forecast, 2019-2031
- 7.1. Market Analysis, Insights and Forecast - by Membership Type
- 7.1.1. Fixed Ridesharing
- 7.1.2. Dynamic Ridesharing
- 7.1.3. Corporate Ridesharing
- 7.2. Market Analysis, Insights and Forecast - by Service Type
- 7.2.1. Web-Based
- 7.2.2. App-Based
- 7.2.3. Web and App Based
- 7.1. Market Analysis, Insights and Forecast - by Membership Type
- 8. Asia Ridesharing Market Analysis, Insights and Forecast, 2019-2031
- 8.1. Market Analysis, Insights and Forecast - by Membership Type
- 8.1.1. Fixed Ridesharing
- 8.1.2. Dynamic Ridesharing
- 8.1.3. Corporate Ridesharing
- 8.2. Market Analysis, Insights and Forecast - by Service Type
- 8.2.1. Web-Based
- 8.2.2. App-Based
- 8.2.3. Web and App Based
- 8.1. Market Analysis, Insights and Forecast - by Membership Type
- 9. Australia and New Zealand Ridesharing Market Analysis, Insights and Forecast, 2019-2031
- 9.1. Market Analysis, Insights and Forecast - by Membership Type
- 9.1.1. Fixed Ridesharing
- 9.1.2. Dynamic Ridesharing
- 9.1.3. Corporate Ridesharing
- 9.2. Market Analysis, Insights and Forecast - by Service Type
- 9.2.1. Web-Based
- 9.2.2. App-Based
- 9.2.3. Web and App Based
- 9.1. Market Analysis, Insights and Forecast - by Membership Type
- 10. Latin America Ridesharing Market Analysis, Insights and Forecast, 2019-2031
- 10.1. Market Analysis, Insights and Forecast - by Membership Type
- 10.1.1. Fixed Ridesharing
- 10.1.2. Dynamic Ridesharing
- 10.1.3. Corporate Ridesharing
- 10.2. Market Analysis, Insights and Forecast - by Service Type
- 10.2.1. Web-Based
- 10.2.2. App-Based
- 10.2.3. Web and App Based
- 10.1. Market Analysis, Insights and Forecast - by Membership Type
- 11. Middle East and Africa Ridesharing Market Analysis, Insights and Forecast, 2019-2031
- 11.1. Market Analysis, Insights and Forecast - by Membership Type
- 11.1.1. Fixed Ridesharing
- 11.1.2. Dynamic Ridesharing
- 11.1.3. Corporate Ridesharing
- 11.2. Market Analysis, Insights and Forecast - by Service Type
- 11.2.1. Web-Based
- 11.2.2. App-Based
- 11.2.3. Web and App Based
- 11.1. Market Analysis, Insights and Forecast - by Membership Type
- 12. North America Ridesharing Market Analysis, Insights and Forecast, 2019-2031
- 12.1. Market Analysis, Insights and Forecast - By Country/Sub-region
- 12.1.1 United States
- 12.1.2 Canada
- 12.1.3 Mexico
- 13. Europe Ridesharing Market Analysis, Insights and Forecast, 2019-2031
- 13.1. Market Analysis, Insights and Forecast - By Country/Sub-region
- 13.1.1 Germany
- 13.1.2 United Kingdom
- 13.1.3 France
- 13.1.4 Spain
- 13.1.5 Italy
- 13.1.6 Spain
- 13.1.7 Belgium
- 13.1.8 Netherland
- 13.1.9 Nordics
- 13.1.10 Rest of Europe
- 14. Asia Pacific Ridesharing Market Analysis, Insights and Forecast, 2019-2031
- 14.1. Market Analysis, Insights and Forecast - By Country/Sub-region
- 14.1.1 China
- 14.1.2 Japan
- 14.1.3 India
- 14.1.4 South Korea
- 14.1.5 Southeast Asia
- 14.1.6 Australia
- 14.1.7 Indonesia
- 14.1.8 Phillipes
- 14.1.9 Singapore
- 14.1.10 Thailandc
- 14.1.11 Rest of Asia Pacific
- 15. South America Ridesharing Market Analysis, Insights and Forecast, 2019-2031
- 15.1. Market Analysis, Insights and Forecast - By Country/Sub-region
- 15.1.1 Brazil
- 15.1.2 Argentina
- 15.1.3 Peru
- 15.1.4 Chile
- 15.1.5 Colombia
- 15.1.6 Ecuador
- 15.1.7 Venezuela
- 15.1.8 Rest of South America
- 16. North America Ridesharing Market Analysis, Insights and Forecast, 2019-2031
- 16.1. Market Analysis, Insights and Forecast - By Country/Sub-region
- 16.1.1 United States
- 16.1.2 Canada
- 16.1.3 Mexico
- 17. MEA Ridesharing Market Analysis, Insights and Forecast, 2019-2031
- 17.1. Market Analysis, Insights and Forecast - By Country/Sub-region
- 17.1.1 United Arab Emirates
- 17.1.2 Saudi Arabia
- 17.1.3 South Africa
- 17.1.4 Rest of Middle East and Africa
- 18. Competitive Analysis
- 18.1. Global Market Share Analysis 2024
- 18.2. Company Profiles
- 18.2.1 Flinc GmbH (Daimler Mobility Services)
- 18.2.1.1. Overview
- 18.2.1.2. Products
- 18.2.1.3. SWOT Analysis
- 18.2.1.4. Recent Developments
- 18.2.1.5. Financials (Based on Availability)
- 18.2.2 BlaBlaCar (Comuto SA)
- 18.2.2.1. Overview
- 18.2.2.2. Products
- 18.2.2.3. SWOT Analysis
- 18.2.2.4. Recent Developments
- 18.2.2.5. Financials (Based on Availability)
- 18.2.3 SPLT (Bosch)
- 18.2.3.1. Overview
- 18.2.3.2. Products
- 18.2.3.3. SWOT Analysis
- 18.2.3.4. Recent Developments
- 18.2.3.5. Financials (Based on Availability)
- 18.2.4 Didi Chuxing Technology Co
- 18.2.4.1. Overview
- 18.2.4.2. Products
- 18.2.4.3. SWOT Analysis
- 18.2.4.4. Recent Developments
- 18.2.4.5. Financials (Based on Availability)
- 18.2.5 HyreCar Inc
- 18.2.5.1. Overview
- 18.2.5.2. Products
- 18.2.5.3. SWOT Analysis
- 18.2.5.4. Recent Developments
- 18.2.5.5. Financials (Based on Availability)
- 18.2.6 KINTO Join Limited
- 18.2.6.1. Overview
- 18.2.6.2. Products
- 18.2.6.3. SWOT Analysis
- 18.2.6.4. Recent Developments
- 18.2.6.5. Financials (Based on Availability)
- 18.2.7 Wunder Mobility Solutions GmbH
- 18.2.7.1. Overview
- 18.2.7.2. Products
- 18.2.7.3. SWOT Analysis
- 18.2.7.4. Recent Developments
- 18.2.7.5. Financials (Based on Availability)
- 18.2.8 Kangaride Canada Co
- 18.2.8.1. Overview
- 18.2.8.2. Products
- 18.2.8.3. SWOT Analysis
- 18.2.8.4. Recent Developments
- 18.2.8.5. Financials (Based on Availability)
- 18.2.9 GoMore
- 18.2.9.1. Overview
- 18.2.9.2. Products
- 18.2.9.3. SWOT Analysis
- 18.2.9.4. Recent Developments
- 18.2.9.5. Financials (Based on Availability)
- 18.2.10 Klaxit SAS (formerly Wayzup)
- 18.2.10.1. Overview
- 18.2.10.2. Products
- 18.2.10.3. SWOT Analysis
- 18.2.10.4. Recent Developments
- 18.2.10.5. Financials (Based on Availability)
- 18.2.11 Scoop Technologies Inc
- 18.2.11.1. Overview
- 18.2.11.2. Products
- 18.2.11.3. SWOT Analysis
- 18.2.11.4. Recent Developments
- 18.2.11.5. Financials (Based on Availability)
- 18.2.12 Vride Inc (Acquired by Enterprise Holdings Inc
- 18.2.12.1. Overview
- 18.2.12.2. Products
- 18.2.12.3. SWOT Analysis
- 18.2.12.4. Recent Developments
- 18.2.12.5. Financials (Based on Availability)
- 18.2.13 CarpoolWorld (Datasphere Corporation)
- 18.2.13.1. Overview
- 18.2.13.2. Products
- 18.2.13.3. SWOT Analysis
- 18.2.13.4. Recent Developments
- 18.2.13.5. Financials (Based on Availability)
- 18.2.14 Via Transportation Inc
- 18.2.14.1. Overview
- 18.2.14.2. Products
- 18.2.14.3. SWOT Analysis
- 18.2.14.4. Recent Developments
- 18.2.14.5. Financials (Based on Availability)
- 18.2.15 Zimride Inc
- 18.2.15.1. Overview
- 18.2.15.2. Products
- 18.2.15.3. SWOT Analysis
- 18.2.15.4. Recent Developments
- 18.2.15.5. Financials (Based on Availability)
- 18.2.1 Flinc GmbH (Daimler Mobility Services)
List of Figures
- Figure 1: Global Ridesharing Market Revenue Breakdown (Million, %) by Region 2024 & 2032
- Figure 2: North America Ridesharing Market Revenue (Million), by Country 2024 & 2032
- Figure 3: North America Ridesharing Market Revenue Share (%), by Country 2024 & 2032
- Figure 4: Europe Ridesharing Market Revenue (Million), by Country 2024 & 2032
- Figure 5: Europe Ridesharing Market Revenue Share (%), by Country 2024 & 2032
- Figure 6: Asia Pacific Ridesharing Market Revenue (Million), by Country 2024 & 2032
- Figure 7: Asia Pacific Ridesharing Market Revenue Share (%), by Country 2024 & 2032
- Figure 8: South America Ridesharing Market Revenue (Million), by Country 2024 & 2032
- Figure 9: South America Ridesharing Market Revenue Share (%), by Country 2024 & 2032
- Figure 10: North America Ridesharing Market Revenue (Million), by Country 2024 & 2032
- Figure 11: North America Ridesharing Market Revenue Share (%), by Country 2024 & 2032
- Figure 12: MEA Ridesharing Market Revenue (Million), by Country 2024 & 2032
- Figure 13: MEA Ridesharing Market Revenue Share (%), by Country 2024 & 2032
- Figure 14: North America Ridesharing Market Revenue (Million), by Membership Type 2024 & 2032
- Figure 15: North America Ridesharing Market Revenue Share (%), by Membership Type 2024 & 2032
- Figure 16: North America Ridesharing Market Revenue (Million), by Service Type 2024 & 2032
- Figure 17: North America Ridesharing Market Revenue Share (%), by Service Type 2024 & 2032
- Figure 18: North America Ridesharing Market Revenue (Million), by Country 2024 & 2032
- Figure 19: North America Ridesharing Market Revenue Share (%), by Country 2024 & 2032
- Figure 20: Europe Ridesharing Market Revenue (Million), by Membership Type 2024 & 2032
- Figure 21: Europe Ridesharing Market Revenue Share (%), by Membership Type 2024 & 2032
- Figure 22: Europe Ridesharing Market Revenue (Million), by Service Type 2024 & 2032
- Figure 23: Europe Ridesharing Market Revenue Share (%), by Service Type 2024 & 2032
- Figure 24: Europe Ridesharing Market Revenue (Million), by Country 2024 & 2032
- Figure 25: Europe Ridesharing Market Revenue Share (%), by Country 2024 & 2032
- Figure 26: Asia Ridesharing Market Revenue (Million), by Membership Type 2024 & 2032
- Figure 27: Asia Ridesharing Market Revenue Share (%), by Membership Type 2024 & 2032
- Figure 28: Asia Ridesharing Market Revenue (Million), by Service Type 2024 & 2032
- Figure 29: Asia Ridesharing Market Revenue Share (%), by Service Type 2024 & 2032
- Figure 30: Asia Ridesharing Market Revenue (Million), by Country 2024 & 2032
- Figure 31: Asia Ridesharing Market Revenue Share (%), by Country 2024 & 2032
- Figure 32: Australia and New Zealand Ridesharing Market Revenue (Million), by Membership Type 2024 & 2032
- Figure 33: Australia and New Zealand Ridesharing Market Revenue Share (%), by Membership Type 2024 & 2032
- Figure 34: Australia and New Zealand Ridesharing Market Revenue (Million), by Service Type 2024 & 2032
- Figure 35: Australia and New Zealand Ridesharing Market Revenue Share (%), by Service Type 2024 & 2032
- Figure 36: Australia and New Zealand Ridesharing Market Revenue (Million), by Country 2024 & 2032
- Figure 37: Australia and New Zealand Ridesharing Market Revenue Share (%), by Country 2024 & 2032
- Figure 38: Latin America Ridesharing Market Revenue (Million), by Membership Type 2024 & 2032
- Figure 39: Latin America Ridesharing Market Revenue Share (%), by Membership Type 2024 & 2032
- Figure 40: Latin America Ridesharing Market Revenue (Million), by Service Type 2024 & 2032
- Figure 41: Latin America Ridesharing Market Revenue Share (%), by Service Type 2024 & 2032
- Figure 42: Latin America Ridesharing Market Revenue (Million), by Country 2024 & 2032
- Figure 43: Latin America Ridesharing Market Revenue Share (%), by Country 2024 & 2032
- Figure 44: Middle East and Africa Ridesharing Market Revenue (Million), by Membership Type 2024 & 2032
- Figure 45: Middle East and Africa Ridesharing Market Revenue Share (%), by Membership Type 2024 & 2032
- Figure 46: Middle East and Africa Ridesharing Market Revenue (Million), by Service Type 2024 & 2032
- Figure 47: Middle East and Africa Ridesharing Market Revenue Share (%), by Service Type 2024 & 2032
- Figure 48: Middle East and Africa Ridesharing Market Revenue (Million), by Country 2024 & 2032
- Figure 49: Middle East and Africa Ridesharing Market Revenue Share (%), by Country 2024 & 2032
List of Tables
- Table 1: Global Ridesharing Market Revenue Million Forecast, by Region 2019 & 2032
- Table 2: Global Ridesharing Market Revenue Million Forecast, by Membership Type 2019 & 2032
- Table 3: Global Ridesharing Market Revenue Million Forecast, by Service Type 2019 & 2032
- Table 4: Global Ridesharing Market Revenue Million Forecast, by Region 2019 & 2032
- Table 5: Global Ridesharing Market Revenue Million Forecast, by Country 2019 & 2032
- Table 6: United States Ridesharing Market Revenue (Million) Forecast, by Application 2019 & 2032
- Table 7: Canada Ridesharing Market Revenue (Million) Forecast, by Application 2019 & 2032
- Table 8: Mexico Ridesharing Market Revenue (Million) Forecast, by Application 2019 & 2032
- Table 9: Global Ridesharing Market Revenue Million Forecast, by Country 2019 & 2032
- Table 10: Germany Ridesharing Market Revenue (Million) Forecast, by Application 2019 & 2032
- Table 11: United Kingdom Ridesharing Market Revenue (Million) Forecast, by Application 2019 & 2032
- Table 12: France Ridesharing Market Revenue (Million) Forecast, by Application 2019 & 2032
- Table 13: Spain Ridesharing Market Revenue (Million) Forecast, by Application 2019 & 2032
- Table 14: Italy Ridesharing Market Revenue (Million) Forecast, by Application 2019 & 2032
- Table 15: Spain Ridesharing Market Revenue (Million) Forecast, by Application 2019 & 2032
- Table 16: Belgium Ridesharing Market Revenue (Million) Forecast, by Application 2019 & 2032
- Table 17: Netherland Ridesharing Market Revenue (Million) Forecast, by Application 2019 & 2032
- Table 18: Nordics Ridesharing Market Revenue (Million) Forecast, by Application 2019 & 2032
- Table 19: Rest of Europe Ridesharing Market Revenue (Million) Forecast, by Application 2019 & 2032
- Table 20: Global Ridesharing Market Revenue Million Forecast, by Country 2019 & 2032
- Table 21: China Ridesharing Market Revenue (Million) Forecast, by Application 2019 & 2032
- Table 22: Japan Ridesharing Market Revenue (Million) Forecast, by Application 2019 & 2032
- Table 23: India Ridesharing Market Revenue (Million) Forecast, by Application 2019 & 2032
- Table 24: South Korea Ridesharing Market Revenue (Million) Forecast, by Application 2019 & 2032
- Table 25: Southeast Asia Ridesharing Market Revenue (Million) Forecast, by Application 2019 & 2032
- Table 26: Australia Ridesharing Market Revenue (Million) Forecast, by Application 2019 & 2032
- Table 27: Indonesia Ridesharing Market Revenue (Million) Forecast, by Application 2019 & 2032
- Table 28: Phillipes Ridesharing Market Revenue (Million) Forecast, by Application 2019 & 2032
- Table 29: Singapore Ridesharing Market Revenue (Million) Forecast, by Application 2019 & 2032
- Table 30: Thailandc Ridesharing Market Revenue (Million) Forecast, by Application 2019 & 2032
- Table 31: Rest of Asia Pacific Ridesharing Market Revenue (Million) Forecast, by Application 2019 & 2032
- Table 32: Global Ridesharing Market Revenue Million Forecast, by Country 2019 & 2032
- Table 33: Brazil Ridesharing Market Revenue (Million) Forecast, by Application 2019 & 2032
- Table 34: Argentina Ridesharing Market Revenue (Million) Forecast, by Application 2019 & 2032
- Table 35: Peru Ridesharing Market Revenue (Million) Forecast, by Application 2019 & 2032
- Table 36: Chile Ridesharing Market Revenue (Million) Forecast, by Application 2019 & 2032
- Table 37: Colombia Ridesharing Market Revenue (Million) Forecast, by Application 2019 & 2032
- Table 38: Ecuador Ridesharing Market Revenue (Million) Forecast, by Application 2019 & 2032
- Table 39: Venezuela Ridesharing Market Revenue (Million) Forecast, by Application 2019 & 2032
- Table 40: Rest of South America Ridesharing Market Revenue (Million) Forecast, by Application 2019 & 2032
- Table 41: Global Ridesharing Market Revenue Million Forecast, by Country 2019 & 2032
- Table 42: United States Ridesharing Market Revenue (Million) Forecast, by Application 2019 & 2032
- Table 43: Canada Ridesharing Market Revenue (Million) Forecast, by Application 2019 & 2032
- Table 44: Mexico Ridesharing Market Revenue (Million) Forecast, by Application 2019 & 2032
- Table 45: Global Ridesharing Market Revenue Million Forecast, by Country 2019 & 2032
- Table 46: United Arab Emirates Ridesharing Market Revenue (Million) Forecast, by Application 2019 & 2032
- Table 47: Saudi Arabia Ridesharing Market Revenue (Million) Forecast, by Application 2019 & 2032
- Table 48: South Africa Ridesharing Market Revenue (Million) Forecast, by Application 2019 & 2032
- Table 49: Rest of Middle East and Africa Ridesharing Market Revenue (Million) Forecast, by Application 2019 & 2032
- Table 50: Global Ridesharing Market Revenue Million Forecast, by Membership Type 2019 & 2032
- Table 51: Global Ridesharing Market Revenue Million Forecast, by Service Type 2019 & 2032
- Table 52: Global Ridesharing Market Revenue Million Forecast, by Country 2019 & 2032
- Table 53: Global Ridesharing Market Revenue Million Forecast, by Membership Type 2019 & 2032
- Table 54: Global Ridesharing Market Revenue Million Forecast, by Service Type 2019 & 2032
- Table 55: Global Ridesharing Market Revenue Million Forecast, by Country 2019 & 2032
- Table 56: Global Ridesharing Market Revenue Million Forecast, by Membership Type 2019 & 2032
- Table 57: Global Ridesharing Market Revenue Million Forecast, by Service Type 2019 & 2032
- Table 58: Global Ridesharing Market Revenue Million Forecast, by Country 2019 & 2032
- Table 59: Global Ridesharing Market Revenue Million Forecast, by Membership Type 2019 & 2032
- Table 60: Global Ridesharing Market Revenue Million Forecast, by Service Type 2019 & 2032
- Table 61: Global Ridesharing Market Revenue Million Forecast, by Country 2019 & 2032
- Table 62: Global Ridesharing Market Revenue Million Forecast, by Membership Type 2019 & 2032
- Table 63: Global Ridesharing Market Revenue Million Forecast, by Service Type 2019 & 2032
- Table 64: Global Ridesharing Market Revenue Million Forecast, by Country 2019 & 2032
- Table 65: Global Ridesharing Market Revenue Million Forecast, by Membership Type 2019 & 2032
- Table 66: Global Ridesharing Market Revenue Million Forecast, by Service Type 2019 & 2032
- Table 67: Global Ridesharing Market Revenue Million Forecast, by Country 2019 & 2032
Frequently Asked Questions
1. What is the projected Compound Annual Growth Rate (CAGR) of the Ridesharing Market?
The projected CAGR is approximately 12.81%.
2. Which companies are prominent players in the Ridesharing Market?
Key companies in the market include Flinc GmbH (Daimler Mobility Services), BlaBlaCar (Comuto SA), SPLT (Bosch), Didi Chuxing Technology Co, HyreCar Inc, KINTO Join Limited, Wunder Mobility Solutions GmbH, Kangaride Canada Co, GoMore, Klaxit SAS (formerly Wayzup), Scoop Technologies Inc, Vride Inc (Acquired by Enterprise Holdings Inc, CarpoolWorld (Datasphere Corporation), Via Transportation Inc, Zimride Inc.
3. What are the main segments of the Ridesharing Market?
The market segments include Membership Type, Service Type.
4. Can you provide details about the market size?
The market size is estimated to be USD 47.62 Million as of 2022.
5. What are some drivers contributing to market growth?
Cost Advantage and Increasing Availability of Carpooling/Corporate Pooling Services; Incentives and Rebates Provided by Governments in Major Markets. such as France; Increasing Cost of Vehicle Ownership and Environmental Benefits.
6. What are the notable trends driving market growth?
COVID-19 Has Posed Significant Threat to the Market.
7. Are there any restraints impacting market growth?
Technical Challenges Pertaining to CMP Technique.
8. Can you provide examples of recent developments in the market?
June 2022 - Uber has launched a new UberX Share service to share rides, which is remarkably similar to Uber's pre-pandemic carpooling feature, but with a monetary incentive. Riders who choose UberX Share will be paired with another co-rider traveling in the same direction. Uber will give riders a 20% reduction on the overall fee in exchange for the inconvenience and extra time spent on the road. Even if riders are not matched with a co-rider, they will receive an up-front discount on their ride.
9. What pricing options are available for accessing the report?
Pricing options include single-user, multi-user, and enterprise licenses priced at USD 4750, USD 5250, and USD 8750 respectively.
10. Is the market size provided in terms of value or volume?
The market size is provided in terms of value, measured in Million.
11. Are there any specific market keywords associated with the report?
Yes, the market keyword associated with the report is "Ridesharing Market," which aids in identifying and referencing the specific market segment covered.
12. How do I determine which pricing option suits my needs best?
The pricing options vary based on user requirements and access needs. Individual users may opt for single-user licenses, while businesses requiring broader access may choose multi-user or enterprise licenses for cost-effective access to the report.
13. Are there any additional resources or data provided in the Ridesharing Market report?
While the report offers comprehensive insights, it's advisable to review the specific contents or supplementary materials provided to ascertain if additional resources or data are available.
14. How can I stay updated on further developments or reports in the Ridesharing Market?
To stay informed about further developments, trends, and reports in the Ridesharing Market, consider subscribing to industry newsletters, following relevant companies and organizations, or regularly checking reputable industry news sources and publications.
Methodology
Step 1 - Identification of Relevant Samples Size from Population Database


Step 2 - Approaches for Defining Global Market Size (Value, Volume* & Price*)

Note*: In applicable scenarios
Step 3 - Data Sources
Primary Research
- Web Analytics
- Survey Reports
- Research Institute
- Latest Research Reports
- Opinion Leaders
Secondary Research
- Annual Reports
- White Paper
- Latest Press Release
- Industry Association
- Paid Database
- Investor Presentations

Step 4 - Data Triangulation
Involves using different sources of information in order to increase the validity of a study
These sources are likely to be stakeholders in a program - participants, other researchers, program staff, other community members, and so on.
Then we put all data in single framework & apply various statistical tools to find out the dynamic on the market.
During the analysis stage, feedback from the stakeholder groups would be compared to determine areas of agreement as well as areas of divergence
