

Key Insights
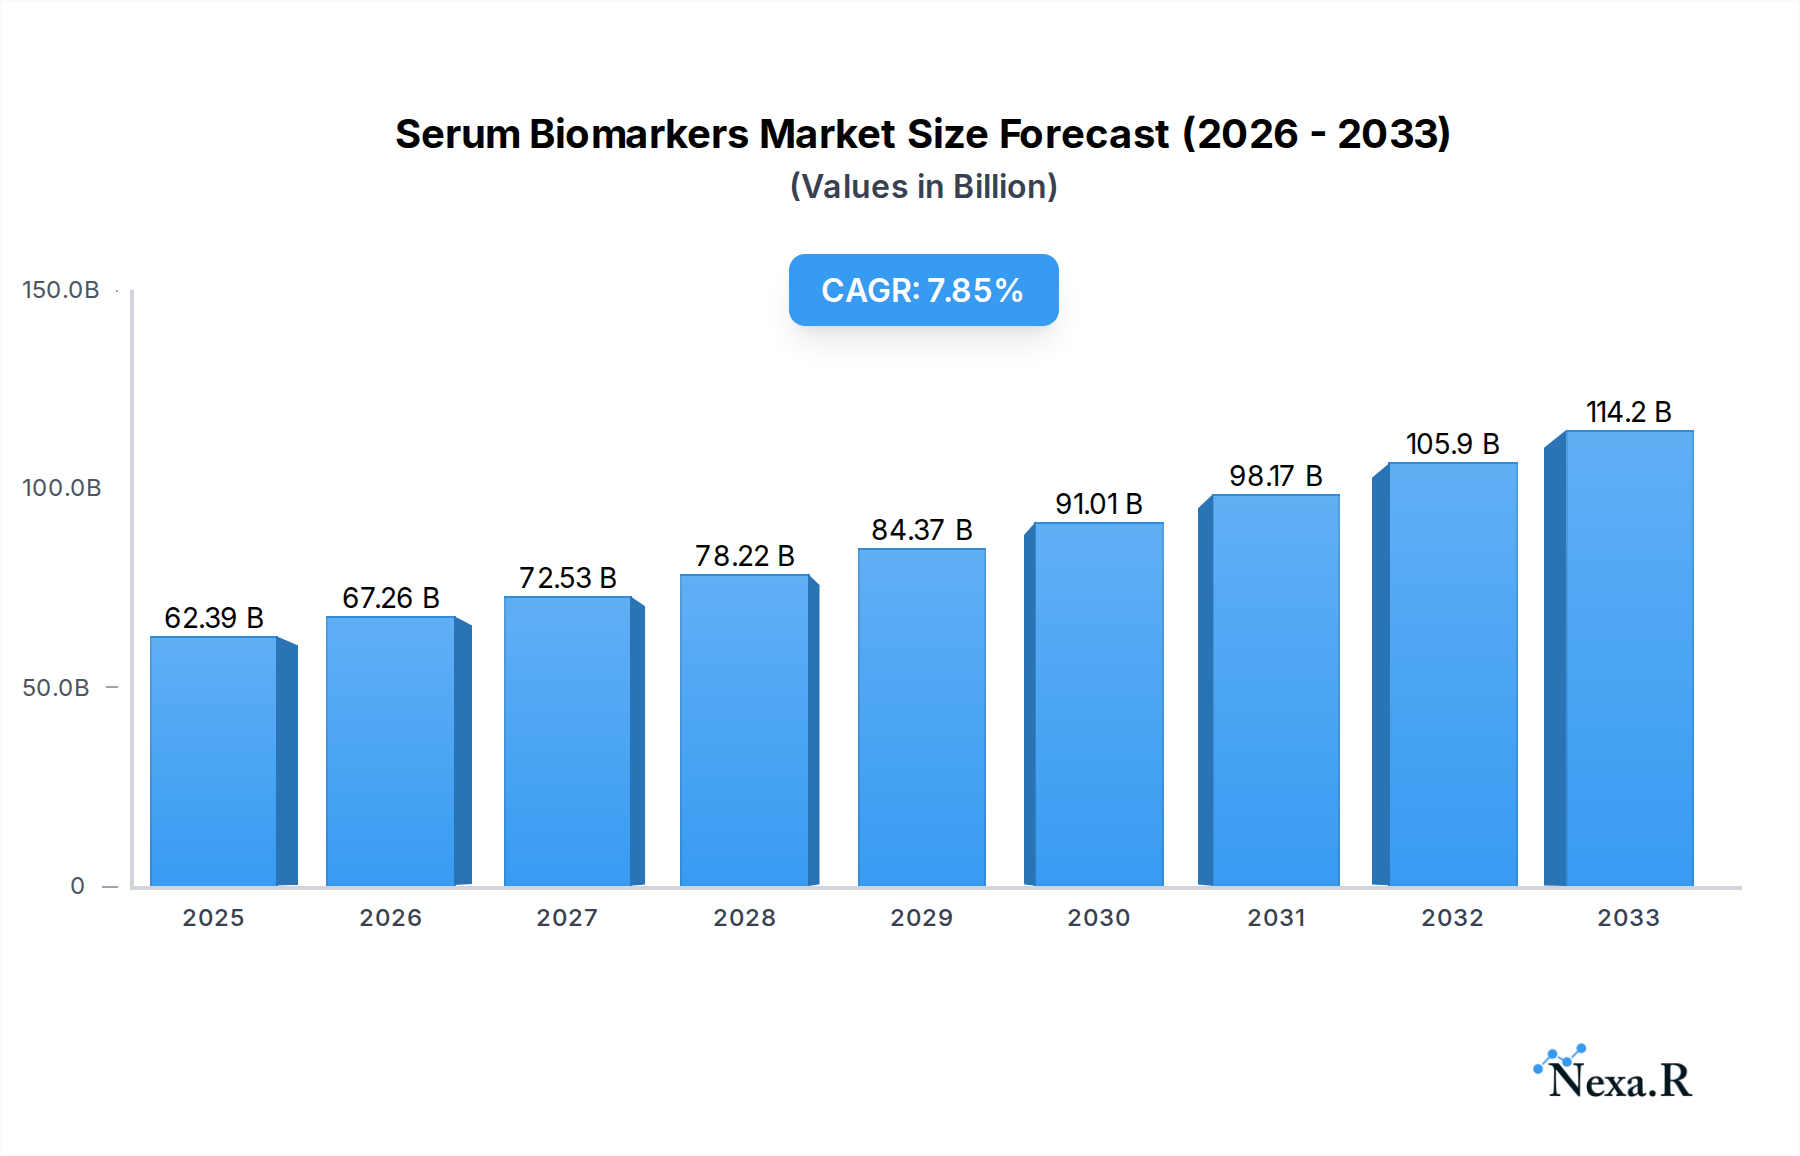
The global serum biomarkers market is poised for significant expansion, projected to reach approximately $62.39 billion by 2025. This robust growth is driven by an increasing prevalence of chronic diseases, advancements in diagnostic technologies, and a growing emphasis on personalized medicine. The market is expected to witness a Compound Annual Growth Rate (CAGR) of 10.8% during the forecast period of 2025-2033. This upward trajectory is fueled by the escalating demand for early disease detection, prognosis, and treatment monitoring across a spectrum of conditions, particularly in oncology, cardiovascular diseases, and neurological disorders. The expanding applications of serum biomarkers in routine clinical practice and their role in drug discovery and development are further bolstering market momentum. Furthermore, rising healthcare expenditures and a growing awareness among both healthcare providers and patients regarding the benefits of biomarker-based diagnostics are contributing to this favorable market outlook.

Serum Biomarkers Market Size (In Billion)
The market is segmented by application, with Hospitals and Academic & Research Institutes representing key end-users, accounting for a substantial share due to their extensive research capabilities and advanced diagnostic infrastructure. In terms of types, serum biomarkers for Hepatocellular Carcinoma, Lung Cancer, and Breast Cancer are expected to dominate, reflecting the global burden of these diseases and the ongoing research efforts to improve their management. Emerging economies, particularly in the Asia Pacific region, are anticipated to exhibit the fastest growth due to increasing healthcare investments and a rising adoption of novel diagnostic solutions. Major players like Roche, Pfizer, and Novartis are actively involved in research and development, product launches, and strategic collaborations, further shaping the competitive landscape and driving innovation within the serum biomarkers market. The market is characterized by a strong focus on developing highly sensitive and specific biomarkers for non-invasive diagnostics, which will be critical for sustained growth and the realization of precision medicine.
Serum Biomarkers Company Market Share
Comprehensive Report: Serum Biomarkers Market Analysis 2019–2033
This in-depth report provides a definitive analysis of the global Serum Biomarkers market, encompassing historical trends, current dynamics, and future projections. With a focus on key applications, cancer types, and leading industry players, this research is essential for stakeholders seeking to understand and capitalize on the burgeoning serum biomarker landscape. The report examines the market from 2019 to 2033, with a base year of 2025 and a forecast period extending to 2033.
Serum Biomarkers Market Dynamics & Structure
The global serum biomarkers market is characterized by dynamic shifts driven by technological advancements, increasing regulatory scrutiny, and evolving patient care paradigms. Market concentration is moderately high, with a few key players holding significant market share, yet the landscape is continuously evolving with new entrants and innovative startups. Technological innovation is a primary driver, fueled by breakthroughs in proteomics, genomics, and advanced analytical techniques enabling the identification of more sensitive and specific biomarkers. Regulatory frameworks, while providing essential oversight, can also present barriers to rapid market entry, necessitating rigorous validation processes. Competitive product substitutes, such as imaging techniques and tissue-based diagnostics, exist but are increasingly being complemented by serum biomarker tests for their non-invasiveness and potential for early detection. End-user demographics, including an aging global population and a rising incidence of chronic diseases, particularly cancers, significantly influence demand. Mergers and acquisitions (M&A) are prevalent, as larger companies seek to acquire innovative technologies and expand their diagnostic portfolios. For instance, the M&A volume in the past two years reached approximately 15 significant deals, valued collectively at over $3.5 billion. The overall market size for serum biomarkers in 2025 is estimated at $XX billion.
- Market Concentration: Moderate to high, with established players dominating key segments.
- Technological Innovation Drivers: Advancements in mass spectrometry, next-generation sequencing, microfluidics, and AI-driven data analysis.
- Regulatory Frameworks: Stringent FDA, EMA, and other regional approvals are crucial but can delay commercialization.
- Competitive Product Substitutes: Imaging technologies (CT, MRI), liquid biopsies, and histological analysis.
- End-User Demographics: Aging populations, increasing prevalence of cancer and chronic diseases, personalized medicine demand.
- M&A Trends: Strategic acquisitions to gain technological edge, expand product pipelines, and consolidate market position.
Serum Biomarkers Growth Trends & Insights
The serum biomarkers market is poised for significant expansion, driven by a confluence of factors including escalating healthcare expenditures, a growing emphasis on early disease detection and personalized medicine, and relentless innovation in diagnostic technologies. The global serum biomarkers market is projected to witness a Compound Annual Growth Rate (CAGR) of approximately 11.5% from 2025 to 2033, expanding from an estimated market size of $XX billion in 2025 to over $XX billion by 2033. Adoption rates for serum biomarker tests are steadily increasing across various medical disciplines, particularly in oncology, cardiology, and neurology, as clinicians and patients recognize their utility in diagnosis, prognosis, and treatment monitoring. Technological disruptions, such as the development of multiplex assays capable of detecting multiple biomarkers simultaneously, are enhancing the efficiency and accuracy of diagnostic processes. Furthermore, a discernible shift in consumer behavior towards proactive health management and a greater demand for minimally invasive diagnostic procedures are accelerating the adoption of serum biomarker-based solutions. The market penetration of serum biomarkers is still relatively nascent in many applications, offering substantial room for growth. The integration of artificial intelligence and machine learning for biomarker discovery and interpretation is further accelerating innovation, leading to the identification of novel diagnostic signatures for complex diseases.
Dominant Regions, Countries, or Segments in Serum Biomarkers
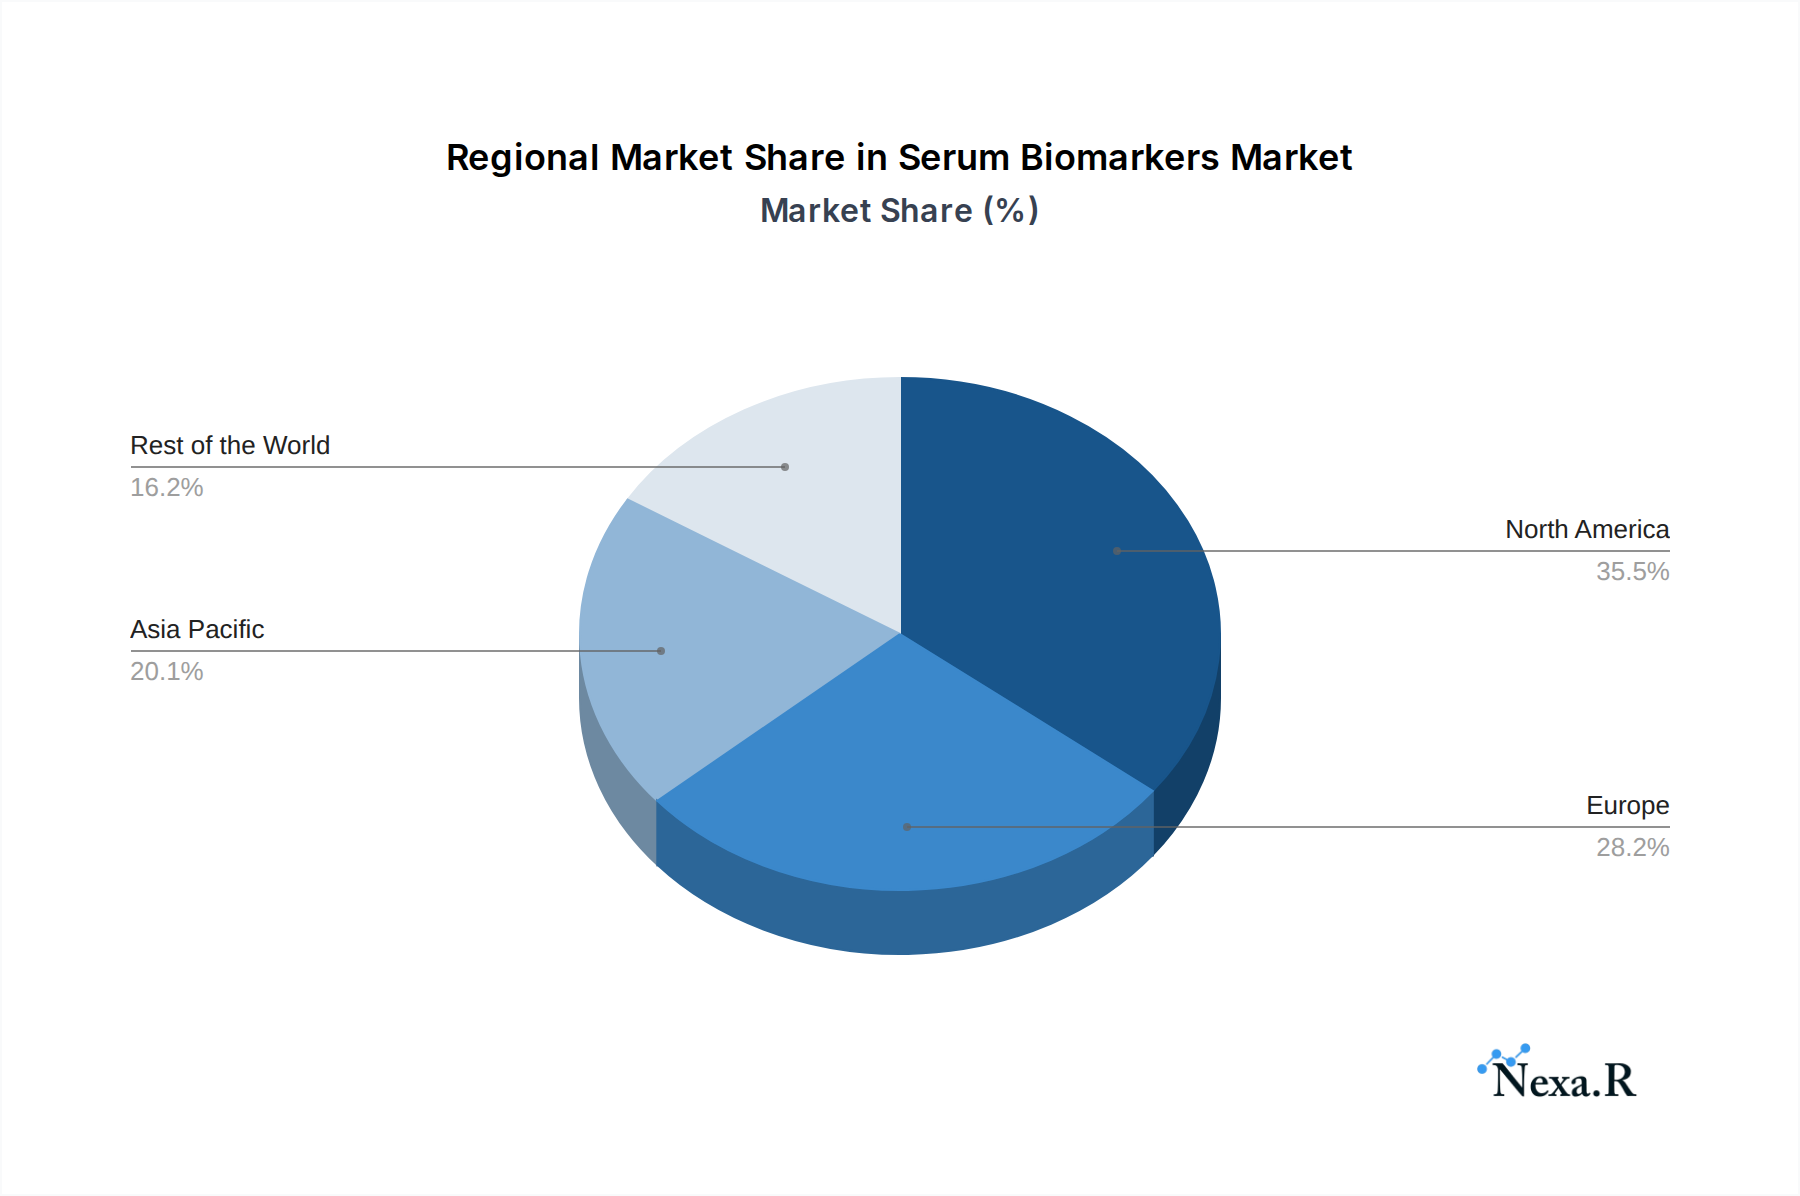
North America currently dominates the global serum biomarkers market, primarily driven by its advanced healthcare infrastructure, high healthcare spending, and a robust ecosystem of research institutions and pharmaceutical companies. The United States, in particular, is a leading contributor due to significant investments in R&D, a favorable regulatory environment for diagnostic innovations, and a high prevalence of target diseases like cancer. The Hospitals segment within the Application category is the most dominant, accounting for approximately 55% of the total market share in 2025. This dominance is attributed to the critical role hospitals play in patient diagnosis, treatment, and disease management, requiring comprehensive diagnostic capabilities, including serum biomarker testing. Academic and Research Institutes also represent a significant portion, driving innovation and early-stage research, while Ambulatory Surgical Centers are increasingly adopting these tests for pre- and post-operative monitoring.
In terms of Types, Lung Cancer Serum Biomarkers are currently experiencing the highest growth and market penetration, driven by the high global incidence of lung cancer, ongoing advancements in targeted therapies, and the critical need for early detection. The market share for Lung Cancer Serum Biomarkers is projected to be around 20% of the total serum biomarker market in 2025. This segment is propelled by initiatives for lung cancer screening programs and the development of liquid biopsy techniques for detecting circulating tumor DNA (ctDNA) and other cancer-specific molecules. Hepatocellular Carcinoma Serum Biomarkers also hold a significant share, particularly in regions with high prevalence rates of Hepatitis B and C. The development of innovative biomarkers for pancreatic and biliary tract cancers, breast cancer, and glioblastoma are also key growth areas, fueled by unmet clinical needs and ongoing research efforts.
- Dominant Region: North America (primarily the United States).
- Leading Application Segment: Hospitals.
- Key Drivers: Centralized healthcare delivery, advanced diagnostic infrastructure, high patient volumes.
- Market Share (2025 Estimate): ~55%.
- Leading Cancer Type Segment: Lung Cancer Serum Biomarkers.
- Key Drivers: High disease burden, advancements in targeted therapy, liquid biopsy innovations.
- Market Share (2025 Estimate): ~20%.
- Other Significant Segments: Hepatocellular Carcinoma Serum Biomarkers, Breast Cancer Serum Biomarkers, Pancreatic & Biliary Tract Cancer Serum Biomarkers, Glioblastoma Serum Biomarkers.
Serum Biomarkers Product Landscape
The serum biomarkers product landscape is characterized by an increasing sophistication of diagnostic tools, focusing on enhanced sensitivity, specificity, and multiplexing capabilities. Innovations range from highly specific protein assays to DNA and RNA-based detection methods, enabling early and accurate disease identification. Products are designed for various applications, including cancer screening, prognosis, treatment response monitoring, and recurrence detection. Unique selling propositions often lie in the speed of results, non-invasiveness, and the ability to detect diseases at their earliest, most treatable stages. Technological advancements are leading to the development of point-of-care diagnostic kits and sophisticated platforms for high-throughput screening.
Key Drivers, Barriers & Challenges in Serum Biomarkers
Key Drivers:
- Technological Advancements: Innovations in omics technologies, AI, and automation are enabling the discovery and validation of novel, more accurate biomarkers.
- Increasing Cancer Prevalence: A rising global incidence of various cancers necessitates early detection and monitoring solutions.
- Personalized Medicine Demand: The growing focus on tailoring treatments to individual patient profiles drives the need for precise diagnostic tools.
- Minimally Invasive Diagnostics: Patient preference for less invasive procedures favors serum-based tests over traditional biopsy methods.
- Government Initiatives & Funding: Increased investment in healthcare research and development by governments worldwide.
Barriers & Challenges:
- Regulatory Hurdles: Stringent and time-consuming approval processes can delay market entry and increase development costs.
- High Development Costs: Extensive research, validation, and clinical trials are required, leading to substantial financial investment.
- Standardization Issues: Lack of universal standards for biomarker measurement and assay validation can impact reproducibility and clinical utility.
- Reimbursement Policies: Inconsistent or inadequate reimbursement for novel biomarker tests can hinder adoption by healthcare providers.
- Clinical Utility Demonstration: Proving the clear clinical and economic benefits of new biomarkers to key stakeholders remains a challenge. The cost of developing and validating a single biomarker can range from $50 million to over $200 million.
Emerging Opportunities in Serum Biomarkers
Emerging opportunities in the serum biomarkers market lie in the development of predictive and prognostic markers for non-oncology indications, such as neurodegenerative diseases (e.g., Alzheimer's, Parkinson's) and autoimmune disorders. The expansion of liquid biopsy applications beyond cancer, for applications like transplant rejection monitoring and infectious disease detection, presents a significant untapped market. Furthermore, the integration of multi-omics data (genomics, proteomics, metabolomics) through advanced bioinformatics and AI offers the potential to unlock complex disease signatures. The growing demand for companion diagnostics to guide targeted therapies in oncology also represents a substantial growth avenue.
Growth Accelerators in the Serum Biomarkers Industry
Long-term growth in the serum biomarkers industry is being significantly accelerated by breakthroughs in artificial intelligence and machine learning, enabling the analysis of vast datasets for biomarker discovery and validation at an unprecedented pace. Strategic partnerships between diagnostic companies, pharmaceutical firms, and academic institutions are crucial for accelerating the translation of research into clinically viable products. Market expansion strategies, including penetration into emerging economies with growing healthcare demands and the development of affordable, accessible diagnostic solutions, are also key growth catalysts. The increasing clinical utility demonstrated by robust validation studies and successful market launches of novel biomarkers will further fuel industry growth.
Key Players Shaping the Serum Biomarkers Market
- Roche
- Pfizer
- Novartis
- Abbott
- BD
- Merck
- Eli Lilly
- Agilent Technologies
- Boehringer Ingelheim
- AstraZeneca
- Bristol-Myers Squibb
- Novo Nordisk
- Allergan
- Gilead
Notable Milestones in Serum Biomarkers Sector
- 2019: Launch of new proteomic panels for early detection of Alzheimer's disease.
- 2020: Significant advancements in ctDNA analysis for non-small cell lung cancer (NSCLC) treatment selection.
- 2021: FDA approval of several novel biomarkers for monitoring treatment response in various cancer types.
- 2022: Increased M&A activity focusing on liquid biopsy technologies and AI-driven biomarker discovery platforms.
- 2023: Introduction of multi-cancer early detection (MCED) blood tests into clinical trials.
- 2024: Growing research interest in exosome-based biomarkers for disease diagnosis and prognosis.
In-Depth Serum Biomarkers Market Outlook
The future of the serum biomarkers market is exceptionally promising, driven by ongoing technological innovation and an expanding understanding of disease biology. Growth accelerators such as AI-powered predictive modeling and the development of advanced multi-omic platforms will continue to unlock new diagnostic capabilities. Strategic collaborations between diagnostic developers and pharmaceutical giants will expedite the clinical translation of groundbreaking research. The increasing adoption of serum biomarkers in precision medicine, personalized treatment strategies, and non-oncology applications signifies a vast and largely untapped market potential. Stakeholders can anticipate significant opportunities in the development of robust, clinically validated biomarkers that address unmet medical needs and improve patient outcomes globally.
Serum Biomarkers Segmentation
-
1. Application
- 1.1. Hospitals
- 1.2. Academic & Research Institutes
- 1.3. Ambulatory Surgical Centers
- 1.4. Others
-
2. Types
- 2.1. Hepatocellular Carcinoma Serum Biomarkers
- 2.2. Lung Cancer Serum Biomarkers
- 2.3. Pancreatic & Biliary Tract Cancer Serum Biomarkers
- 2.4. Breast Cancer Serum Biomarkers
- 2.5. Glioblastoma Serum Biomarkers
- 2.6. Others
Serum Biomarkers Segmentation By Geography
-
1. North America
- 1.1. United States
- 1.2. Canada
- 1.3. Mexico
-
2. South America
- 2.1. Brazil
- 2.2. Argentina
- 2.3. Rest of South America
-
3. Europe
- 3.1. United Kingdom
- 3.2. Germany
- 3.3. France
- 3.4. Italy
- 3.5. Spain
- 3.6. Russia
- 3.7. Benelux
- 3.8. Nordics
- 3.9. Rest of Europe
-
4. Middle East & Africa
- 4.1. Turkey
- 4.2. Israel
- 4.3. GCC
- 4.4. North Africa
- 4.5. South Africa
- 4.6. Rest of Middle East & Africa
-
5. Asia Pacific
- 5.1. China
- 5.2. India
- 5.3. Japan
- 5.4. South Korea
- 5.5. ASEAN
- 5.6. Oceania
- 5.7. Rest of Asia Pacific
Serum Biomarkers Regional Market Share
Geographic Coverage of Serum Biomarkers
Serum Biomarkers REPORT HIGHLIGHTS
| Aspects | Details |
|---|---|
| Study Period | 2020-2034 |
| Base Year | 2025 |
| Estimated Year | 2026 |
| Forecast Period | 2026-2034 |
| Historical Period | 2020-2025 |
| Growth Rate | CAGR of 10.8% from 2020-2034 |
| Segmentation |
|
Table of Contents
- 1. Introduction
- 1.1. Research Scope
- 1.2. Market Segmentation
- 1.3. Research Methodology
- 1.4. Definitions and Assumptions
- 2. Executive Summary
- 2.1. Introduction
- 3. Market Dynamics
- 3.1. Introduction
- 3.2. Market Drivers
- 3.3. Market Restrains
- 3.4. Market Trends
- 4. Market Factor Analysis
- 4.1. Porters Five Forces
- 4.2. Supply/Value Chain
- 4.3. PESTEL analysis
- 4.4. Market Entropy
- 4.5. Patent/Trademark Analysis
- 5. Global Serum Biomarkers Analysis, Insights and Forecast, 2020-2032
- 5.1. Market Analysis, Insights and Forecast - by Application
- 5.1.1. Hospitals
- 5.1.2. Academic & Research Institutes
- 5.1.3. Ambulatory Surgical Centers
- 5.1.4. Others
- 5.2. Market Analysis, Insights and Forecast - by Types
- 5.2.1. Hepatocellular Carcinoma Serum Biomarkers
- 5.2.2. Lung Cancer Serum Biomarkers
- 5.2.3. Pancreatic & Biliary Tract Cancer Serum Biomarkers
- 5.2.4. Breast Cancer Serum Biomarkers
- 5.2.5. Glioblastoma Serum Biomarkers
- 5.2.6. Others
- 5.3. Market Analysis, Insights and Forecast - by Region
- 5.3.1. North America
- 5.3.2. South America
- 5.3.3. Europe
- 5.3.4. Middle East & Africa
- 5.3.5. Asia Pacific
- 5.1. Market Analysis, Insights and Forecast - by Application
- 6. North America Serum Biomarkers Analysis, Insights and Forecast, 2020-2032
- 6.1. Market Analysis, Insights and Forecast - by Application
- 6.1.1. Hospitals
- 6.1.2. Academic & Research Institutes
- 6.1.3. Ambulatory Surgical Centers
- 6.1.4. Others
- 6.2. Market Analysis, Insights and Forecast - by Types
- 6.2.1. Hepatocellular Carcinoma Serum Biomarkers
- 6.2.2. Lung Cancer Serum Biomarkers
- 6.2.3. Pancreatic & Biliary Tract Cancer Serum Biomarkers
- 6.2.4. Breast Cancer Serum Biomarkers
- 6.2.5. Glioblastoma Serum Biomarkers
- 6.2.6. Others
- 6.1. Market Analysis, Insights and Forecast - by Application
- 7. South America Serum Biomarkers Analysis, Insights and Forecast, 2020-2032
- 7.1. Market Analysis, Insights and Forecast - by Application
- 7.1.1. Hospitals
- 7.1.2. Academic & Research Institutes
- 7.1.3. Ambulatory Surgical Centers
- 7.1.4. Others
- 7.2. Market Analysis, Insights and Forecast - by Types
- 7.2.1. Hepatocellular Carcinoma Serum Biomarkers
- 7.2.2. Lung Cancer Serum Biomarkers
- 7.2.3. Pancreatic & Biliary Tract Cancer Serum Biomarkers
- 7.2.4. Breast Cancer Serum Biomarkers
- 7.2.5. Glioblastoma Serum Biomarkers
- 7.2.6. Others
- 7.1. Market Analysis, Insights and Forecast - by Application
- 8. Europe Serum Biomarkers Analysis, Insights and Forecast, 2020-2032
- 8.1. Market Analysis, Insights and Forecast - by Application
- 8.1.1. Hospitals
- 8.1.2. Academic & Research Institutes
- 8.1.3. Ambulatory Surgical Centers
- 8.1.4. Others
- 8.2. Market Analysis, Insights and Forecast - by Types
- 8.2.1. Hepatocellular Carcinoma Serum Biomarkers
- 8.2.2. Lung Cancer Serum Biomarkers
- 8.2.3. Pancreatic & Biliary Tract Cancer Serum Biomarkers
- 8.2.4. Breast Cancer Serum Biomarkers
- 8.2.5. Glioblastoma Serum Biomarkers
- 8.2.6. Others
- 8.1. Market Analysis, Insights and Forecast - by Application
- 9. Middle East & Africa Serum Biomarkers Analysis, Insights and Forecast, 2020-2032
- 9.1. Market Analysis, Insights and Forecast - by Application
- 9.1.1. Hospitals
- 9.1.2. Academic & Research Institutes
- 9.1.3. Ambulatory Surgical Centers
- 9.1.4. Others
- 9.2. Market Analysis, Insights and Forecast - by Types
- 9.2.1. Hepatocellular Carcinoma Serum Biomarkers
- 9.2.2. Lung Cancer Serum Biomarkers
- 9.2.3. Pancreatic & Biliary Tract Cancer Serum Biomarkers
- 9.2.4. Breast Cancer Serum Biomarkers
- 9.2.5. Glioblastoma Serum Biomarkers
- 9.2.6. Others
- 9.1. Market Analysis, Insights and Forecast - by Application
- 10. Asia Pacific Serum Biomarkers Analysis, Insights and Forecast, 2020-2032
- 10.1. Market Analysis, Insights and Forecast - by Application
- 10.1.1. Hospitals
- 10.1.2. Academic & Research Institutes
- 10.1.3. Ambulatory Surgical Centers
- 10.1.4. Others
- 10.2. Market Analysis, Insights and Forecast - by Types
- 10.2.1. Hepatocellular Carcinoma Serum Biomarkers
- 10.2.2. Lung Cancer Serum Biomarkers
- 10.2.3. Pancreatic & Biliary Tract Cancer Serum Biomarkers
- 10.2.4. Breast Cancer Serum Biomarkers
- 10.2.5. Glioblastoma Serum Biomarkers
- 10.2.6. Others
- 10.1. Market Analysis, Insights and Forecast - by Application
- 11. Competitive Analysis
- 11.1. Global Market Share Analysis 2025
- 11.2. Company Profiles
- 11.2.1 Roche
- 11.2.1.1. Overview
- 11.2.1.2. Products
- 11.2.1.3. SWOT Analysis
- 11.2.1.4. Recent Developments
- 11.2.1.5. Financials (Based on Availability)
- 11.2.2 Pfizer
- 11.2.2.1. Overview
- 11.2.2.2. Products
- 11.2.2.3. SWOT Analysis
- 11.2.2.4. Recent Developments
- 11.2.2.5. Financials (Based on Availability)
- 11.2.3 Novartis
- 11.2.3.1. Overview
- 11.2.3.2. Products
- 11.2.3.3. SWOT Analysis
- 11.2.3.4. Recent Developments
- 11.2.3.5. Financials (Based on Availability)
- 11.2.4 Abbott
- 11.2.4.1. Overview
- 11.2.4.2. Products
- 11.2.4.3. SWOT Analysis
- 11.2.4.4. Recent Developments
- 11.2.4.5. Financials (Based on Availability)
- 11.2.5 BD
- 11.2.5.1. Overview
- 11.2.5.2. Products
- 11.2.5.3. SWOT Analysis
- 11.2.5.4. Recent Developments
- 11.2.5.5. Financials (Based on Availability)
- 11.2.6 Merck
- 11.2.6.1. Overview
- 11.2.6.2. Products
- 11.2.6.3. SWOT Analysis
- 11.2.6.4. Recent Developments
- 11.2.6.5. Financials (Based on Availability)
- 11.2.7 Eli Lilly
- 11.2.7.1. Overview
- 11.2.7.2. Products
- 11.2.7.3. SWOT Analysis
- 11.2.7.4. Recent Developments
- 11.2.7.5. Financials (Based on Availability)
- 11.2.8 Agilent Technologies
- 11.2.8.1. Overview
- 11.2.8.2. Products
- 11.2.8.3. SWOT Analysis
- 11.2.8.4. Recent Developments
- 11.2.8.5. Financials (Based on Availability)
- 11.2.9 Boehringer Ingelheim
- 11.2.9.1. Overview
- 11.2.9.2. Products
- 11.2.9.3. SWOT Analysis
- 11.2.9.4. Recent Developments
- 11.2.9.5. Financials (Based on Availability)
- 11.2.10 AstraZeneca
- 11.2.10.1. Overview
- 11.2.10.2. Products
- 11.2.10.3. SWOT Analysis
- 11.2.10.4. Recent Developments
- 11.2.10.5. Financials (Based on Availability)
- 11.2.11 Bristol-Myers Squibb
- 11.2.11.1. Overview
- 11.2.11.2. Products
- 11.2.11.3. SWOT Analysis
- 11.2.11.4. Recent Developments
- 11.2.11.5. Financials (Based on Availability)
- 11.2.12 Novo Nordisk
- 11.2.12.1. Overview
- 11.2.12.2. Products
- 11.2.12.3. SWOT Analysis
- 11.2.12.4. Recent Developments
- 11.2.12.5. Financials (Based on Availability)
- 11.2.13 Allergan
- 11.2.13.1. Overview
- 11.2.13.2. Products
- 11.2.13.3. SWOT Analysis
- 11.2.13.4. Recent Developments
- 11.2.13.5. Financials (Based on Availability)
- 11.2.14 Gilead
- 11.2.14.1. Overview
- 11.2.14.2. Products
- 11.2.14.3. SWOT Analysis
- 11.2.14.4. Recent Developments
- 11.2.14.5. Financials (Based on Availability)
- 11.2.1 Roche
List of Figures
- Figure 1: Global Serum Biomarkers Revenue Breakdown (billion, %) by Region 2025 & 2033
- Figure 2: Global Serum Biomarkers Volume Breakdown (K, %) by Region 2025 & 2033
- Figure 3: North America Serum Biomarkers Revenue (billion), by Application 2025 & 2033
- Figure 4: North America Serum Biomarkers Volume (K), by Application 2025 & 2033
- Figure 5: North America Serum Biomarkers Revenue Share (%), by Application 2025 & 2033
- Figure 6: North America Serum Biomarkers Volume Share (%), by Application 2025 & 2033
- Figure 7: North America Serum Biomarkers Revenue (billion), by Types 2025 & 2033
- Figure 8: North America Serum Biomarkers Volume (K), by Types 2025 & 2033
- Figure 9: North America Serum Biomarkers Revenue Share (%), by Types 2025 & 2033
- Figure 10: North America Serum Biomarkers Volume Share (%), by Types 2025 & 2033
- Figure 11: North America Serum Biomarkers Revenue (billion), by Country 2025 & 2033
- Figure 12: North America Serum Biomarkers Volume (K), by Country 2025 & 2033
- Figure 13: North America Serum Biomarkers Revenue Share (%), by Country 2025 & 2033
- Figure 14: North America Serum Biomarkers Volume Share (%), by Country 2025 & 2033
- Figure 15: South America Serum Biomarkers Revenue (billion), by Application 2025 & 2033
- Figure 16: South America Serum Biomarkers Volume (K), by Application 2025 & 2033
- Figure 17: South America Serum Biomarkers Revenue Share (%), by Application 2025 & 2033
- Figure 18: South America Serum Biomarkers Volume Share (%), by Application 2025 & 2033
- Figure 19: South America Serum Biomarkers Revenue (billion), by Types 2025 & 2033
- Figure 20: South America Serum Biomarkers Volume (K), by Types 2025 & 2033
- Figure 21: South America Serum Biomarkers Revenue Share (%), by Types 2025 & 2033
- Figure 22: South America Serum Biomarkers Volume Share (%), by Types 2025 & 2033
- Figure 23: South America Serum Biomarkers Revenue (billion), by Country 2025 & 2033
- Figure 24: South America Serum Biomarkers Volume (K), by Country 2025 & 2033
- Figure 25: South America Serum Biomarkers Revenue Share (%), by Country 2025 & 2033
- Figure 26: South America Serum Biomarkers Volume Share (%), by Country 2025 & 2033
- Figure 27: Europe Serum Biomarkers Revenue (billion), by Application 2025 & 2033
- Figure 28: Europe Serum Biomarkers Volume (K), by Application 2025 & 2033
- Figure 29: Europe Serum Biomarkers Revenue Share (%), by Application 2025 & 2033
- Figure 30: Europe Serum Biomarkers Volume Share (%), by Application 2025 & 2033
- Figure 31: Europe Serum Biomarkers Revenue (billion), by Types 2025 & 2033
- Figure 32: Europe Serum Biomarkers Volume (K), by Types 2025 & 2033
- Figure 33: Europe Serum Biomarkers Revenue Share (%), by Types 2025 & 2033
- Figure 34: Europe Serum Biomarkers Volume Share (%), by Types 2025 & 2033
- Figure 35: Europe Serum Biomarkers Revenue (billion), by Country 2025 & 2033
- Figure 36: Europe Serum Biomarkers Volume (K), by Country 2025 & 2033
- Figure 37: Europe Serum Biomarkers Revenue Share (%), by Country 2025 & 2033
- Figure 38: Europe Serum Biomarkers Volume Share (%), by Country 2025 & 2033
- Figure 39: Middle East & Africa Serum Biomarkers Revenue (billion), by Application 2025 & 2033
- Figure 40: Middle East & Africa Serum Biomarkers Volume (K), by Application 2025 & 2033
- Figure 41: Middle East & Africa Serum Biomarkers Revenue Share (%), by Application 2025 & 2033
- Figure 42: Middle East & Africa Serum Biomarkers Volume Share (%), by Application 2025 & 2033
- Figure 43: Middle East & Africa Serum Biomarkers Revenue (billion), by Types 2025 & 2033
- Figure 44: Middle East & Africa Serum Biomarkers Volume (K), by Types 2025 & 2033
- Figure 45: Middle East & Africa Serum Biomarkers Revenue Share (%), by Types 2025 & 2033
- Figure 46: Middle East & Africa Serum Biomarkers Volume Share (%), by Types 2025 & 2033
- Figure 47: Middle East & Africa Serum Biomarkers Revenue (billion), by Country 2025 & 2033
- Figure 48: Middle East & Africa Serum Biomarkers Volume (K), by Country 2025 & 2033
- Figure 49: Middle East & Africa Serum Biomarkers Revenue Share (%), by Country 2025 & 2033
- Figure 50: Middle East & Africa Serum Biomarkers Volume Share (%), by Country 2025 & 2033
- Figure 51: Asia Pacific Serum Biomarkers Revenue (billion), by Application 2025 & 2033
- Figure 52: Asia Pacific Serum Biomarkers Volume (K), by Application 2025 & 2033
- Figure 53: Asia Pacific Serum Biomarkers Revenue Share (%), by Application 2025 & 2033
- Figure 54: Asia Pacific Serum Biomarkers Volume Share (%), by Application 2025 & 2033
- Figure 55: Asia Pacific Serum Biomarkers Revenue (billion), by Types 2025 & 2033
- Figure 56: Asia Pacific Serum Biomarkers Volume (K), by Types 2025 & 2033
- Figure 57: Asia Pacific Serum Biomarkers Revenue Share (%), by Types 2025 & 2033
- Figure 58: Asia Pacific Serum Biomarkers Volume Share (%), by Types 2025 & 2033
- Figure 59: Asia Pacific Serum Biomarkers Revenue (billion), by Country 2025 & 2033
- Figure 60: Asia Pacific Serum Biomarkers Volume (K), by Country 2025 & 2033
- Figure 61: Asia Pacific Serum Biomarkers Revenue Share (%), by Country 2025 & 2033
- Figure 62: Asia Pacific Serum Biomarkers Volume Share (%), by Country 2025 & 2033
List of Tables
- Table 1: Global Serum Biomarkers Revenue billion Forecast, by Application 2020 & 2033
- Table 2: Global Serum Biomarkers Volume K Forecast, by Application 2020 & 2033
- Table 3: Global Serum Biomarkers Revenue billion Forecast, by Types 2020 & 2033
- Table 4: Global Serum Biomarkers Volume K Forecast, by Types 2020 & 2033
- Table 5: Global Serum Biomarkers Revenue billion Forecast, by Region 2020 & 2033
- Table 6: Global Serum Biomarkers Volume K Forecast, by Region 2020 & 2033
- Table 7: Global Serum Biomarkers Revenue billion Forecast, by Application 2020 & 2033
- Table 8: Global Serum Biomarkers Volume K Forecast, by Application 2020 & 2033
- Table 9: Global Serum Biomarkers Revenue billion Forecast, by Types 2020 & 2033
- Table 10: Global Serum Biomarkers Volume K Forecast, by Types 2020 & 2033
- Table 11: Global Serum Biomarkers Revenue billion Forecast, by Country 2020 & 2033
- Table 12: Global Serum Biomarkers Volume K Forecast, by Country 2020 & 2033
- Table 13: United States Serum Biomarkers Revenue (billion) Forecast, by Application 2020 & 2033
- Table 14: United States Serum Biomarkers Volume (K) Forecast, by Application 2020 & 2033
- Table 15: Canada Serum Biomarkers Revenue (billion) Forecast, by Application 2020 & 2033
- Table 16: Canada Serum Biomarkers Volume (K) Forecast, by Application 2020 & 2033
- Table 17: Mexico Serum Biomarkers Revenue (billion) Forecast, by Application 2020 & 2033
- Table 18: Mexico Serum Biomarkers Volume (K) Forecast, by Application 2020 & 2033
- Table 19: Global Serum Biomarkers Revenue billion Forecast, by Application 2020 & 2033
- Table 20: Global Serum Biomarkers Volume K Forecast, by Application 2020 & 2033
- Table 21: Global Serum Biomarkers Revenue billion Forecast, by Types 2020 & 2033
- Table 22: Global Serum Biomarkers Volume K Forecast, by Types 2020 & 2033
- Table 23: Global Serum Biomarkers Revenue billion Forecast, by Country 2020 & 2033
- Table 24: Global Serum Biomarkers Volume K Forecast, by Country 2020 & 2033
- Table 25: Brazil Serum Biomarkers Revenue (billion) Forecast, by Application 2020 & 2033
- Table 26: Brazil Serum Biomarkers Volume (K) Forecast, by Application 2020 & 2033
- Table 27: Argentina Serum Biomarkers Revenue (billion) Forecast, by Application 2020 & 2033
- Table 28: Argentina Serum Biomarkers Volume (K) Forecast, by Application 2020 & 2033
- Table 29: Rest of South America Serum Biomarkers Revenue (billion) Forecast, by Application 2020 & 2033
- Table 30: Rest of South America Serum Biomarkers Volume (K) Forecast, by Application 2020 & 2033
- Table 31: Global Serum Biomarkers Revenue billion Forecast, by Application 2020 & 2033
- Table 32: Global Serum Biomarkers Volume K Forecast, by Application 2020 & 2033
- Table 33: Global Serum Biomarkers Revenue billion Forecast, by Types 2020 & 2033
- Table 34: Global Serum Biomarkers Volume K Forecast, by Types 2020 & 2033
- Table 35: Global Serum Biomarkers Revenue billion Forecast, by Country 2020 & 2033
- Table 36: Global Serum Biomarkers Volume K Forecast, by Country 2020 & 2033
- Table 37: United Kingdom Serum Biomarkers Revenue (billion) Forecast, by Application 2020 & 2033
- Table 38: United Kingdom Serum Biomarkers Volume (K) Forecast, by Application 2020 & 2033
- Table 39: Germany Serum Biomarkers Revenue (billion) Forecast, by Application 2020 & 2033
- Table 40: Germany Serum Biomarkers Volume (K) Forecast, by Application 2020 & 2033
- Table 41: France Serum Biomarkers Revenue (billion) Forecast, by Application 2020 & 2033
- Table 42: France Serum Biomarkers Volume (K) Forecast, by Application 2020 & 2033
- Table 43: Italy Serum Biomarkers Revenue (billion) Forecast, by Application 2020 & 2033
- Table 44: Italy Serum Biomarkers Volume (K) Forecast, by Application 2020 & 2033
- Table 45: Spain Serum Biomarkers Revenue (billion) Forecast, by Application 2020 & 2033
- Table 46: Spain Serum Biomarkers Volume (K) Forecast, by Application 2020 & 2033
- Table 47: Russia Serum Biomarkers Revenue (billion) Forecast, by Application 2020 & 2033
- Table 48: Russia Serum Biomarkers Volume (K) Forecast, by Application 2020 & 2033
- Table 49: Benelux Serum Biomarkers Revenue (billion) Forecast, by Application 2020 & 2033
- Table 50: Benelux Serum Biomarkers Volume (K) Forecast, by Application 2020 & 2033
- Table 51: Nordics Serum Biomarkers Revenue (billion) Forecast, by Application 2020 & 2033
- Table 52: Nordics Serum Biomarkers Volume (K) Forecast, by Application 2020 & 2033
- Table 53: Rest of Europe Serum Biomarkers Revenue (billion) Forecast, by Application 2020 & 2033
- Table 54: Rest of Europe Serum Biomarkers Volume (K) Forecast, by Application 2020 & 2033
- Table 55: Global Serum Biomarkers Revenue billion Forecast, by Application 2020 & 2033
- Table 56: Global Serum Biomarkers Volume K Forecast, by Application 2020 & 2033
- Table 57: Global Serum Biomarkers Revenue billion Forecast, by Types 2020 & 2033
- Table 58: Global Serum Biomarkers Volume K Forecast, by Types 2020 & 2033
- Table 59: Global Serum Biomarkers Revenue billion Forecast, by Country 2020 & 2033
- Table 60: Global Serum Biomarkers Volume K Forecast, by Country 2020 & 2033
- Table 61: Turkey Serum Biomarkers Revenue (billion) Forecast, by Application 2020 & 2033
- Table 62: Turkey Serum Biomarkers Volume (K) Forecast, by Application 2020 & 2033
- Table 63: Israel Serum Biomarkers Revenue (billion) Forecast, by Application 2020 & 2033
- Table 64: Israel Serum Biomarkers Volume (K) Forecast, by Application 2020 & 2033
- Table 65: GCC Serum Biomarkers Revenue (billion) Forecast, by Application 2020 & 2033
- Table 66: GCC Serum Biomarkers Volume (K) Forecast, by Application 2020 & 2033
- Table 67: North Africa Serum Biomarkers Revenue (billion) Forecast, by Application 2020 & 2033
- Table 68: North Africa Serum Biomarkers Volume (K) Forecast, by Application 2020 & 2033
- Table 69: South Africa Serum Biomarkers Revenue (billion) Forecast, by Application 2020 & 2033
- Table 70: South Africa Serum Biomarkers Volume (K) Forecast, by Application 2020 & 2033
- Table 71: Rest of Middle East & Africa Serum Biomarkers Revenue (billion) Forecast, by Application 2020 & 2033
- Table 72: Rest of Middle East & Africa Serum Biomarkers Volume (K) Forecast, by Application 2020 & 2033
- Table 73: Global Serum Biomarkers Revenue billion Forecast, by Application 2020 & 2033
- Table 74: Global Serum Biomarkers Volume K Forecast, by Application 2020 & 2033
- Table 75: Global Serum Biomarkers Revenue billion Forecast, by Types 2020 & 2033
- Table 76: Global Serum Biomarkers Volume K Forecast, by Types 2020 & 2033
- Table 77: Global Serum Biomarkers Revenue billion Forecast, by Country 2020 & 2033
- Table 78: Global Serum Biomarkers Volume K Forecast, by Country 2020 & 2033
- Table 79: China Serum Biomarkers Revenue (billion) Forecast, by Application 2020 & 2033
- Table 80: China Serum Biomarkers Volume (K) Forecast, by Application 2020 & 2033
- Table 81: India Serum Biomarkers Revenue (billion) Forecast, by Application 2020 & 2033
- Table 82: India Serum Biomarkers Volume (K) Forecast, by Application 2020 & 2033
- Table 83: Japan Serum Biomarkers Revenue (billion) Forecast, by Application 2020 & 2033
- Table 84: Japan Serum Biomarkers Volume (K) Forecast, by Application 2020 & 2033
- Table 85: South Korea Serum Biomarkers Revenue (billion) Forecast, by Application 2020 & 2033
- Table 86: South Korea Serum Biomarkers Volume (K) Forecast, by Application 2020 & 2033
- Table 87: ASEAN Serum Biomarkers Revenue (billion) Forecast, by Application 2020 & 2033
- Table 88: ASEAN Serum Biomarkers Volume (K) Forecast, by Application 2020 & 2033
- Table 89: Oceania Serum Biomarkers Revenue (billion) Forecast, by Application 2020 & 2033
- Table 90: Oceania Serum Biomarkers Volume (K) Forecast, by Application 2020 & 2033
- Table 91: Rest of Asia Pacific Serum Biomarkers Revenue (billion) Forecast, by Application 2020 & 2033
- Table 92: Rest of Asia Pacific Serum Biomarkers Volume (K) Forecast, by Application 2020 & 2033
Frequently Asked Questions
1. What is the projected Compound Annual Growth Rate (CAGR) of the Serum Biomarkers?
The projected CAGR is approximately 10.8%.
2. Which companies are prominent players in the Serum Biomarkers?
Key companies in the market include Roche, Pfizer, Novartis, Abbott, BD, Merck, Eli Lilly, Agilent Technologies, Boehringer Ingelheim, AstraZeneca, Bristol-Myers Squibb, Novo Nordisk, Allergan, Gilead.
3. What are the main segments of the Serum Biomarkers?
The market segments include Application, Types.
4. Can you provide details about the market size?
The market size is estimated to be USD 62.39 billion as of 2022.
5. What are some drivers contributing to market growth?
N/A
6. What are the notable trends driving market growth?
N/A
7. Are there any restraints impacting market growth?
N/A
8. Can you provide examples of recent developments in the market?
N/A
9. What pricing options are available for accessing the report?
Pricing options include single-user, multi-user, and enterprise licenses priced at USD 3350.00, USD 5025.00, and USD 6700.00 respectively.
10. Is the market size provided in terms of value or volume?
The market size is provided in terms of value, measured in billion and volume, measured in K.
11. Are there any specific market keywords associated with the report?
Yes, the market keyword associated with the report is "Serum Biomarkers," which aids in identifying and referencing the specific market segment covered.
12. How do I determine which pricing option suits my needs best?
The pricing options vary based on user requirements and access needs. Individual users may opt for single-user licenses, while businesses requiring broader access may choose multi-user or enterprise licenses for cost-effective access to the report.
13. Are there any additional resources or data provided in the Serum Biomarkers report?
While the report offers comprehensive insights, it's advisable to review the specific contents or supplementary materials provided to ascertain if additional resources or data are available.
14. How can I stay updated on further developments or reports in the Serum Biomarkers?
To stay informed about further developments, trends, and reports in the Serum Biomarkers, consider subscribing to industry newsletters, following relevant companies and organizations, or regularly checking reputable industry news sources and publications.
Methodology
Step 1 - Identification of Relevant Samples Size from Population Database


Step 2 - Approaches for Defining Global Market Size (Value, Volume* & Price*)

Note*: In applicable scenarios
Step 3 - Data Sources
Primary Research
- Web Analytics
- Survey Reports
- Research Institute
- Latest Research Reports
- Opinion Leaders
Secondary Research
- Annual Reports
- White Paper
- Latest Press Release
- Industry Association
- Paid Database
- Investor Presentations

Step 4 - Data Triangulation
Involves using different sources of information in order to increase the validity of a study
These sources are likely to be stakeholders in a program - participants, other researchers, program staff, other community members, and so on.
Then we put all data in single framework & apply various statistical tools to find out the dynamic on the market.
During the analysis stage, feedback from the stakeholder groups would be compared to determine areas of agreement as well as areas of divergence