

Key Insights
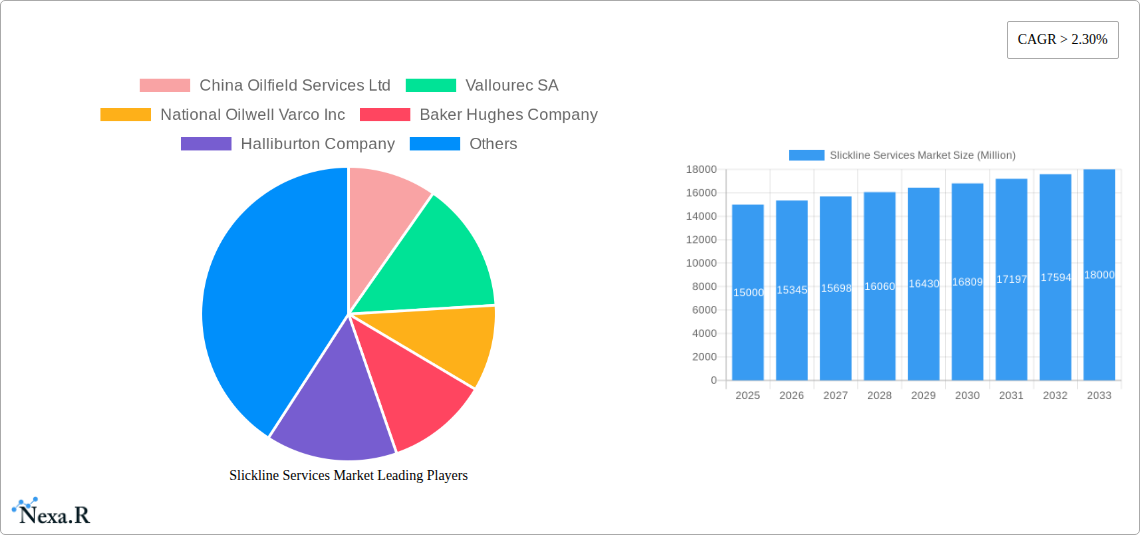
The global slickline services market is experiencing robust growth, driven by increasing oil and gas exploration and production activities worldwide. A compound annual growth rate (CAGR) exceeding 2.30% signifies a consistently expanding market, projected to reach significant value by 2033. Key market drivers include the rising demand for efficient well intervention and completion techniques, particularly in mature oil and gas fields requiring enhanced recovery methods. Technological advancements in slickline tools and services, enabling improved wellbore access and data acquisition, further fuel market expansion. The market is segmented by operation type (well completion, well intervention, logging) and deployment location (onshore, offshore). Onshore operations currently dominate, but offshore segments are expected to witness faster growth due to the increasing exploration and production activities in deepwater regions. Major players like Schlumberger, Halliburton, and Baker Hughes are actively investing in research and development, driving innovation and competition within the market. However, factors such as fluctuating oil prices and stringent regulatory compliance requirements pose potential restraints on market growth. The geographical distribution shows significant market presence in North America, followed by the Asia-Pacific region, with considerable growth potential in emerging economies. Overall, the outlook for the slickline services market remains positive, driven by long-term growth in energy demand and technological advancements that enhance operational efficiency.
The competitive landscape is characterized by a mix of large multinational corporations and smaller specialized service providers. The market is consolidating gradually, with larger companies acquiring smaller players to expand their service offerings and geographical reach. Strategic partnerships and collaborations are also becoming increasingly common, allowing companies to leverage each other's strengths and expertise. Future growth will be influenced by factors such as the adoption of advanced technologies like automated slickline systems and the increasing demand for environmentally friendly drilling and completion methods. The market will also see growth propelled by continuous technological advancements in data analytics and interpretation, which allow for better decision-making in well management. Furthermore, the ongoing exploration and development of unconventional oil and gas resources, such as shale gas and tight oil, will drive demand for slickline services in these challenging environments.
Slickline Services Market: A Comprehensive Report (2019-2033)
This comprehensive report provides an in-depth analysis of the global slickline services market, encompassing its dynamics, growth trends, key players, and future outlook. With a focus on both the parent market (oilfield services) and the child market (slickline services), this report is an essential resource for industry professionals, investors, and strategic decision-makers. The study period covers 2019-2033, with 2025 as the base and estimated year. The forecast period extends from 2025 to 2033, while the historical period encompasses 2019-2024. The market size is presented in million units.
Slickline Services Market Dynamics & Structure
The slickline services market is characterized by moderate concentration, with a few major players holding significant market share. Technological innovation, particularly in automation and data analytics, is a key driver, while regulatory frameworks concerning safety and environmental impact play a crucial role. Competitive product substitutes, such as coiled tubing, exist, but slickline services retain a niche due to their specialized applications. End-user demographics consist primarily of oil and gas exploration and production companies, with a growing demand from unconventional resource extraction. M&A activity has been relatively consistent, with xx deals recorded between 2019 and 2024, representing a xx% market share shift.
- Market Concentration: Moderately concentrated, with top 5 players holding approximately xx% market share in 2024.
- Technological Innovation: Automation, data analytics, and improved materials driving efficiency and safety.
- Regulatory Frameworks: Stringent safety and environmental regulations impacting operational costs and strategies.
- Competitive Substitutes: Coiled tubing poses a competitive threat in certain applications.
- End-User Demographics: Primarily oil and gas exploration and production companies.
- M&A Trends: xx M&A deals recorded between 2019 and 2024, resulting in a xx% market share shift amongst major players. Innovation barriers include high R&D costs and the need for specialized expertise.
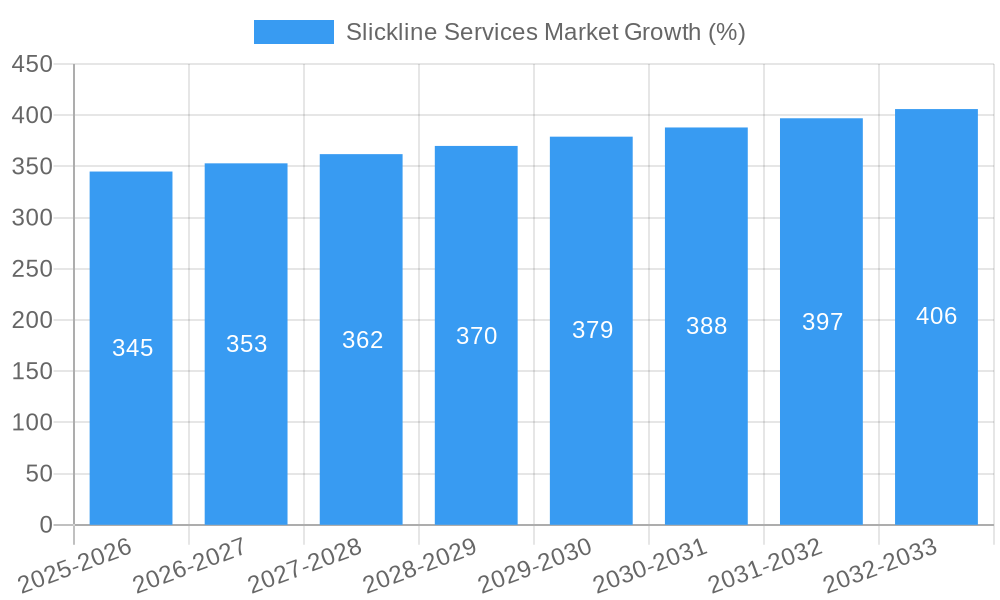
Slickline Services Market Growth Trends & Insights
The global slickline services market is projected to experience significant growth during the forecast period (2025-2033). Driven by increasing global energy demand and exploration activities, particularly in unconventional resources, the market is expected to reach xx million units by 2033, registering a CAGR of xx% from 2025. This growth is further fueled by technological advancements enhancing efficiency and safety, and a rising adoption rate of slickline services in various well intervention operations. Consumer behavior, driven by cost-optimization and operational efficiency, also plays a vital role. The market penetration rate is expected to reach xx% by 2033. Technological disruptions such as the adoption of robotics and AI are poised to further accelerate growth in the coming years.
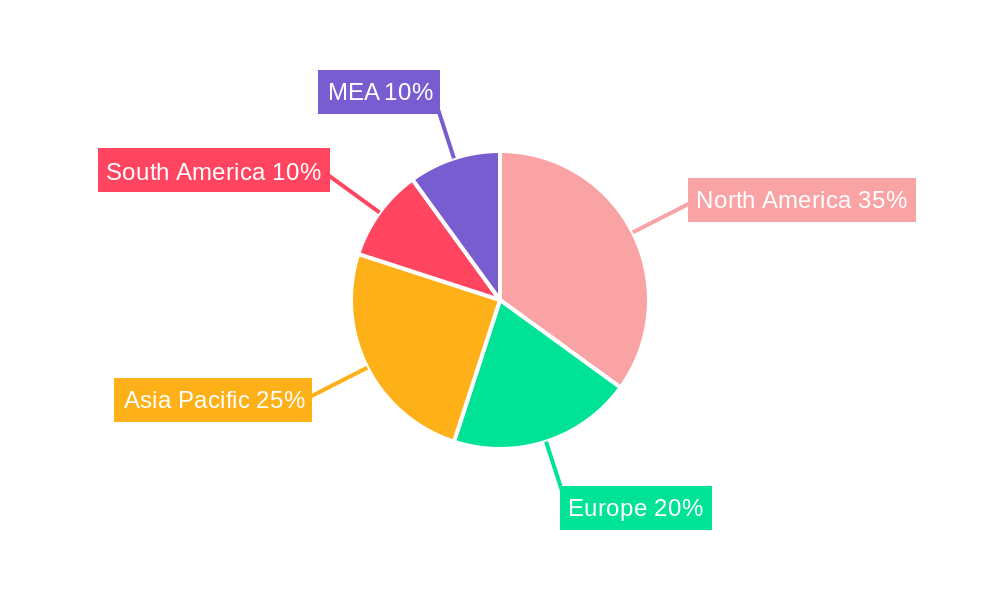
Dominant Regions, Countries, or Segments in Slickline Services Market
North America currently dominates the slickline services market, followed by the Middle East and Asia Pacific. The onshore segment holds the largest market share, primarily driven by extensive onshore oil and gas operations in regions like North America and the Middle East. Well completion accounts for the largest share within the operational segments, reflecting the high demand for slickline services in this critical phase of well development.
Key Drivers:
- North America: Abundant unconventional resources and robust exploration activities.
- Middle East: High oil and gas production and extensive infrastructure investments.
- Asia Pacific: Growing energy demand and increasing exploration in offshore areas.
- Onshore Segment: High concentration of oil and gas operations.
- Well Completion Segment: High demand during well construction and completion phase.
Dominance Factors: Strong presence of major oil and gas companies, well-established infrastructure, and favorable regulatory environments contribute to regional dominance. The growth potential is significantly high in Asia Pacific and Latin America, fueled by rising energy demand and increasing exploration activities.
Slickline Services Market Product Landscape
Slickline services encompass a range of tools and technologies, including advanced logging tools, specialized deployment systems, and data acquisition and analysis software. Continuous advancements in these tools enhance operational efficiency, improve data quality, and minimize environmental impact. Unique selling propositions often center around enhanced data accuracy, faster deployment times, and improved safety features. Technological advancements include the integration of robotics, AI, and remote operation capabilities.
Key Drivers, Barriers & Challenges in Slickline Services Market
Key Drivers: Increasing global energy demand, growth in unconventional resource exploration, and technological advancements (automation, data analytics) are major drivers. The shift toward enhanced oil recovery (EOR) techniques also fuels demand.
Key Challenges: Fluctuating oil and gas prices, stringent environmental regulations, and intense competition among service providers pose significant challenges. Supply chain disruptions, particularly in the sourcing of specialized components, and skilled labor shortages can also impact market growth. These factors combined can result in a xx% reduction in market growth in certain regions.
Emerging Opportunities in Slickline Services Market
Emerging opportunities lie in the application of slickline services to unconventional resources like shale gas and tight oil, the increasing adoption of remote operations and automation, and the expansion into new geographic markets, particularly in developing economies with growing energy needs. Focus on data analytics and integration with other well intervention technologies will also create lucrative opportunities.
Growth Accelerators in the Slickline Services Market Industry
Technological breakthroughs in automation, data analytics, and robotics are significant growth accelerators. Strategic partnerships between service providers and oil and gas companies for integrated solutions are also boosting market growth. Market expansion strategies targeting new geographic areas and unconventional resources will continue to propel the market's growth trajectory.
Key Players Shaping the Slickline Services Market Market
- China Oilfield Services Ltd
- Vallourec SA
- National Oilwell Varco Inc
- Baker Hughes Company
- Halliburton Company
- Weatherford International Ltd
- Schlumberger Limited
- Scientific Drilling International Inc
Notable Milestones in Slickline Services Market Sector
- October 2021: National Energy Services announces multi-year contracts totaling over USD 150M for slickline services in GCC countries.
- September 2021: Reservoir Link Energy Bhd secures a contract from Sarawak Shell for slickline equipment and services in Malaysia.
In-Depth Slickline Services Market Outlook
The slickline services market is poised for continued growth, driven by increasing energy demand, technological advancements, and the expansion into new applications and markets. Strategic partnerships, investments in R&D, and a focus on operational efficiency will be crucial for success in this dynamic market. The long-term potential is significant, particularly in regions with growing oil and gas activities and the increasing adoption of advanced technologies.
Slickline Services Market Segmentation
-
1. Operation
- 1.1. Well Completion
- 1.2. Well Intervention
- 1.3. Logging
-
2. Location of Deployment
- 2.1. Onshore
- 2.2. Offshore
Slickline Services Market Segmentation By Geography
- 1. North America
- 2. Europe
- 3. Asia Pacific
- 4. South America
- 5. Middle East and Africa
Slickline Services Market REPORT HIGHLIGHTS
| Aspects | Details |
|---|---|
| Study Period | 2019-2033 |
| Base Year | 2024 |
| Estimated Year | 2025 |
| Forecast Period | 2025-2033 |
| Historical Period | 2019-2024 |
| Growth Rate | CAGR of > 2.30% from 2019-2033 |
| Segmentation |
|
Table of Contents
- 1. Introduction
- 1.1. Research Scope
- 1.2. Market Segmentation
- 1.3. Research Methodology
- 1.4. Definitions and Assumptions
- 2. Executive Summary
- 2.1. Introduction
- 3. Market Dynamics
- 3.1. Introduction
- 3.2. Market Drivers
- 3.2.1. 4.; Increased Drilling and Completion Activities
- 3.3. Market Restrains
- 3.3.1. 4.; Volatility of Oil Prices
- 3.4. Market Trends
- 3.4.1. Onshore Segment to Dominate the Market
- 4. Market Factor Analysis
- 4.1. Porters Five Forces
- 4.2. Supply/Value Chain
- 4.3. PESTEL analysis
- 4.4. Market Entropy
- 4.5. Patent/Trademark Analysis
- 5. Global Slickline Services Market Analysis, Insights and Forecast, 2019-2031
- 5.1. Market Analysis, Insights and Forecast - by Operation
- 5.1.1. Well Completion
- 5.1.2. Well Intervention
- 5.1.3. Logging
- 5.2. Market Analysis, Insights and Forecast - by Location of Deployment
- 5.2.1. Onshore
- 5.2.2. Offshore
- 5.3. Market Analysis, Insights and Forecast - by Region
- 5.3.1. North America
- 5.3.2. Europe
- 5.3.3. Asia Pacific
- 5.3.4. South America
- 5.3.5. Middle East and Africa
- 5.1. Market Analysis, Insights and Forecast - by Operation
- 6. North America Slickline Services Market Analysis, Insights and Forecast, 2019-2031
- 6.1. Market Analysis, Insights and Forecast - by Operation
- 6.1.1. Well Completion
- 6.1.2. Well Intervention
- 6.1.3. Logging
- 6.2. Market Analysis, Insights and Forecast - by Location of Deployment
- 6.2.1. Onshore
- 6.2.2. Offshore
- 6.1. Market Analysis, Insights and Forecast - by Operation
- 7. Europe Slickline Services Market Analysis, Insights and Forecast, 2019-2031
- 7.1. Market Analysis, Insights and Forecast - by Operation
- 7.1.1. Well Completion
- 7.1.2. Well Intervention
- 7.1.3. Logging
- 7.2. Market Analysis, Insights and Forecast - by Location of Deployment
- 7.2.1. Onshore
- 7.2.2. Offshore
- 7.1. Market Analysis, Insights and Forecast - by Operation
- 8. Asia Pacific Slickline Services Market Analysis, Insights and Forecast, 2019-2031
- 8.1. Market Analysis, Insights and Forecast - by Operation
- 8.1.1. Well Completion
- 8.1.2. Well Intervention
- 8.1.3. Logging
- 8.2. Market Analysis, Insights and Forecast - by Location of Deployment
- 8.2.1. Onshore
- 8.2.2. Offshore
- 8.1. Market Analysis, Insights and Forecast - by Operation
- 9. South America Slickline Services Market Analysis, Insights and Forecast, 2019-2031
- 9.1. Market Analysis, Insights and Forecast - by Operation
- 9.1.1. Well Completion
- 9.1.2. Well Intervention
- 9.1.3. Logging
- 9.2. Market Analysis, Insights and Forecast - by Location of Deployment
- 9.2.1. Onshore
- 9.2.2. Offshore
- 9.1. Market Analysis, Insights and Forecast - by Operation
- 10. Middle East and Africa Slickline Services Market Analysis, Insights and Forecast, 2019-2031
- 10.1. Market Analysis, Insights and Forecast - by Operation
- 10.1.1. Well Completion
- 10.1.2. Well Intervention
- 10.1.3. Logging
- 10.2. Market Analysis, Insights and Forecast - by Location of Deployment
- 10.2.1. Onshore
- 10.2.2. Offshore
- 10.1. Market Analysis, Insights and Forecast - by Operation
- 11. North America Slickline Services Market Analysis, Insights and Forecast, 2019-2031
- 11.1. Market Analysis, Insights and Forecast - By Country/Sub-region
- 11.1.1 United States
- 11.1.2 Canada
- 11.1.3 Mexico
- 12. Europe Slickline Services Market Analysis, Insights and Forecast, 2019-2031
- 12.1. Market Analysis, Insights and Forecast - By Country/Sub-region
- 12.1.1 Germany
- 12.1.2 United Kingdom
- 12.1.3 France
- 12.1.4 Spain
- 12.1.5 Italy
- 12.1.6 Spain
- 12.1.7 Belgium
- 12.1.8 Netherland
- 12.1.9 Nordics
- 12.1.10 Rest of Europe
- 13. Asia Pacific Slickline Services Market Analysis, Insights and Forecast, 2019-2031
- 13.1. Market Analysis, Insights and Forecast - By Country/Sub-region
- 13.1.1 China
- 13.1.2 Japan
- 13.1.3 India
- 13.1.4 South Korea
- 13.1.5 Southeast Asia
- 13.1.6 Australia
- 13.1.7 Indonesia
- 13.1.8 Phillipes
- 13.1.9 Singapore
- 13.1.10 Thailandc
- 13.1.11 Rest of Asia Pacific
- 14. South America Slickline Services Market Analysis, Insights and Forecast, 2019-2031
- 14.1. Market Analysis, Insights and Forecast - By Country/Sub-region
- 14.1.1 Brazil
- 14.1.2 Argentina
- 14.1.3 Peru
- 14.1.4 Chile
- 14.1.5 Colombia
- 14.1.6 Ecuador
- 14.1.7 Venezuela
- 14.1.8 Rest of South America
- 15. MEA Slickline Services Market Analysis, Insights and Forecast, 2019-2031
- 15.1. Market Analysis, Insights and Forecast - By Country/Sub-region
- 15.1.1 United Arab Emirates
- 15.1.2 Saudi Arabia
- 15.1.3 South Africa
- 15.1.4 Rest of Middle East and Africa
- 16. Competitive Analysis
- 16.1. Global Market Share Analysis 2024
- 16.2. Company Profiles
- 16.2.1 China Oilfield Services Ltd
- 16.2.1.1. Overview
- 16.2.1.2. Products
- 16.2.1.3. SWOT Analysis
- 16.2.1.4. Recent Developments
- 16.2.1.5. Financials (Based on Availability)
- 16.2.2 Vallourec SA
- 16.2.2.1. Overview
- 16.2.2.2. Products
- 16.2.2.3. SWOT Analysis
- 16.2.2.4. Recent Developments
- 16.2.2.5. Financials (Based on Availability)
- 16.2.3 National Oilwell Varco Inc
- 16.2.3.1. Overview
- 16.2.3.2. Products
- 16.2.3.3. SWOT Analysis
- 16.2.3.4. Recent Developments
- 16.2.3.5. Financials (Based on Availability)
- 16.2.4 Baker Hughes Company
- 16.2.4.1. Overview
- 16.2.4.2. Products
- 16.2.4.3. SWOT Analysis
- 16.2.4.4. Recent Developments
- 16.2.4.5. Financials (Based on Availability)
- 16.2.5 Halliburton Company
- 16.2.5.1. Overview
- 16.2.5.2. Products
- 16.2.5.3. SWOT Analysis
- 16.2.5.4. Recent Developments
- 16.2.5.5. Financials (Based on Availability)
- 16.2.6 Weatherford International Ltd
- 16.2.6.1. Overview
- 16.2.6.2. Products
- 16.2.6.3. SWOT Analysis
- 16.2.6.4. Recent Developments
- 16.2.6.5. Financials (Based on Availability)
- 16.2.7 Schlumberger Limited
- 16.2.7.1. Overview
- 16.2.7.2. Products
- 16.2.7.3. SWOT Analysis
- 16.2.7.4. Recent Developments
- 16.2.7.5. Financials (Based on Availability)
- 16.2.8 Scientific Drilling International Inc
- 16.2.8.1. Overview
- 16.2.8.2. Products
- 16.2.8.3. SWOT Analysis
- 16.2.8.4. Recent Developments
- 16.2.8.5. Financials (Based on Availability)
- 16.2.1 China Oilfield Services Ltd
List of Figures
- Figure 1: Global Slickline Services Market Revenue Breakdown (Million, %) by Region 2024 & 2032
- Figure 2: North America Slickline Services Market Revenue (Million), by Country 2024 & 2032
- Figure 3: North America Slickline Services Market Revenue Share (%), by Country 2024 & 2032
- Figure 4: Europe Slickline Services Market Revenue (Million), by Country 2024 & 2032
- Figure 5: Europe Slickline Services Market Revenue Share (%), by Country 2024 & 2032
- Figure 6: Asia Pacific Slickline Services Market Revenue (Million), by Country 2024 & 2032
- Figure 7: Asia Pacific Slickline Services Market Revenue Share (%), by Country 2024 & 2032
- Figure 8: South America Slickline Services Market Revenue (Million), by Country 2024 & 2032
- Figure 9: South America Slickline Services Market Revenue Share (%), by Country 2024 & 2032
- Figure 10: MEA Slickline Services Market Revenue (Million), by Country 2024 & 2032
- Figure 11: MEA Slickline Services Market Revenue Share (%), by Country 2024 & 2032
- Figure 12: North America Slickline Services Market Revenue (Million), by Operation 2024 & 2032
- Figure 13: North America Slickline Services Market Revenue Share (%), by Operation 2024 & 2032
- Figure 14: North America Slickline Services Market Revenue (Million), by Location of Deployment 2024 & 2032
- Figure 15: North America Slickline Services Market Revenue Share (%), by Location of Deployment 2024 & 2032
- Figure 16: North America Slickline Services Market Revenue (Million), by Country 2024 & 2032
- Figure 17: North America Slickline Services Market Revenue Share (%), by Country 2024 & 2032
- Figure 18: Europe Slickline Services Market Revenue (Million), by Operation 2024 & 2032
- Figure 19: Europe Slickline Services Market Revenue Share (%), by Operation 2024 & 2032
- Figure 20: Europe Slickline Services Market Revenue (Million), by Location of Deployment 2024 & 2032
- Figure 21: Europe Slickline Services Market Revenue Share (%), by Location of Deployment 2024 & 2032
- Figure 22: Europe Slickline Services Market Revenue (Million), by Country 2024 & 2032
- Figure 23: Europe Slickline Services Market Revenue Share (%), by Country 2024 & 2032
- Figure 24: Asia Pacific Slickline Services Market Revenue (Million), by Operation 2024 & 2032
- Figure 25: Asia Pacific Slickline Services Market Revenue Share (%), by Operation 2024 & 2032
- Figure 26: Asia Pacific Slickline Services Market Revenue (Million), by Location of Deployment 2024 & 2032
- Figure 27: Asia Pacific Slickline Services Market Revenue Share (%), by Location of Deployment 2024 & 2032
- Figure 28: Asia Pacific Slickline Services Market Revenue (Million), by Country 2024 & 2032
- Figure 29: Asia Pacific Slickline Services Market Revenue Share (%), by Country 2024 & 2032
- Figure 30: South America Slickline Services Market Revenue (Million), by Operation 2024 & 2032
- Figure 31: South America Slickline Services Market Revenue Share (%), by Operation 2024 & 2032
- Figure 32: South America Slickline Services Market Revenue (Million), by Location of Deployment 2024 & 2032
- Figure 33: South America Slickline Services Market Revenue Share (%), by Location of Deployment 2024 & 2032
- Figure 34: South America Slickline Services Market Revenue (Million), by Country 2024 & 2032
- Figure 35: South America Slickline Services Market Revenue Share (%), by Country 2024 & 2032
- Figure 36: Middle East and Africa Slickline Services Market Revenue (Million), by Operation 2024 & 2032
- Figure 37: Middle East and Africa Slickline Services Market Revenue Share (%), by Operation 2024 & 2032
- Figure 38: Middle East and Africa Slickline Services Market Revenue (Million), by Location of Deployment 2024 & 2032
- Figure 39: Middle East and Africa Slickline Services Market Revenue Share (%), by Location of Deployment 2024 & 2032
- Figure 40: Middle East and Africa Slickline Services Market Revenue (Million), by Country 2024 & 2032
- Figure 41: Middle East and Africa Slickline Services Market Revenue Share (%), by Country 2024 & 2032
List of Tables
- Table 1: Global Slickline Services Market Revenue Million Forecast, by Region 2019 & 2032
- Table 2: Global Slickline Services Market Revenue Million Forecast, by Operation 2019 & 2032
- Table 3: Global Slickline Services Market Revenue Million Forecast, by Location of Deployment 2019 & 2032
- Table 4: Global Slickline Services Market Revenue Million Forecast, by Region 2019 & 2032
- Table 5: Global Slickline Services Market Revenue Million Forecast, by Country 2019 & 2032
- Table 6: United States Slickline Services Market Revenue (Million) Forecast, by Application 2019 & 2032
- Table 7: Canada Slickline Services Market Revenue (Million) Forecast, by Application 2019 & 2032
- Table 8: Mexico Slickline Services Market Revenue (Million) Forecast, by Application 2019 & 2032
- Table 9: Global Slickline Services Market Revenue Million Forecast, by Country 2019 & 2032
- Table 10: Germany Slickline Services Market Revenue (Million) Forecast, by Application 2019 & 2032
- Table 11: United Kingdom Slickline Services Market Revenue (Million) Forecast, by Application 2019 & 2032
- Table 12: France Slickline Services Market Revenue (Million) Forecast, by Application 2019 & 2032
- Table 13: Spain Slickline Services Market Revenue (Million) Forecast, by Application 2019 & 2032
- Table 14: Italy Slickline Services Market Revenue (Million) Forecast, by Application 2019 & 2032
- Table 15: Spain Slickline Services Market Revenue (Million) Forecast, by Application 2019 & 2032
- Table 16: Belgium Slickline Services Market Revenue (Million) Forecast, by Application 2019 & 2032
- Table 17: Netherland Slickline Services Market Revenue (Million) Forecast, by Application 2019 & 2032
- Table 18: Nordics Slickline Services Market Revenue (Million) Forecast, by Application 2019 & 2032
- Table 19: Rest of Europe Slickline Services Market Revenue (Million) Forecast, by Application 2019 & 2032
- Table 20: Global Slickline Services Market Revenue Million Forecast, by Country 2019 & 2032
- Table 21: China Slickline Services Market Revenue (Million) Forecast, by Application 2019 & 2032
- Table 22: Japan Slickline Services Market Revenue (Million) Forecast, by Application 2019 & 2032
- Table 23: India Slickline Services Market Revenue (Million) Forecast, by Application 2019 & 2032
- Table 24: South Korea Slickline Services Market Revenue (Million) Forecast, by Application 2019 & 2032
- Table 25: Southeast Asia Slickline Services Market Revenue (Million) Forecast, by Application 2019 & 2032
- Table 26: Australia Slickline Services Market Revenue (Million) Forecast, by Application 2019 & 2032
- Table 27: Indonesia Slickline Services Market Revenue (Million) Forecast, by Application 2019 & 2032
- Table 28: Phillipes Slickline Services Market Revenue (Million) Forecast, by Application 2019 & 2032
- Table 29: Singapore Slickline Services Market Revenue (Million) Forecast, by Application 2019 & 2032
- Table 30: Thailandc Slickline Services Market Revenue (Million) Forecast, by Application 2019 & 2032
- Table 31: Rest of Asia Pacific Slickline Services Market Revenue (Million) Forecast, by Application 2019 & 2032
- Table 32: Global Slickline Services Market Revenue Million Forecast, by Country 2019 & 2032
- Table 33: Brazil Slickline Services Market Revenue (Million) Forecast, by Application 2019 & 2032
- Table 34: Argentina Slickline Services Market Revenue (Million) Forecast, by Application 2019 & 2032
- Table 35: Peru Slickline Services Market Revenue (Million) Forecast, by Application 2019 & 2032
- Table 36: Chile Slickline Services Market Revenue (Million) Forecast, by Application 2019 & 2032
- Table 37: Colombia Slickline Services Market Revenue (Million) Forecast, by Application 2019 & 2032
- Table 38: Ecuador Slickline Services Market Revenue (Million) Forecast, by Application 2019 & 2032
- Table 39: Venezuela Slickline Services Market Revenue (Million) Forecast, by Application 2019 & 2032
- Table 40: Rest of South America Slickline Services Market Revenue (Million) Forecast, by Application 2019 & 2032
- Table 41: Global Slickline Services Market Revenue Million Forecast, by Country 2019 & 2032
- Table 42: United Arab Emirates Slickline Services Market Revenue (Million) Forecast, by Application 2019 & 2032
- Table 43: Saudi Arabia Slickline Services Market Revenue (Million) Forecast, by Application 2019 & 2032
- Table 44: South Africa Slickline Services Market Revenue (Million) Forecast, by Application 2019 & 2032
- Table 45: Rest of Middle East and Africa Slickline Services Market Revenue (Million) Forecast, by Application 2019 & 2032
- Table 46: Global Slickline Services Market Revenue Million Forecast, by Operation 2019 & 2032
- Table 47: Global Slickline Services Market Revenue Million Forecast, by Location of Deployment 2019 & 2032
- Table 48: Global Slickline Services Market Revenue Million Forecast, by Country 2019 & 2032
- Table 49: Global Slickline Services Market Revenue Million Forecast, by Operation 2019 & 2032
- Table 50: Global Slickline Services Market Revenue Million Forecast, by Location of Deployment 2019 & 2032
- Table 51: Global Slickline Services Market Revenue Million Forecast, by Country 2019 & 2032
- Table 52: Global Slickline Services Market Revenue Million Forecast, by Operation 2019 & 2032
- Table 53: Global Slickline Services Market Revenue Million Forecast, by Location of Deployment 2019 & 2032
- Table 54: Global Slickline Services Market Revenue Million Forecast, by Country 2019 & 2032
- Table 55: Global Slickline Services Market Revenue Million Forecast, by Operation 2019 & 2032
- Table 56: Global Slickline Services Market Revenue Million Forecast, by Location of Deployment 2019 & 2032
- Table 57: Global Slickline Services Market Revenue Million Forecast, by Country 2019 & 2032
- Table 58: Global Slickline Services Market Revenue Million Forecast, by Operation 2019 & 2032
- Table 59: Global Slickline Services Market Revenue Million Forecast, by Location of Deployment 2019 & 2032
- Table 60: Global Slickline Services Market Revenue Million Forecast, by Country 2019 & 2032
Frequently Asked Questions
1. What is the projected Compound Annual Growth Rate (CAGR) of the Slickline Services Market?
The projected CAGR is approximately > 2.30%.
2. Which companies are prominent players in the Slickline Services Market?
Key companies in the market include China Oilfield Services Ltd, Vallourec SA, National Oilwell Varco Inc, Baker Hughes Company, Halliburton Company, Weatherford International Ltd, Schlumberger Limited, Scientific Drilling International Inc.
3. What are the main segments of the Slickline Services Market?
The market segments include Operation, Location of Deployment.
4. Can you provide details about the market size?
The market size is estimated to be USD XX Million as of 2022.
5. What are some drivers contributing to market growth?
4.; Increased Drilling and Completion Activities.
6. What are the notable trends driving market growth?
Onshore Segment to Dominate the Market.
7. Are there any restraints impacting market growth?
4.; Volatility of Oil Prices.
8. Can you provide examples of recent developments in the market?
In October 2021, National Energy Services announced several drilling and evaluation service lines in GCC countries, totaling more than USD 150M. It also revealed that the multi-year contracts encompass slickline services, tubular running services, and testing services with multiple national oil companies.
9. What pricing options are available for accessing the report?
Pricing options include single-user, multi-user, and enterprise licenses priced at USD 4750, USD 5250, and USD 8750 respectively.
10. Is the market size provided in terms of value or volume?
The market size is provided in terms of value, measured in Million.
11. Are there any specific market keywords associated with the report?
Yes, the market keyword associated with the report is "Slickline Services Market," which aids in identifying and referencing the specific market segment covered.
12. How do I determine which pricing option suits my needs best?
The pricing options vary based on user requirements and access needs. Individual users may opt for single-user licenses, while businesses requiring broader access may choose multi-user or enterprise licenses for cost-effective access to the report.
13. Are there any additional resources or data provided in the Slickline Services Market report?
While the report offers comprehensive insights, it's advisable to review the specific contents or supplementary materials provided to ascertain if additional resources or data are available.
14. How can I stay updated on further developments or reports in the Slickline Services Market?
To stay informed about further developments, trends, and reports in the Slickline Services Market, consider subscribing to industry newsletters, following relevant companies and organizations, or regularly checking reputable industry news sources and publications.
Methodology
Step 1 - Identification of Relevant Samples Size from Population Database


Step 2 - Approaches for Defining Global Market Size (Value, Volume* & Price*)

Note*: In applicable scenarios
Step 3 - Data Sources
Primary Research
- Web Analytics
- Survey Reports
- Research Institute
- Latest Research Reports
- Opinion Leaders
Secondary Research
- Annual Reports
- White Paper
- Latest Press Release
- Industry Association
- Paid Database
- Investor Presentations

Step 4 - Data Triangulation
Involves using different sources of information in order to increase the validity of a study
These sources are likely to be stakeholders in a program - participants, other researchers, program staff, other community members, and so on.
Then we put all data in single framework & apply various statistical tools to find out the dynamic on the market.
During the analysis stage, feedback from the stakeholder groups would be compared to determine areas of agreement as well as areas of divergence
