

Key Insights
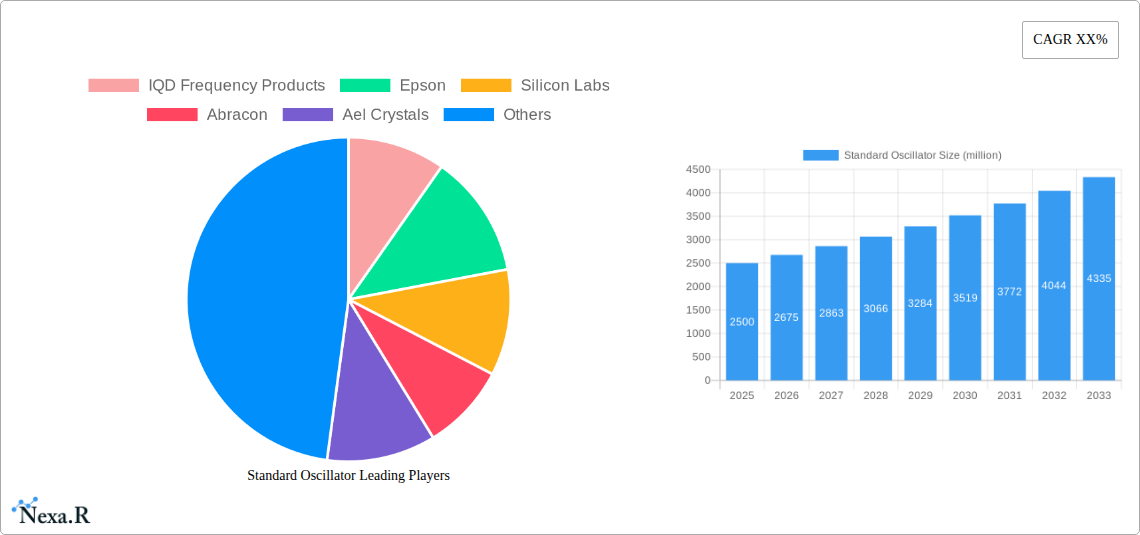
The global standard oscillator market is experiencing robust growth, driven by the increasing demand for high-precision timing devices across diverse sectors. The market, estimated at $2.5 billion in 2025, is projected to exhibit a Compound Annual Growth Rate (CAGR) of 7% from 2025 to 2033, reaching an estimated value of $4.2 billion by 2033. This growth is fueled by several key factors, including the proliferation of IoT devices requiring precise timing synchronization, the expansion of 5G and other high-speed communication networks, and the increasing adoption of automation and industrial control systems. Furthermore, advancements in oscillator technology, such as the development of smaller, more energy-efficient devices, are contributing to market expansion. Key players such as IQD Frequency Products, Epson, and Silicon Labs are driving innovation and competition within the market, constantly striving to improve performance, reduce costs, and expand product portfolios to cater to the evolving needs of various applications.
The market is segmented by frequency range, application (consumer electronics, automotive, industrial, telecommunications, etc.), and technology (crystal oscillators, ceramic resonators, MEMS oscillators). The consumer electronics segment is a major driver, fueled by the ever-increasing demand for smartphones, wearables, and other consumer gadgets. The automotive sector also contributes significantly due to the increasing integration of electronic control units (ECUs) and advanced driver-assistance systems (ADAS). Geographic distribution shows a strong presence in North America and Asia-Pacific, with these regions expected to maintain significant market shares throughout the forecast period. However, growth opportunities are emerging in developing economies as technological adoption accelerates. While challenges remain, such as supply chain disruptions and fluctuating raw material costs, the long-term outlook for the standard oscillator market remains optimistic, driven by sustained technological advancements and expanding applications across various industries.
Standard Oscillator Market Report: 2019-2033
This comprehensive report provides an in-depth analysis of the Standard Oscillator market, encompassing market dynamics, growth trends, regional analysis, product landscape, key players, and future outlook. The study period covers 2019-2033, with 2025 as the base and estimated year. The forecast period is 2025-2033, and the historical period is 2019-2024. This report is essential for industry professionals, investors, and market strategists seeking to understand and capitalize on the opportunities within this dynamic sector. The total market size in 2025 is estimated at $xx million.
Standard Oscillator Market Dynamics & Structure
The Standard Oscillator market is characterized by a moderately concentrated structure, with key players holding significant market shares. The market is driven by technological advancements in miniaturization, power efficiency, and precision, particularly within the consumer electronics and automotive sectors. Stringent regulatory compliance requirements related to electromagnetic interference (EMI) and signal stability impact market dynamics. The emergence of MEMS-based oscillators presents a significant competitive substitute. M&A activity has been moderate, with approximately xx deals recorded between 2019 and 2024. End-user demographics are broadly distributed across various industries, with a concentration in consumer electronics and automotive.
- Market Concentration: Moderately concentrated, with top 5 players holding approximately 45% market share in 2025.
- Technological Innovation: Focus on miniaturization, lower power consumption, and enhanced frequency stability.
- Regulatory Framework: Stringent EMI and safety standards drive product development.
- Competitive Substitutes: MEMS oscillators pose a growing competitive threat.
- End-User Demographics: Diverse, spanning consumer electronics, automotive, industrial, and telecom.
- M&A Trends: Moderate activity, with an estimated xx million USD in deal value between 2019-2024.
Standard Oscillator Growth Trends & Insights
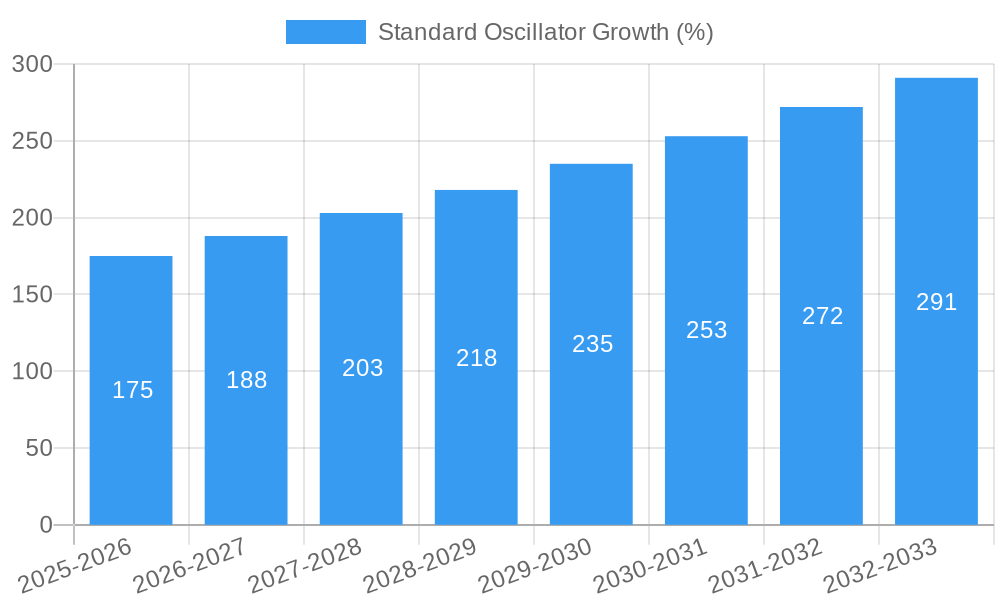
The Standard Oscillator market experienced robust growth during the historical period (2019-2024), driven by increasing demand from the consumer electronics and automotive industries. The market is expected to maintain a healthy Compound Annual Growth Rate (CAGR) of xx% during the forecast period (2025-2033). This growth is fueled by the increasing adoption of sophisticated electronics in various applications, such as smartphones, wearables, and advanced driver-assistance systems (ADAS). Technological disruptions, such as the integration of advanced materials and manufacturing processes, are further contributing to market expansion. Consumer behavior shifts toward smaller, more energy-efficient devices are also creating favorable conditions for growth. Market penetration rates are expected to increase significantly in developing economies.
Dominant Regions, Countries, or Segments in Standard Oscillator
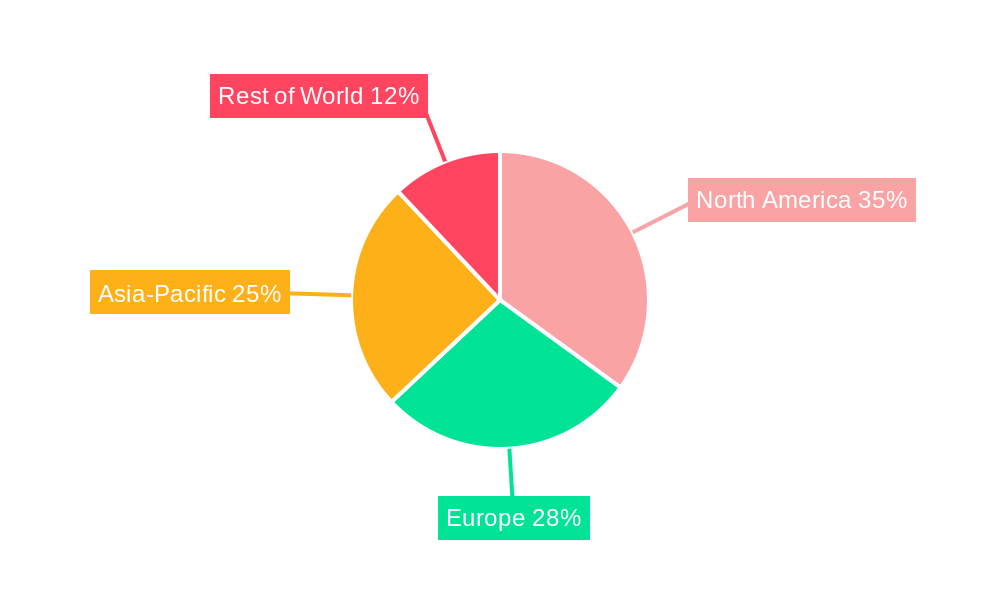
North America currently holds the largest market share in the Standard Oscillator sector, driven by robust technological advancements and strong demand from the consumer electronics industry. Asia-Pacific, particularly China and Japan, are exhibiting strong growth potential, propelled by rapid industrialization and a burgeoning electronics manufacturing sector. The automotive segment is a significant driver of growth globally, due to increased integration of electronics in vehicles.
- North America: Strong demand, high technological adoption, and established manufacturing base.
- Asia-Pacific: Rapid industrialization, expanding electronics sector, and cost-effective manufacturing.
- Europe: Steady growth, driven by automotive and industrial applications.
- Automotive Segment: Significant growth driver due to ADAS and vehicle electrification.
Standard Oscillator Product Landscape
The Standard Oscillator market offers a diverse range of products with varying frequency ranges, accuracy levels, and power consumption characteristics. Recent innovations have focused on improving frequency stability, reducing power consumption, and enhancing miniaturization. This has led to the development of highly integrated solutions, providing improved performance and enhanced system reliability. Key selling propositions include precision, stability, compact design and low power consumption, addressing diverse end-user requirements.
Key Drivers, Barriers & Challenges in Standard Oscillator
Key Drivers:
- Increasing demand from consumer electronics and automotive sectors.
- Technological advancements leading to enhanced performance and miniaturization.
- Growing adoption of sophisticated electronic devices in various applications.
Key Challenges and Restraints:
- Intense competition among numerous manufacturers leads to price pressures.
- Supply chain disruptions can impact production and delivery timelines.
- Regulatory compliance requirements can increase production costs.
Emerging Opportunities in Standard Oscillator
Emerging opportunities lie in the development of high-frequency oscillators for 5G and other wireless communication technologies. The growing demand for IoT devices presents a significant opportunity for miniaturized and low-power oscillators. The adoption of advanced materials and manufacturing processes will further expand market potential.
Growth Accelerators in the Standard Oscillator Industry
Strategic partnerships and collaborations between manufacturers and technology providers are key growth accelerators. Continuous innovation in materials and manufacturing processes will drive efficiency and performance improvements. Expansion into new geographic markets and emerging applications will fuel sustained market expansion.
Key Players Shaping the Standard Oscillator Market
- IQD Frequency Products
- Epson
- Silicon Labs
- Abracon
- Ael Crystals
- Aker
- Bliley Technologies
- Citizen Finedevice
- CTS
- Ecliptek
- ECS Inc International
- Euroquartz
- Fox Electronics
- Ilsi America
- Kyocera
- Mercury United Electronics
- Micro Crystal
- MMD
- Qantek Technology Corporation
- Raltron
- Renesas
- Sitime
- TXC
- Vishay
Notable Milestones in Standard Oscillator Sector
- 2020: Introduction of a new low-power oscillator by Silicon Labs.
- 2022: Acquisition of a smaller oscillator manufacturer by Abracon.
- 2023: Launch of a high-precision oscillator by IQD Frequency Products.
- 2024: Industry-wide initiative to improve supply chain resilience.
In-Depth Standard Oscillator Market Outlook
The Standard Oscillator market is poised for continued growth, driven by technological advancements, expanding applications, and increased demand from various sectors. Strategic investments in R&D, coupled with strategic partnerships, will play a crucial role in shaping the future landscape of this dynamic market. The long-term outlook remains positive, with significant opportunities for both established and emerging players.
Standard Oscillator Segmentation
-
1. Application
- 1.1. Consumer Electronics
- 1.2. Household Appliances
- 1.3. Vehicle Electronics
- 1.4. Other
-
2. Types
- 2.1. Below 50MHz
- 2.2. 50-100MHz
- 2.3. 100-500MHz
- 2.4. Above 500MHz
Standard Oscillator Segmentation By Geography
-
1. North America
- 1.1. United States
- 1.2. Canada
- 1.3. Mexico
-
2. South America
- 2.1. Brazil
- 2.2. Argentina
- 2.3. Rest of South America
-
3. Europe
- 3.1. United Kingdom
- 3.2. Germany
- 3.3. France
- 3.4. Italy
- 3.5. Spain
- 3.6. Russia
- 3.7. Benelux
- 3.8. Nordics
- 3.9. Rest of Europe
-
4. Middle East & Africa
- 4.1. Turkey
- 4.2. Israel
- 4.3. GCC
- 4.4. North Africa
- 4.5. South Africa
- 4.6. Rest of Middle East & Africa
-
5. Asia Pacific
- 5.1. China
- 5.2. India
- 5.3. Japan
- 5.4. South Korea
- 5.5. ASEAN
- 5.6. Oceania
- 5.7. Rest of Asia Pacific
Standard Oscillator REPORT HIGHLIGHTS
| Aspects | Details |
|---|---|
| Study Period | 2019-2033 |
| Base Year | 2024 |
| Estimated Year | 2025 |
| Forecast Period | 2025-2033 |
| Historical Period | 2019-2024 |
| Growth Rate | CAGR of XX% from 2019-2033 |
| Segmentation |
|
Table of Contents
- 1. Introduction
- 1.1. Research Scope
- 1.2. Market Segmentation
- 1.3. Research Methodology
- 1.4. Definitions and Assumptions
- 2. Executive Summary
- 2.1. Introduction
- 3. Market Dynamics
- 3.1. Introduction
- 3.2. Market Drivers
- 3.3. Market Restrains
- 3.4. Market Trends
- 4. Market Factor Analysis
- 4.1. Porters Five Forces
- 4.2. Supply/Value Chain
- 4.3. PESTEL analysis
- 4.4. Market Entropy
- 4.5. Patent/Trademark Analysis
- 5. Global Standard Oscillator Analysis, Insights and Forecast, 2019-2031
- 5.1. Market Analysis, Insights and Forecast - by Application
- 5.1.1. Consumer Electronics
- 5.1.2. Household Appliances
- 5.1.3. Vehicle Electronics
- 5.1.4. Other
- 5.2. Market Analysis, Insights and Forecast - by Types
- 5.2.1. Below 50MHz
- 5.2.2. 50-100MHz
- 5.2.3. 100-500MHz
- 5.2.4. Above 500MHz
- 5.3. Market Analysis, Insights and Forecast - by Region
- 5.3.1. North America
- 5.3.2. South America
- 5.3.3. Europe
- 5.3.4. Middle East & Africa
- 5.3.5. Asia Pacific
- 5.1. Market Analysis, Insights and Forecast - by Application
- 6. North America Standard Oscillator Analysis, Insights and Forecast, 2019-2031
- 6.1. Market Analysis, Insights and Forecast - by Application
- 6.1.1. Consumer Electronics
- 6.1.2. Household Appliances
- 6.1.3. Vehicle Electronics
- 6.1.4. Other
- 6.2. Market Analysis, Insights and Forecast - by Types
- 6.2.1. Below 50MHz
- 6.2.2. 50-100MHz
- 6.2.3. 100-500MHz
- 6.2.4. Above 500MHz
- 6.1. Market Analysis, Insights and Forecast - by Application
- 7. South America Standard Oscillator Analysis, Insights and Forecast, 2019-2031
- 7.1. Market Analysis, Insights and Forecast - by Application
- 7.1.1. Consumer Electronics
- 7.1.2. Household Appliances
- 7.1.3. Vehicle Electronics
- 7.1.4. Other
- 7.2. Market Analysis, Insights and Forecast - by Types
- 7.2.1. Below 50MHz
- 7.2.2. 50-100MHz
- 7.2.3. 100-500MHz
- 7.2.4. Above 500MHz
- 7.1. Market Analysis, Insights and Forecast - by Application
- 8. Europe Standard Oscillator Analysis, Insights and Forecast, 2019-2031
- 8.1. Market Analysis, Insights and Forecast - by Application
- 8.1.1. Consumer Electronics
- 8.1.2. Household Appliances
- 8.1.3. Vehicle Electronics
- 8.1.4. Other
- 8.2. Market Analysis, Insights and Forecast - by Types
- 8.2.1. Below 50MHz
- 8.2.2. 50-100MHz
- 8.2.3. 100-500MHz
- 8.2.4. Above 500MHz
- 8.1. Market Analysis, Insights and Forecast - by Application
- 9. Middle East & Africa Standard Oscillator Analysis, Insights and Forecast, 2019-2031
- 9.1. Market Analysis, Insights and Forecast - by Application
- 9.1.1. Consumer Electronics
- 9.1.2. Household Appliances
- 9.1.3. Vehicle Electronics
- 9.1.4. Other
- 9.2. Market Analysis, Insights and Forecast - by Types
- 9.2.1. Below 50MHz
- 9.2.2. 50-100MHz
- 9.2.3. 100-500MHz
- 9.2.4. Above 500MHz
- 9.1. Market Analysis, Insights and Forecast - by Application
- 10. Asia Pacific Standard Oscillator Analysis, Insights and Forecast, 2019-2031
- 10.1. Market Analysis, Insights and Forecast - by Application
- 10.1.1. Consumer Electronics
- 10.1.2. Household Appliances
- 10.1.3. Vehicle Electronics
- 10.1.4. Other
- 10.2. Market Analysis, Insights and Forecast - by Types
- 10.2.1. Below 50MHz
- 10.2.2. 50-100MHz
- 10.2.3. 100-500MHz
- 10.2.4. Above 500MHz
- 10.1. Market Analysis, Insights and Forecast - by Application
- 11. Competitive Analysis
- 11.1. Global Market Share Analysis 2024
- 11.2. Company Profiles
- 11.2.1 IQD Frequency Products
- 11.2.1.1. Overview
- 11.2.1.2. Products
- 11.2.1.3. SWOT Analysis
- 11.2.1.4. Recent Developments
- 11.2.1.5. Financials (Based on Availability)
- 11.2.2 Epson
- 11.2.2.1. Overview
- 11.2.2.2. Products
- 11.2.2.3. SWOT Analysis
- 11.2.2.4. Recent Developments
- 11.2.2.5. Financials (Based on Availability)
- 11.2.3 Silicon Labs
- 11.2.3.1. Overview
- 11.2.3.2. Products
- 11.2.3.3. SWOT Analysis
- 11.2.3.4. Recent Developments
- 11.2.3.5. Financials (Based on Availability)
- 11.2.4 Abracon
- 11.2.4.1. Overview
- 11.2.4.2. Products
- 11.2.4.3. SWOT Analysis
- 11.2.4.4. Recent Developments
- 11.2.4.5. Financials (Based on Availability)
- 11.2.5 Ael Crystals
- 11.2.5.1. Overview
- 11.2.5.2. Products
- 11.2.5.3. SWOT Analysis
- 11.2.5.4. Recent Developments
- 11.2.5.5. Financials (Based on Availability)
- 11.2.6 Aker
- 11.2.6.1. Overview
- 11.2.6.2. Products
- 11.2.6.3. SWOT Analysis
- 11.2.6.4. Recent Developments
- 11.2.6.5. Financials (Based on Availability)
- 11.2.7 Bliley Technologies
- 11.2.7.1. Overview
- 11.2.7.2. Products
- 11.2.7.3. SWOT Analysis
- 11.2.7.4. Recent Developments
- 11.2.7.5. Financials (Based on Availability)
- 11.2.8 Citizen Finedevice
- 11.2.8.1. Overview
- 11.2.8.2. Products
- 11.2.8.3. SWOT Analysis
- 11.2.8.4. Recent Developments
- 11.2.8.5. Financials (Based on Availability)
- 11.2.9 CTS
- 11.2.9.1. Overview
- 11.2.9.2. Products
- 11.2.9.3. SWOT Analysis
- 11.2.9.4. Recent Developments
- 11.2.9.5. Financials (Based on Availability)
- 11.2.10 Ecliptek
- 11.2.10.1. Overview
- 11.2.10.2. Products
- 11.2.10.3. SWOT Analysis
- 11.2.10.4. Recent Developments
- 11.2.10.5. Financials (Based on Availability)
- 11.2.11 ECS Inc International
- 11.2.11.1. Overview
- 11.2.11.2. Products
- 11.2.11.3. SWOT Analysis
- 11.2.11.4. Recent Developments
- 11.2.11.5. Financials (Based on Availability)
- 11.2.12 Euroquartz
- 11.2.12.1. Overview
- 11.2.12.2. Products
- 11.2.12.3. SWOT Analysis
- 11.2.12.4. Recent Developments
- 11.2.12.5. Financials (Based on Availability)
- 11.2.13 Fox Electronics
- 11.2.13.1. Overview
- 11.2.13.2. Products
- 11.2.13.3. SWOT Analysis
- 11.2.13.4. Recent Developments
- 11.2.13.5. Financials (Based on Availability)
- 11.2.14 Ilsi America
- 11.2.14.1. Overview
- 11.2.14.2. Products
- 11.2.14.3. SWOT Analysis
- 11.2.14.4. Recent Developments
- 11.2.14.5. Financials (Based on Availability)
- 11.2.15 Kyocera
- 11.2.15.1. Overview
- 11.2.15.2. Products
- 11.2.15.3. SWOT Analysis
- 11.2.15.4. Recent Developments
- 11.2.15.5. Financials (Based on Availability)
- 11.2.16 Mercury United Electronics
- 11.2.16.1. Overview
- 11.2.16.2. Products
- 11.2.16.3. SWOT Analysis
- 11.2.16.4. Recent Developments
- 11.2.16.5. Financials (Based on Availability)
- 11.2.17 Micro Crystal
- 11.2.17.1. Overview
- 11.2.17.2. Products
- 11.2.17.3. SWOT Analysis
- 11.2.17.4. Recent Developments
- 11.2.17.5. Financials (Based on Availability)
- 11.2.18 MMD
- 11.2.18.1. Overview
- 11.2.18.2. Products
- 11.2.18.3. SWOT Analysis
- 11.2.18.4. Recent Developments
- 11.2.18.5. Financials (Based on Availability)
- 11.2.19 Qantek Technology Corporation
- 11.2.19.1. Overview
- 11.2.19.2. Products
- 11.2.19.3. SWOT Analysis
- 11.2.19.4. Recent Developments
- 11.2.19.5. Financials (Based on Availability)
- 11.2.20 Raltron
- 11.2.20.1. Overview
- 11.2.20.2. Products
- 11.2.20.3. SWOT Analysis
- 11.2.20.4. Recent Developments
- 11.2.20.5. Financials (Based on Availability)
- 11.2.21 Renesas
- 11.2.21.1. Overview
- 11.2.21.2. Products
- 11.2.21.3. SWOT Analysis
- 11.2.21.4. Recent Developments
- 11.2.21.5. Financials (Based on Availability)
- 11.2.22 Sitime
- 11.2.22.1. Overview
- 11.2.22.2. Products
- 11.2.22.3. SWOT Analysis
- 11.2.22.4. Recent Developments
- 11.2.22.5. Financials (Based on Availability)
- 11.2.23 TXC
- 11.2.23.1. Overview
- 11.2.23.2. Products
- 11.2.23.3. SWOT Analysis
- 11.2.23.4. Recent Developments
- 11.2.23.5. Financials (Based on Availability)
- 11.2.24 Vishay
- 11.2.24.1. Overview
- 11.2.24.2. Products
- 11.2.24.3. SWOT Analysis
- 11.2.24.4. Recent Developments
- 11.2.24.5. Financials (Based on Availability)
- 11.2.1 IQD Frequency Products
List of Figures
- Figure 1: Global Standard Oscillator Revenue Breakdown (million, %) by Region 2024 & 2032
- Figure 2: Global Standard Oscillator Volume Breakdown (K, %) by Region 2024 & 2032
- Figure 3: North America Standard Oscillator Revenue (million), by Application 2024 & 2032
- Figure 4: North America Standard Oscillator Volume (K), by Application 2024 & 2032
- Figure 5: North America Standard Oscillator Revenue Share (%), by Application 2024 & 2032
- Figure 6: North America Standard Oscillator Volume Share (%), by Application 2024 & 2032
- Figure 7: North America Standard Oscillator Revenue (million), by Types 2024 & 2032
- Figure 8: North America Standard Oscillator Volume (K), by Types 2024 & 2032
- Figure 9: North America Standard Oscillator Revenue Share (%), by Types 2024 & 2032
- Figure 10: North America Standard Oscillator Volume Share (%), by Types 2024 & 2032
- Figure 11: North America Standard Oscillator Revenue (million), by Country 2024 & 2032
- Figure 12: North America Standard Oscillator Volume (K), by Country 2024 & 2032
- Figure 13: North America Standard Oscillator Revenue Share (%), by Country 2024 & 2032
- Figure 14: North America Standard Oscillator Volume Share (%), by Country 2024 & 2032
- Figure 15: South America Standard Oscillator Revenue (million), by Application 2024 & 2032
- Figure 16: South America Standard Oscillator Volume (K), by Application 2024 & 2032
- Figure 17: South America Standard Oscillator Revenue Share (%), by Application 2024 & 2032
- Figure 18: South America Standard Oscillator Volume Share (%), by Application 2024 & 2032
- Figure 19: South America Standard Oscillator Revenue (million), by Types 2024 & 2032
- Figure 20: South America Standard Oscillator Volume (K), by Types 2024 & 2032
- Figure 21: South America Standard Oscillator Revenue Share (%), by Types 2024 & 2032
- Figure 22: South America Standard Oscillator Volume Share (%), by Types 2024 & 2032
- Figure 23: South America Standard Oscillator Revenue (million), by Country 2024 & 2032
- Figure 24: South America Standard Oscillator Volume (K), by Country 2024 & 2032
- Figure 25: South America Standard Oscillator Revenue Share (%), by Country 2024 & 2032
- Figure 26: South America Standard Oscillator Volume Share (%), by Country 2024 & 2032
- Figure 27: Europe Standard Oscillator Revenue (million), by Application 2024 & 2032
- Figure 28: Europe Standard Oscillator Volume (K), by Application 2024 & 2032
- Figure 29: Europe Standard Oscillator Revenue Share (%), by Application 2024 & 2032
- Figure 30: Europe Standard Oscillator Volume Share (%), by Application 2024 & 2032
- Figure 31: Europe Standard Oscillator Revenue (million), by Types 2024 & 2032
- Figure 32: Europe Standard Oscillator Volume (K), by Types 2024 & 2032
- Figure 33: Europe Standard Oscillator Revenue Share (%), by Types 2024 & 2032
- Figure 34: Europe Standard Oscillator Volume Share (%), by Types 2024 & 2032
- Figure 35: Europe Standard Oscillator Revenue (million), by Country 2024 & 2032
- Figure 36: Europe Standard Oscillator Volume (K), by Country 2024 & 2032
- Figure 37: Europe Standard Oscillator Revenue Share (%), by Country 2024 & 2032
- Figure 38: Europe Standard Oscillator Volume Share (%), by Country 2024 & 2032
- Figure 39: Middle East & Africa Standard Oscillator Revenue (million), by Application 2024 & 2032
- Figure 40: Middle East & Africa Standard Oscillator Volume (K), by Application 2024 & 2032
- Figure 41: Middle East & Africa Standard Oscillator Revenue Share (%), by Application 2024 & 2032
- Figure 42: Middle East & Africa Standard Oscillator Volume Share (%), by Application 2024 & 2032
- Figure 43: Middle East & Africa Standard Oscillator Revenue (million), by Types 2024 & 2032
- Figure 44: Middle East & Africa Standard Oscillator Volume (K), by Types 2024 & 2032
- Figure 45: Middle East & Africa Standard Oscillator Revenue Share (%), by Types 2024 & 2032
- Figure 46: Middle East & Africa Standard Oscillator Volume Share (%), by Types 2024 & 2032
- Figure 47: Middle East & Africa Standard Oscillator Revenue (million), by Country 2024 & 2032
- Figure 48: Middle East & Africa Standard Oscillator Volume (K), by Country 2024 & 2032
- Figure 49: Middle East & Africa Standard Oscillator Revenue Share (%), by Country 2024 & 2032
- Figure 50: Middle East & Africa Standard Oscillator Volume Share (%), by Country 2024 & 2032
- Figure 51: Asia Pacific Standard Oscillator Revenue (million), by Application 2024 & 2032
- Figure 52: Asia Pacific Standard Oscillator Volume (K), by Application 2024 & 2032
- Figure 53: Asia Pacific Standard Oscillator Revenue Share (%), by Application 2024 & 2032
- Figure 54: Asia Pacific Standard Oscillator Volume Share (%), by Application 2024 & 2032
- Figure 55: Asia Pacific Standard Oscillator Revenue (million), by Types 2024 & 2032
- Figure 56: Asia Pacific Standard Oscillator Volume (K), by Types 2024 & 2032
- Figure 57: Asia Pacific Standard Oscillator Revenue Share (%), by Types 2024 & 2032
- Figure 58: Asia Pacific Standard Oscillator Volume Share (%), by Types 2024 & 2032
- Figure 59: Asia Pacific Standard Oscillator Revenue (million), by Country 2024 & 2032
- Figure 60: Asia Pacific Standard Oscillator Volume (K), by Country 2024 & 2032
- Figure 61: Asia Pacific Standard Oscillator Revenue Share (%), by Country 2024 & 2032
- Figure 62: Asia Pacific Standard Oscillator Volume Share (%), by Country 2024 & 2032
List of Tables
- Table 1: Global Standard Oscillator Revenue million Forecast, by Region 2019 & 2032
- Table 2: Global Standard Oscillator Volume K Forecast, by Region 2019 & 2032
- Table 3: Global Standard Oscillator Revenue million Forecast, by Application 2019 & 2032
- Table 4: Global Standard Oscillator Volume K Forecast, by Application 2019 & 2032
- Table 5: Global Standard Oscillator Revenue million Forecast, by Types 2019 & 2032
- Table 6: Global Standard Oscillator Volume K Forecast, by Types 2019 & 2032
- Table 7: Global Standard Oscillator Revenue million Forecast, by Region 2019 & 2032
- Table 8: Global Standard Oscillator Volume K Forecast, by Region 2019 & 2032
- Table 9: Global Standard Oscillator Revenue million Forecast, by Application 2019 & 2032
- Table 10: Global Standard Oscillator Volume K Forecast, by Application 2019 & 2032
- Table 11: Global Standard Oscillator Revenue million Forecast, by Types 2019 & 2032
- Table 12: Global Standard Oscillator Volume K Forecast, by Types 2019 & 2032
- Table 13: Global Standard Oscillator Revenue million Forecast, by Country 2019 & 2032
- Table 14: Global Standard Oscillator Volume K Forecast, by Country 2019 & 2032
- Table 15: United States Standard Oscillator Revenue (million) Forecast, by Application 2019 & 2032
- Table 16: United States Standard Oscillator Volume (K) Forecast, by Application 2019 & 2032
- Table 17: Canada Standard Oscillator Revenue (million) Forecast, by Application 2019 & 2032
- Table 18: Canada Standard Oscillator Volume (K) Forecast, by Application 2019 & 2032
- Table 19: Mexico Standard Oscillator Revenue (million) Forecast, by Application 2019 & 2032
- Table 20: Mexico Standard Oscillator Volume (K) Forecast, by Application 2019 & 2032
- Table 21: Global Standard Oscillator Revenue million Forecast, by Application 2019 & 2032
- Table 22: Global Standard Oscillator Volume K Forecast, by Application 2019 & 2032
- Table 23: Global Standard Oscillator Revenue million Forecast, by Types 2019 & 2032
- Table 24: Global Standard Oscillator Volume K Forecast, by Types 2019 & 2032
- Table 25: Global Standard Oscillator Revenue million Forecast, by Country 2019 & 2032
- Table 26: Global Standard Oscillator Volume K Forecast, by Country 2019 & 2032
- Table 27: Brazil Standard Oscillator Revenue (million) Forecast, by Application 2019 & 2032
- Table 28: Brazil Standard Oscillator Volume (K) Forecast, by Application 2019 & 2032
- Table 29: Argentina Standard Oscillator Revenue (million) Forecast, by Application 2019 & 2032
- Table 30: Argentina Standard Oscillator Volume (K) Forecast, by Application 2019 & 2032
- Table 31: Rest of South America Standard Oscillator Revenue (million) Forecast, by Application 2019 & 2032
- Table 32: Rest of South America Standard Oscillator Volume (K) Forecast, by Application 2019 & 2032
- Table 33: Global Standard Oscillator Revenue million Forecast, by Application 2019 & 2032
- Table 34: Global Standard Oscillator Volume K Forecast, by Application 2019 & 2032
- Table 35: Global Standard Oscillator Revenue million Forecast, by Types 2019 & 2032
- Table 36: Global Standard Oscillator Volume K Forecast, by Types 2019 & 2032
- Table 37: Global Standard Oscillator Revenue million Forecast, by Country 2019 & 2032
- Table 38: Global Standard Oscillator Volume K Forecast, by Country 2019 & 2032
- Table 39: United Kingdom Standard Oscillator Revenue (million) Forecast, by Application 2019 & 2032
- Table 40: United Kingdom Standard Oscillator Volume (K) Forecast, by Application 2019 & 2032
- Table 41: Germany Standard Oscillator Revenue (million) Forecast, by Application 2019 & 2032
- Table 42: Germany Standard Oscillator Volume (K) Forecast, by Application 2019 & 2032
- Table 43: France Standard Oscillator Revenue (million) Forecast, by Application 2019 & 2032
- Table 44: France Standard Oscillator Volume (K) Forecast, by Application 2019 & 2032
- Table 45: Italy Standard Oscillator Revenue (million) Forecast, by Application 2019 & 2032
- Table 46: Italy Standard Oscillator Volume (K) Forecast, by Application 2019 & 2032
- Table 47: Spain Standard Oscillator Revenue (million) Forecast, by Application 2019 & 2032
- Table 48: Spain Standard Oscillator Volume (K) Forecast, by Application 2019 & 2032
- Table 49: Russia Standard Oscillator Revenue (million) Forecast, by Application 2019 & 2032
- Table 50: Russia Standard Oscillator Volume (K) Forecast, by Application 2019 & 2032
- Table 51: Benelux Standard Oscillator Revenue (million) Forecast, by Application 2019 & 2032
- Table 52: Benelux Standard Oscillator Volume (K) Forecast, by Application 2019 & 2032
- Table 53: Nordics Standard Oscillator Revenue (million) Forecast, by Application 2019 & 2032
- Table 54: Nordics Standard Oscillator Volume (K) Forecast, by Application 2019 & 2032
- Table 55: Rest of Europe Standard Oscillator Revenue (million) Forecast, by Application 2019 & 2032
- Table 56: Rest of Europe Standard Oscillator Volume (K) Forecast, by Application 2019 & 2032
- Table 57: Global Standard Oscillator Revenue million Forecast, by Application 2019 & 2032
- Table 58: Global Standard Oscillator Volume K Forecast, by Application 2019 & 2032
- Table 59: Global Standard Oscillator Revenue million Forecast, by Types 2019 & 2032
- Table 60: Global Standard Oscillator Volume K Forecast, by Types 2019 & 2032
- Table 61: Global Standard Oscillator Revenue million Forecast, by Country 2019 & 2032
- Table 62: Global Standard Oscillator Volume K Forecast, by Country 2019 & 2032
- Table 63: Turkey Standard Oscillator Revenue (million) Forecast, by Application 2019 & 2032
- Table 64: Turkey Standard Oscillator Volume (K) Forecast, by Application 2019 & 2032
- Table 65: Israel Standard Oscillator Revenue (million) Forecast, by Application 2019 & 2032
- Table 66: Israel Standard Oscillator Volume (K) Forecast, by Application 2019 & 2032
- Table 67: GCC Standard Oscillator Revenue (million) Forecast, by Application 2019 & 2032
- Table 68: GCC Standard Oscillator Volume (K) Forecast, by Application 2019 & 2032
- Table 69: North Africa Standard Oscillator Revenue (million) Forecast, by Application 2019 & 2032
- Table 70: North Africa Standard Oscillator Volume (K) Forecast, by Application 2019 & 2032
- Table 71: South Africa Standard Oscillator Revenue (million) Forecast, by Application 2019 & 2032
- Table 72: South Africa Standard Oscillator Volume (K) Forecast, by Application 2019 & 2032
- Table 73: Rest of Middle East & Africa Standard Oscillator Revenue (million) Forecast, by Application 2019 & 2032
- Table 74: Rest of Middle East & Africa Standard Oscillator Volume (K) Forecast, by Application 2019 & 2032
- Table 75: Global Standard Oscillator Revenue million Forecast, by Application 2019 & 2032
- Table 76: Global Standard Oscillator Volume K Forecast, by Application 2019 & 2032
- Table 77: Global Standard Oscillator Revenue million Forecast, by Types 2019 & 2032
- Table 78: Global Standard Oscillator Volume K Forecast, by Types 2019 & 2032
- Table 79: Global Standard Oscillator Revenue million Forecast, by Country 2019 & 2032
- Table 80: Global Standard Oscillator Volume K Forecast, by Country 2019 & 2032
- Table 81: China Standard Oscillator Revenue (million) Forecast, by Application 2019 & 2032
- Table 82: China Standard Oscillator Volume (K) Forecast, by Application 2019 & 2032
- Table 83: India Standard Oscillator Revenue (million) Forecast, by Application 2019 & 2032
- Table 84: India Standard Oscillator Volume (K) Forecast, by Application 2019 & 2032
- Table 85: Japan Standard Oscillator Revenue (million) Forecast, by Application 2019 & 2032
- Table 86: Japan Standard Oscillator Volume (K) Forecast, by Application 2019 & 2032
- Table 87: South Korea Standard Oscillator Revenue (million) Forecast, by Application 2019 & 2032
- Table 88: South Korea Standard Oscillator Volume (K) Forecast, by Application 2019 & 2032
- Table 89: ASEAN Standard Oscillator Revenue (million) Forecast, by Application 2019 & 2032
- Table 90: ASEAN Standard Oscillator Volume (K) Forecast, by Application 2019 & 2032
- Table 91: Oceania Standard Oscillator Revenue (million) Forecast, by Application 2019 & 2032
- Table 92: Oceania Standard Oscillator Volume (K) Forecast, by Application 2019 & 2032
- Table 93: Rest of Asia Pacific Standard Oscillator Revenue (million) Forecast, by Application 2019 & 2032
- Table 94: Rest of Asia Pacific Standard Oscillator Volume (K) Forecast, by Application 2019 & 2032
Frequently Asked Questions
1. What is the projected Compound Annual Growth Rate (CAGR) of the Standard Oscillator?
The projected CAGR is approximately XX%.
2. Which companies are prominent players in the Standard Oscillator?
Key companies in the market include IQD Frequency Products, Epson, Silicon Labs, Abracon, Ael Crystals, Aker, Bliley Technologies, Citizen Finedevice, CTS, Ecliptek, ECS Inc International, Euroquartz, Fox Electronics, Ilsi America, Kyocera, Mercury United Electronics, Micro Crystal, MMD, Qantek Technology Corporation, Raltron, Renesas, Sitime, TXC, Vishay.
3. What are the main segments of the Standard Oscillator?
The market segments include Application, Types.
4. Can you provide details about the market size?
The market size is estimated to be USD XXX million as of 2022.
5. What are some drivers contributing to market growth?
N/A
6. What are the notable trends driving market growth?
N/A
7. Are there any restraints impacting market growth?
N/A
8. Can you provide examples of recent developments in the market?
N/A
9. What pricing options are available for accessing the report?
Pricing options include single-user, multi-user, and enterprise licenses priced at USD 3350.00, USD 5025.00, and USD 6700.00 respectively.
10. Is the market size provided in terms of value or volume?
The market size is provided in terms of value, measured in million and volume, measured in K.
11. Are there any specific market keywords associated with the report?
Yes, the market keyword associated with the report is "Standard Oscillator," which aids in identifying and referencing the specific market segment covered.
12. How do I determine which pricing option suits my needs best?
The pricing options vary based on user requirements and access needs. Individual users may opt for single-user licenses, while businesses requiring broader access may choose multi-user or enterprise licenses for cost-effective access to the report.
13. Are there any additional resources or data provided in the Standard Oscillator report?
While the report offers comprehensive insights, it's advisable to review the specific contents or supplementary materials provided to ascertain if additional resources or data are available.
14. How can I stay updated on further developments or reports in the Standard Oscillator?
To stay informed about further developments, trends, and reports in the Standard Oscillator, consider subscribing to industry newsletters, following relevant companies and organizations, or regularly checking reputable industry news sources and publications.
Methodology
Step 1 - Identification of Relevant Samples Size from Population Database


Step 2 - Approaches for Defining Global Market Size (Value, Volume* & Price*)

Note*: In applicable scenarios
Step 3 - Data Sources
Primary Research
- Web Analytics
- Survey Reports
- Research Institute
- Latest Research Reports
- Opinion Leaders
Secondary Research
- Annual Reports
- White Paper
- Latest Press Release
- Industry Association
- Paid Database
- Investor Presentations

Step 4 - Data Triangulation
Involves using different sources of information in order to increase the validity of a study
These sources are likely to be stakeholders in a program - participants, other researchers, program staff, other community members, and so on.
Then we put all data in single framework & apply various statistical tools to find out the dynamic on the market.
During the analysis stage, feedback from the stakeholder groups would be compared to determine areas of agreement as well as areas of divergence
