

Key Insights
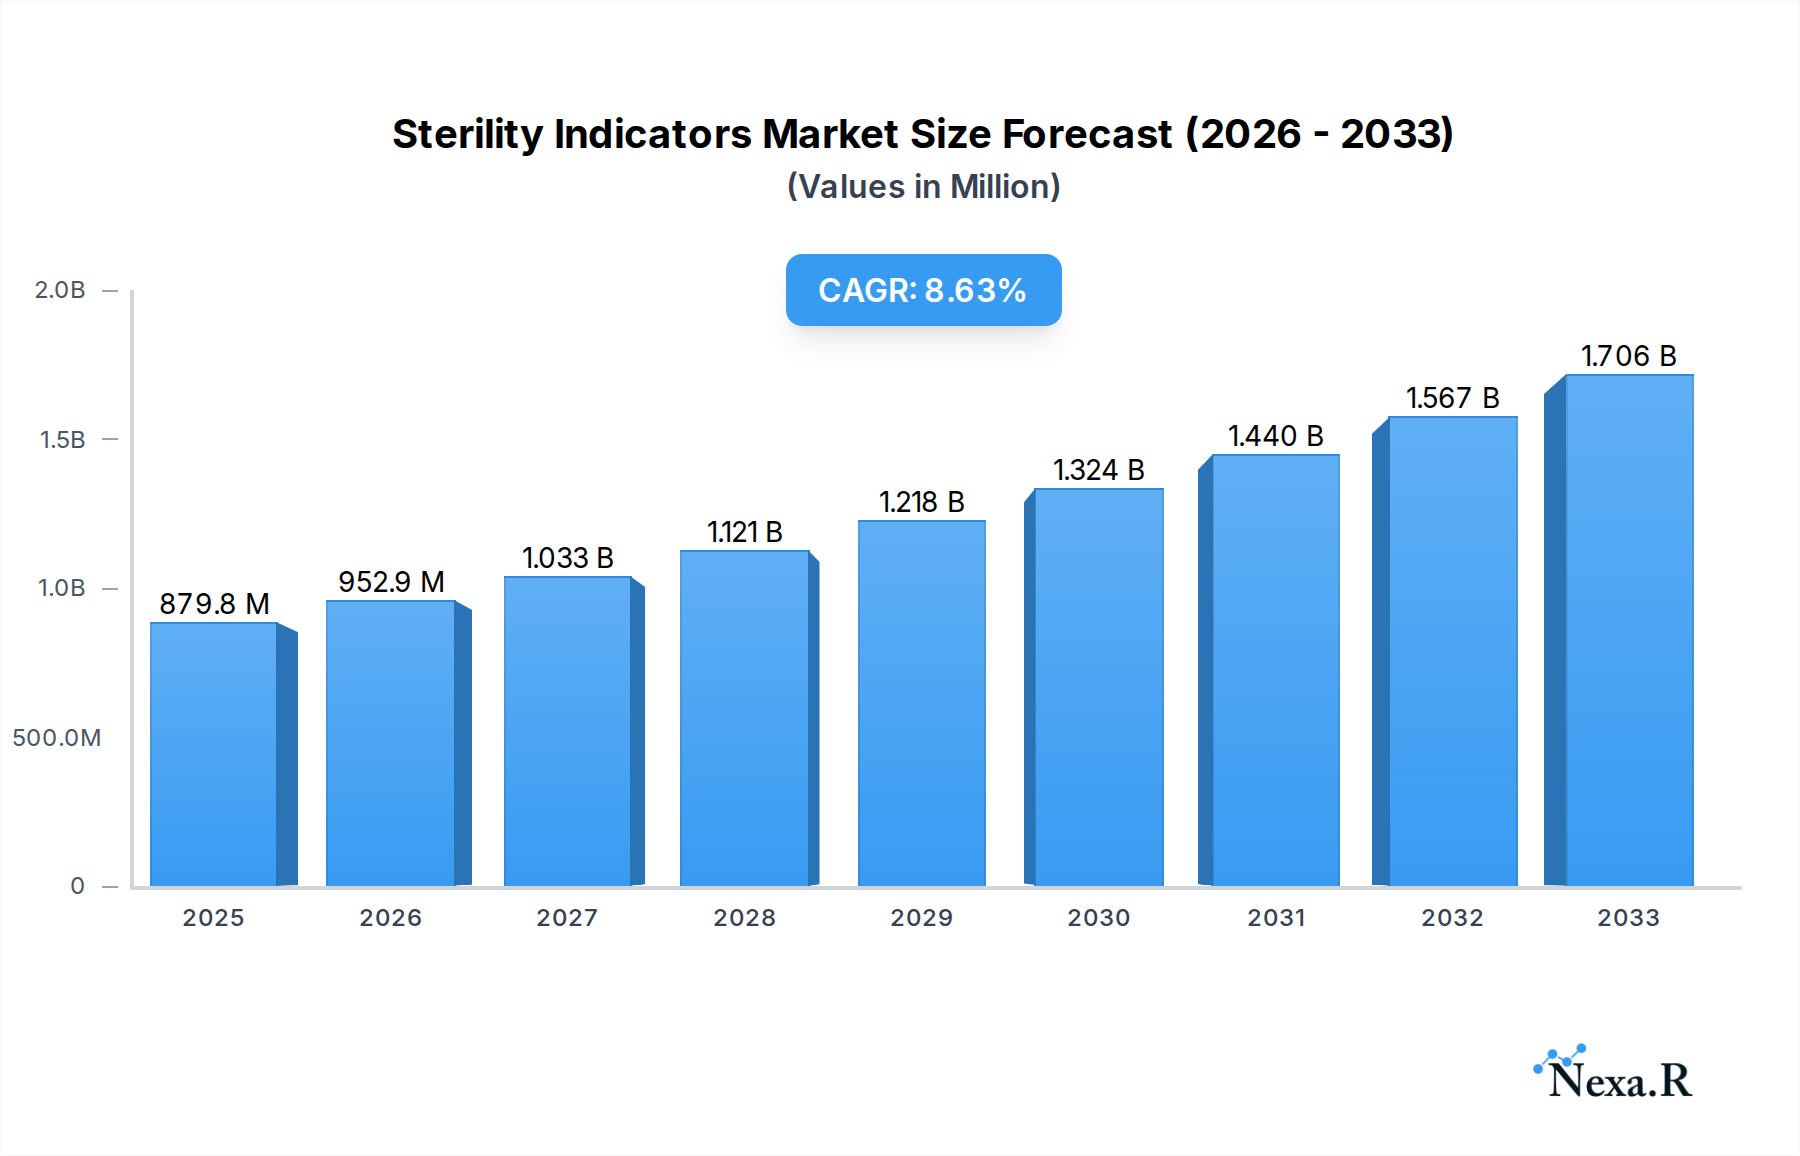
The global Sterility Indicators market is poised for robust expansion, projected to reach $879.8 million by 2025, with a compelling Compound Annual Growth Rate (CAGR) of 8.3% from 2025 to 2033. This significant growth is primarily fueled by the escalating demand for stringent infection control measures across healthcare settings, driven by increasing surgical procedures, the prevalence of hospital-acquired infections (HAIs), and the growing global healthcare expenditure. Pharmaceutical companies are also a key driver, emphasizing product integrity and patient safety through rigorous sterilization validation processes. Furthermore, the expanding medical device industry, coupled with a heightened focus on the efficacy of sterilization processes for reusable medical instruments, will continue to bolster market demand. Technological advancements in indicator design, offering enhanced accuracy, faster results, and user-friendliness, are also contributing to market momentum.

Sterility Indicators Market Size (In Million)
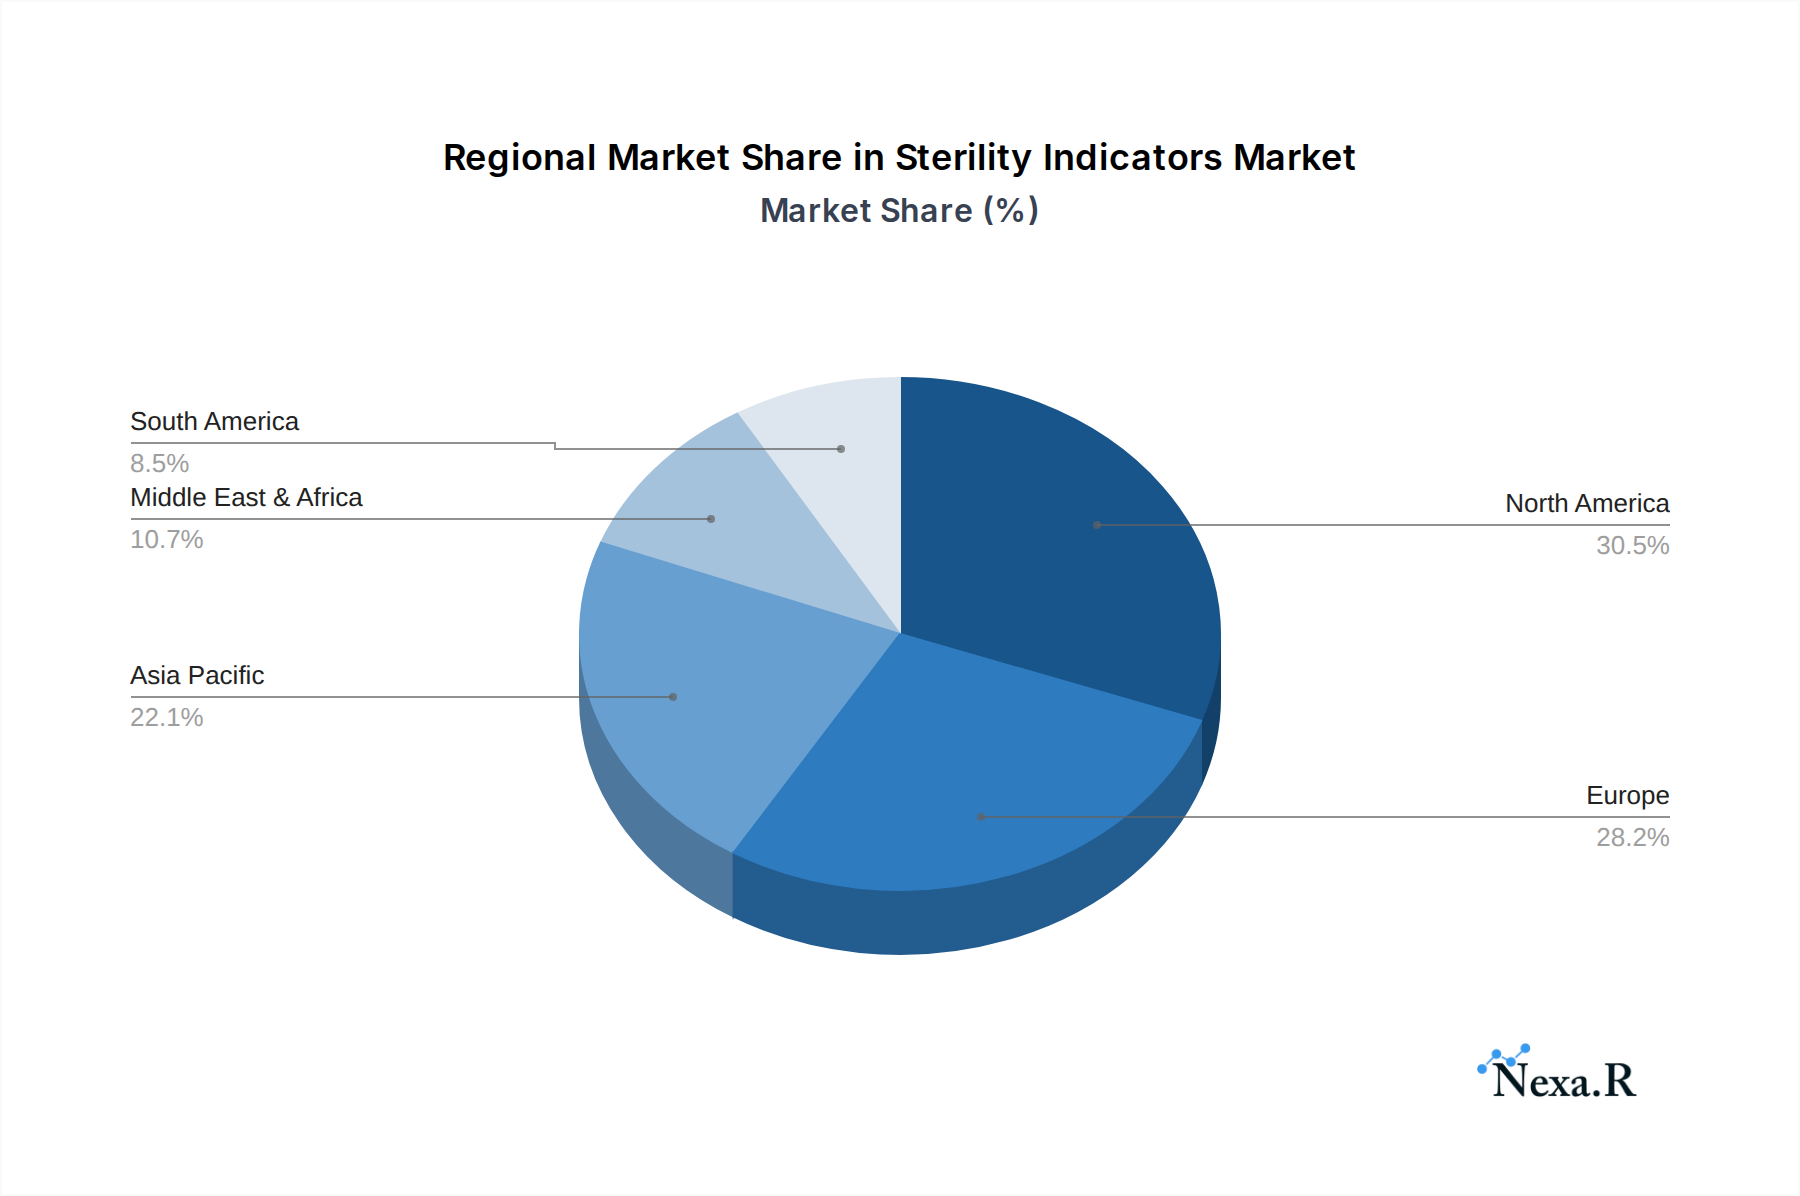
The market is segmented by application into Hospitals, Pharmaceutical Companies, Medical Device Companies, and Clinical Laboratories, with Hospitals anticipated to hold a dominant share due to their extensive use of sterilization processes. By type, Chemical Indicators and Biological Indicators are the primary segments, each catering to different levels of sterilization assurance. Geographically, North America and Europe are expected to lead the market, owing to well-established healthcare infrastructure and stringent regulatory frameworks. However, the Asia Pacific region presents a substantial growth opportunity, driven by rapid healthcare modernization, increasing awareness about infection control, and a burgeoning pharmaceutical and medical device manufacturing sector. Restraints, such as the cost of advanced indicators and potential regulatory hurdles in emerging economies, are present but are likely to be mitigated by the overwhelming need for effective sterilization.
Sterility Indicators Company Market Share
Sterility Indicators Market: Comprehensive Analysis and Future Outlook (2019-2033)
This in-depth report provides a panoramic view of the global Sterility Indicators Market, a critical segment within the healthcare and life sciences industries. Covering the historical period from 2019 to 2024, with a base and estimated year of 2025, and projecting growth through 2033, this analysis offers unparalleled insights into market dynamics, growth trends, regional dominance, product landscape, key drivers, challenges, opportunities, and the competitive environment. We leverage detailed quantitative data and qualitative analysis to equip industry professionals, investors, and stakeholders with actionable intelligence for strategic decision-making. The report is structured to provide clear, concise, and impactful information, focusing on high-traffic keywords and essential market segments.
Sterility Indicators Market Dynamics & Structure
The global Sterility Indicators Market is characterized by a moderately concentrated structure, with leading players like 3M Company, Cantel Medical Corporation, and Getinge AB holding significant shares. Technological innovation remains a primary driver, particularly in the development of more sensitive and faster-acting indicators for various sterilization methods. Stringent regulatory frameworks, including FDA guidelines and ISO standards, significantly influence product development and market entry, ensuring patient safety and efficacy. While competitive product substitutes exist, such as advanced sterilization technologies themselves, the intrinsic need for validation through reliable indicators maintains market resilience. End-user demographics are increasingly sophisticated, with a growing demand for integrated solutions and digital tracking capabilities. Mergers and Acquisitions (M&A) activity, while not consistently high, plays a role in market consolidation and expansion, with deal volumes fluctuating based on strategic objectives. Barriers to innovation include the lengthy validation processes required for regulatory approval and the high cost of research and development for novel indicator technologies. The market is projected to witness a steady increase in demand, driven by expanding healthcare infrastructure and the growing emphasis on infection control protocols worldwide.
- Market Concentration: Moderately concentrated, with key players dominating market share.
- Technological Innovation: Driven by advancements in sensitivity, speed, and digital integration.
- Regulatory Frameworks: Stringent FDA and ISO standards are critical for market access.
- Competitive Substitutes: Advanced sterilization technologies can impact demand for certain indicator types.
- End-User Demographics: Increasing demand for integrated solutions and data management.
- M&A Trends: Strategic acquisitions to enhance product portfolios and market reach.
- Innovation Barriers: High R&D costs and lengthy regulatory validation cycles.
Sterility Indicators Growth Trends & Insights
The Sterility Indicators Market is poised for robust growth, driven by an escalating global focus on infection prevention and control in healthcare settings. The market size evolution is a testament to the increasing adoption rates of both Chemical Indicators and Biological Indicators across hospitals, pharmaceutical companies, and medical device manufacturers. Technological disruptions, such as the integration of RFID and IoT capabilities into indicator systems, are enhancing traceability and data management, leading to greater efficiency in sterilization validation. Consumer behavior shifts are also playing a pivotal role; healthcare providers are demanding more user-friendly, cost-effective, and reliable solutions to meet evolving patient safety standards and regulatory mandates. The CAGR for the global sterility indicators market is projected to be a significant XX% from 2025 to 2033. This growth trajectory is further supported by increasing investments in healthcare infrastructure in emerging economies, which are rapidly adopting advanced sterilization practices. The penetration of advanced Biological Indicators, offering definitive proof of sterilization efficacy, is expected to rise, especially in critical applications within pharmaceutical manufacturing and complex medical device sterilization. Furthermore, the growing complexity of medical procedures and the rise of antibiotic-resistant bacteria are amplifying the need for foolproof sterilization validation, directly fueling market expansion. The demand for single-use and disposable sterility indicators is also on the rise, driven by convenience and the desire to minimize cross-contamination risks. The market’s growth is intrinsically linked to the overall expansion of the healthcare sector and the continuous drive for enhanced patient safety.
Dominant Regions, Countries, or Segments in Sterility Indicators
The Sterility Indicators Market is witnessing significant growth across various applications and types, with Hospitals and Pharmaceutical Companies emerging as dominant segments. Geographically, North America, particularly the United States, holds a commanding position due to its advanced healthcare infrastructure, stringent regulatory oversight by the FDA, and a high prevalence of hospital-acquired infections that necessitate rigorous sterilization protocols. Europe follows closely, driven by similar factors and strong adherence to ISO standards. The growth in these developed regions is underpinned by consistent technological adoption and a mature market for both Chemical Indicators and Biological Indicators.
In terms of applications, Hospitals represent the largest market share, as they are the primary point of care and handle a vast array of surgical instruments, medical devices, and linens requiring sterilization. The sheer volume of sterilization cycles performed daily in hospitals makes them a perpetual demand driver. Pharmaceutical Companies constitute another significant and rapidly growing segment. The stringent regulatory requirements for sterile drug manufacturing, particularly for injectables and biologics, mandate the use of high-level sterility indicators, including advanced Biological Indicators, to ensure product safety and efficacy. The growth potential in this segment is immense, fueled by the expanding biopharmaceutical sector and the increasing demand for sterile pharmaceutical products globally.
Medical Device Companies are also crucial end-users, ensuring that their products meet sterilization standards before distribution. The complexity and variety of medical devices necessitate a wide range of sterility indicator solutions. While Clinical Laboratories utilize sterility indicators for their own internal processes, their market share is comparatively smaller than hospitals and pharmaceutical giants. Emerging economies in Asia Pacific and Latin America are demonstrating considerable growth potential, driven by increasing healthcare expenditure, expanding medical infrastructure, and a rising awareness of infection control. Economic policies supporting healthcare development and infrastructure investments in these regions are acting as key growth drivers. The adoption of advanced sterilization technologies and the corresponding need for reliable Sterility Indicators are on an upward trajectory, making these regions future growth hotspots.
- Dominant Segments (Application):
- Hospitals (Largest Market Share)
- Pharmaceutical Companies (Rapidly Growing)
- Dominant Segments (Type):
- Chemical Indicators (High Volume Usage)
- Biological Indicators (Increasing Adoption for Definitive Proof)
- Leading Regions:
- North America (US)
- Europe
- Key Drivers:
- Advanced Healthcare Infrastructure
- Stringent Regulatory Frameworks (FDA, ISO)
- High Prevalence of Healthcare-Associated Infections
- Expanding Biopharmaceutical Sector
- Increasing Healthcare Expenditure in Emerging Economies
Sterility Indicators Product Landscape
The Sterility Indicators Market offers a diverse product landscape designed to validate the efficacy of various sterilization methods, including autoclaving, ethylene oxide (EtO), and low-temperature sterilization. Chemical Indicators (CIs) are widely adopted for their cost-effectiveness and rapid visual feedback, indicating exposure to sterilizing conditions. These range from Type 1 (process indicators) to Type 6 (emulating indicators) offering different levels of assurance. Biological Indicators (BIs), on the other hand, provide the highest level of assurance by using highly resistant microorganisms to demonstrate sterilization effectiveness. Innovations in this area include faster-readout BIs, integrated BI systems with automated readers, and self-contained BIs that minimize contamination risk during testing. Emerging product developments focus on enhanced sensitivity, improved shelf-life, compliance with evolving international standards (e.g., ISO 11138 series), and integration with digital tracking and traceability systems for robust record-keeping and compliance. The unique selling proposition for advanced sterility indicators lies in their reliability, accuracy, and ability to streamline sterilization validation processes, thereby enhancing patient safety and operational efficiency.
Key Drivers, Barriers & Challenges in Sterility Indicators
Key Drivers:
The Sterility Indicators Market is propelled by several key drivers. The increasing global emphasis on patient safety and the reduction of healthcare-associated infections (HAIs) is paramount. Stringent regulatory requirements from bodies like the FDA and adherence to ISO standards necessitate the consistent use of reliable sterility indicators. Advancements in sterilization technologies themselves, such as complex medical devices and pharmaceuticals, create a demand for more sophisticated and validated sterilization processes, thus driving indicator innovation. The growing volume of surgical procedures worldwide and the expansion of healthcare facilities, particularly in emerging economies, further fuel market demand. Technological innovations in indicator design, including faster readouts and digital integration, enhance user convenience and data management.
Barriers & Challenges:
Despite robust growth, the market faces several challenges. The cost of advanced Biological Indicators can be prohibitive for smaller healthcare facilities, creating a cost barrier to entry. Regulatory hurdles, including the extensive validation processes required for new indicator technologies, can be time-consuming and expensive. Supply chain disruptions, particularly for critical raw materials or components, can impact product availability and lead times. Intense competition among established players and emerging market entrants can lead to price pressures. The need for specialized training and infrastructure to effectively utilize and interpret certain types of sterility indicators can also pose a challenge for some end-users. Furthermore, the ongoing shift towards advanced sterilization methods may necessitate the discontinuation or adaptation of older indicator technologies.
Emerging Opportunities in Sterility Indicators
Emerging opportunities in the Sterility Indicators Market are concentrated in several key areas. The increasing demand for smart and connected sterility indicators that integrate with digital tracking and data analytics platforms presents a significant growth avenue. These systems offer enhanced traceability, compliance reporting, and real-time monitoring of sterilization cycles. The expansion of healthcare services in underserved and emerging economies offers untapped market potential, requiring the development of more affordable and user-friendly sterility indicator solutions. Innovations in Biological Indicators offering faster turnaround times without compromising accuracy are highly sought after, especially in time-sensitive pharmaceutical manufacturing environments. Furthermore, the growing complexity of biologics and advanced medical implants requires the development of specialized sterility indicators capable of validating novel sterilization methods. The increasing focus on sustainability is also creating opportunities for the development of eco-friendlier indicator materials and packaging.
Growth Accelerators in the Sterility Indicators Industry
The Sterility Indicators Industry is experiencing significant growth accelerators. Technological breakthroughs in material science and sensor technology are enabling the development of more sensitive and responsive indicators, including those that can detect a wider range of sterilization parameters. Strategic partnerships between indicator manufacturers and sterilization equipment providers are crucial for creating integrated solutions that enhance efficacy and user experience. Market expansion strategies, particularly targeting the rapidly growing healthcare sectors in Asia Pacific and Latin America, are critical for long-term growth. The increasing outsourcing of sterilization processes by medical device and pharmaceutical companies also presents an opportunity for specialized sterility indicator providers. Furthermore, proactive engagement with regulatory bodies to anticipate future standards and develop compliant solutions acts as a significant accelerator for market leadership.
Key Players Shaping the Sterility Indicators Market
- 3M Company
- Anderson Products Inc
- Cantel Medical Corporation
- Cardinal Health Inc
- Getinge AB
- Matachana Group
- Mesa Laboratories
Notable Milestones in Sterility Indicators Sector
- 2019: Introduction of advanced self-contained biological indicators with faster readouts.
- 2020: Increased demand for chemical indicators due to pandemic-related sterilization protocols in healthcare.
- 2021: Expansion of RFID-enabled sterility indicator systems for enhanced traceability.
- 2022: Launch of new biological indicators validated for emerging sterilization technologies.
- 2023: Significant M&A activity focused on consolidating market share and expanding product portfolios.
- 2024: Development of AI-powered predictive analytics for sterilization validation using indicator data.
In-Depth Sterility Indicators Market Outlook
The future market potential for Sterility Indicators is exceptionally strong, driven by an unwavering global commitment to patient safety and infection control. Strategic opportunities lie in catering to the evolving needs of pharmaceutical and biotechnology sectors with highly specialized indicators for novel drug delivery systems and advanced biologics. The continued expansion of healthcare infrastructure in emerging markets will create significant demand for both established and innovative sterility validation solutions. Furthermore, the integration of digital technologies, such as IoT and AI, into sterility indicator systems will revolutionize data management, compliance, and operational efficiency, offering substantial growth prospects for early adopters. Companies that invest in R&D for faster, more sensitive, and digitally-enabled indicators are well-positioned to capitalize on these future trends and secure a dominant market position.
Sterility Indicators Segmentation
-
1. Application
- 1.1. Hospitals
- 1.2. Pharmaceutical Companies
- 1.3. Medical Device Companies
- 1.4. Clinical laboratories
- 1.5. Other
-
2. Types
- 2.1. Chemical Indicators
- 2.2. Biological Indicators
Sterility Indicators Segmentation By Geography
-
1. North America
- 1.1. United States
- 1.2. Canada
- 1.3. Mexico
-
2. South America
- 2.1. Brazil
- 2.2. Argentina
- 2.3. Rest of South America
-
3. Europe
- 3.1. United Kingdom
- 3.2. Germany
- 3.3. France
- 3.4. Italy
- 3.5. Spain
- 3.6. Russia
- 3.7. Benelux
- 3.8. Nordics
- 3.9. Rest of Europe
-
4. Middle East & Africa
- 4.1. Turkey
- 4.2. Israel
- 4.3. GCC
- 4.4. North Africa
- 4.5. South Africa
- 4.6. Rest of Middle East & Africa
-
5. Asia Pacific
- 5.1. China
- 5.2. India
- 5.3. Japan
- 5.4. South Korea
- 5.5. ASEAN
- 5.6. Oceania
- 5.7. Rest of Asia Pacific
Sterility Indicators Regional Market Share
Geographic Coverage of Sterility Indicators
Sterility Indicators REPORT HIGHLIGHTS
| Aspects | Details |
|---|---|
| Study Period | 2020-2034 |
| Base Year | 2025 |
| Estimated Year | 2026 |
| Forecast Period | 2026-2034 |
| Historical Period | 2020-2025 |
| Growth Rate | CAGR of 8.3% from 2020-2034 |
| Segmentation |
|
Table of Contents
- 1. Introduction
- 1.1. Research Scope
- 1.2. Market Segmentation
- 1.3. Research Objective
- 1.4. Definitions and Assumptions
- 2. Executive Summary
- 2.1. Market Snapshot
- 3. Market Dynamics
- 3.1. Market Drivers
- 3.2. Market Restrains
- 3.3. Market Trends
- 3.4. Market Opportunities
- 4. Market Factor Analysis
- 4.1. Porters Five Forces
- 4.1.1. Bargaining Power of Suppliers
- 4.1.2. Bargaining Power of Buyers
- 4.1.3. Threat of New Entrants
- 4.1.4. Threat of Substitutes
- 4.1.5. Competitive Rivalry
- 4.2. PESTEL analysis
- 4.3. BCG Analysis
- 4.3.1. Stars (High Growth, High Market Share)
- 4.3.2. Cash Cows (Low Growth, High Market Share)
- 4.3.3. Question Mark (High Growth, Low Market Share)
- 4.3.4. Dogs (Low Growth, Low Market Share)
- 4.4. Ansoff Matrix Analysis
- 4.5. Supply Chain Analysis
- 4.6. Regulatory Landscape
- 4.7. Current Market Potential and Opportunity Assessment (TAM–SAM–SOM Framework)
- 4.8. NRP Analyst Note
- 4.1. Porters Five Forces
- 5. Market Analysis, Insights and Forecast 2021-2033
- 5.1. Market Analysis, Insights and Forecast - by Application
- 5.1.1. Hospitals
- 5.1.2. Pharmaceutical Companies
- 5.1.3. Medical Device Companies
- 5.1.4. Clinical laboratories
- 5.1.5. Other
- 5.2. Market Analysis, Insights and Forecast - by Types
- 5.2.1. Chemical Indicators
- 5.2.2. Biological Indicators
- 5.3. Market Analysis, Insights and Forecast - by Region
- 5.3.1. North America
- 5.3.2. South America
- 5.3.3. Europe
- 5.3.4. Middle East & Africa
- 5.3.5. Asia Pacific
- 5.1. Market Analysis, Insights and Forecast - by Application
- 6. Global Sterility Indicators Analysis, Insights and Forecast, 2021-2033
- 6.1. Market Analysis, Insights and Forecast - by Application
- 6.1.1. Hospitals
- 6.1.2. Pharmaceutical Companies
- 6.1.3. Medical Device Companies
- 6.1.4. Clinical laboratories
- 6.1.5. Other
- 6.2. Market Analysis, Insights and Forecast - by Types
- 6.2.1. Chemical Indicators
- 6.2.2. Biological Indicators
- 6.1. Market Analysis, Insights and Forecast - by Application
- 7. North America Sterility Indicators Analysis, Insights and Forecast, 2020-2032
- 7.1. Market Analysis, Insights and Forecast - by Application
- 7.1.1. Hospitals
- 7.1.2. Pharmaceutical Companies
- 7.1.3. Medical Device Companies
- 7.1.4. Clinical laboratories
- 7.1.5. Other
- 7.2. Market Analysis, Insights and Forecast - by Types
- 7.2.1. Chemical Indicators
- 7.2.2. Biological Indicators
- 7.1. Market Analysis, Insights and Forecast - by Application
- 8. South America Sterility Indicators Analysis, Insights and Forecast, 2020-2032
- 8.1. Market Analysis, Insights and Forecast - by Application
- 8.1.1. Hospitals
- 8.1.2. Pharmaceutical Companies
- 8.1.3. Medical Device Companies
- 8.1.4. Clinical laboratories
- 8.1.5. Other
- 8.2. Market Analysis, Insights and Forecast - by Types
- 8.2.1. Chemical Indicators
- 8.2.2. Biological Indicators
- 8.1. Market Analysis, Insights and Forecast - by Application
- 9. Europe Sterility Indicators Analysis, Insights and Forecast, 2020-2032
- 9.1. Market Analysis, Insights and Forecast - by Application
- 9.1.1. Hospitals
- 9.1.2. Pharmaceutical Companies
- 9.1.3. Medical Device Companies
- 9.1.4. Clinical laboratories
- 9.1.5. Other
- 9.2. Market Analysis, Insights and Forecast - by Types
- 9.2.1. Chemical Indicators
- 9.2.2. Biological Indicators
- 9.1. Market Analysis, Insights and Forecast - by Application
- 10. Middle East & Africa Sterility Indicators Analysis, Insights and Forecast, 2020-2032
- 10.1. Market Analysis, Insights and Forecast - by Application
- 10.1.1. Hospitals
- 10.1.2. Pharmaceutical Companies
- 10.1.3. Medical Device Companies
- 10.1.4. Clinical laboratories
- 10.1.5. Other
- 10.2. Market Analysis, Insights and Forecast - by Types
- 10.2.1. Chemical Indicators
- 10.2.2. Biological Indicators
- 10.1. Market Analysis, Insights and Forecast - by Application
- 11. Asia Pacific Sterility Indicators Analysis, Insights and Forecast, 2020-2032
- 11.1. Market Analysis, Insights and Forecast - by Application
- 11.1.1. Hospitals
- 11.1.2. Pharmaceutical Companies
- 11.1.3. Medical Device Companies
- 11.1.4. Clinical laboratories
- 11.1.5. Other
- 11.2. Market Analysis, Insights and Forecast - by Types
- 11.2.1. Chemical Indicators
- 11.2.2. Biological Indicators
- 11.1. Market Analysis, Insights and Forecast - by Application
- 12. Competitive Analysis
- 12.1. Company Profiles
- 12.1.1 3M Company
- 12.1.1.1. Company Overview
- 12.1.1.2. Products
- 12.1.1.3. Company Financials
- 12.1.1.4. SWOT Analysis
- 12.1.2 Anderson Products Inc
- 12.1.2.1. Company Overview
- 12.1.2.2. Products
- 12.1.2.3. Company Financials
- 12.1.2.4. SWOT Analysis
- 12.1.3 Cantel Medical Corporation
- 12.1.3.1. Company Overview
- 12.1.3.2. Products
- 12.1.3.3. Company Financials
- 12.1.3.4. SWOT Analysis
- 12.1.4 Cardinal Health Inc
- 12.1.4.1. Company Overview
- 12.1.4.2. Products
- 12.1.4.3. Company Financials
- 12.1.4.4. SWOT Analysis
- 12.1.5 Getinge AB
- 12.1.5.1. Company Overview
- 12.1.5.2. Products
- 12.1.5.3. Company Financials
- 12.1.5.4. SWOT Analysis
- 12.1.6 Matachana Group
- 12.1.6.1. Company Overview
- 12.1.6.2. Products
- 12.1.6.3. Company Financials
- 12.1.6.4. SWOT Analysis
- 12.1.7 Mesa Laboratories
- 12.1.7.1. Company Overview
- 12.1.7.2. Products
- 12.1.7.3. Company Financials
- 12.1.7.4. SWOT Analysis
- 12.1.1 3M Company
- 12.2. Market Entropy
- 12.2.1 Company's Key Areas Served
- 12.2.2 Recent Developments
- 12.3. Company Market Share Analysis 2025
- 12.3.1 Top 5 Companies Market Share Analysis
- 12.3.2 Top 3 Companies Market Share Analysis
- 12.4. List of Potential Customers
- 13. Research Methodology
List of Figures
- Figure 1: Global Sterility Indicators Revenue Breakdown (million, %) by Region 2025 & 2033
- Figure 2: North America Sterility Indicators Revenue (million), by Application 2025 & 2033
- Figure 3: North America Sterility Indicators Revenue Share (%), by Application 2025 & 2033
- Figure 4: North America Sterility Indicators Revenue (million), by Types 2025 & 2033
- Figure 5: North America Sterility Indicators Revenue Share (%), by Types 2025 & 2033
- Figure 6: North America Sterility Indicators Revenue (million), by Country 2025 & 2033
- Figure 7: North America Sterility Indicators Revenue Share (%), by Country 2025 & 2033
- Figure 8: South America Sterility Indicators Revenue (million), by Application 2025 & 2033
- Figure 9: South America Sterility Indicators Revenue Share (%), by Application 2025 & 2033
- Figure 10: South America Sterility Indicators Revenue (million), by Types 2025 & 2033
- Figure 11: South America Sterility Indicators Revenue Share (%), by Types 2025 & 2033
- Figure 12: South America Sterility Indicators Revenue (million), by Country 2025 & 2033
- Figure 13: South America Sterility Indicators Revenue Share (%), by Country 2025 & 2033
- Figure 14: Europe Sterility Indicators Revenue (million), by Application 2025 & 2033
- Figure 15: Europe Sterility Indicators Revenue Share (%), by Application 2025 & 2033
- Figure 16: Europe Sterility Indicators Revenue (million), by Types 2025 & 2033
- Figure 17: Europe Sterility Indicators Revenue Share (%), by Types 2025 & 2033
- Figure 18: Europe Sterility Indicators Revenue (million), by Country 2025 & 2033
- Figure 19: Europe Sterility Indicators Revenue Share (%), by Country 2025 & 2033
- Figure 20: Middle East & Africa Sterility Indicators Revenue (million), by Application 2025 & 2033
- Figure 21: Middle East & Africa Sterility Indicators Revenue Share (%), by Application 2025 & 2033
- Figure 22: Middle East & Africa Sterility Indicators Revenue (million), by Types 2025 & 2033
- Figure 23: Middle East & Africa Sterility Indicators Revenue Share (%), by Types 2025 & 2033
- Figure 24: Middle East & Africa Sterility Indicators Revenue (million), by Country 2025 & 2033
- Figure 25: Middle East & Africa Sterility Indicators Revenue Share (%), by Country 2025 & 2033
- Figure 26: Asia Pacific Sterility Indicators Revenue (million), by Application 2025 & 2033
- Figure 27: Asia Pacific Sterility Indicators Revenue Share (%), by Application 2025 & 2033
- Figure 28: Asia Pacific Sterility Indicators Revenue (million), by Types 2025 & 2033
- Figure 29: Asia Pacific Sterility Indicators Revenue Share (%), by Types 2025 & 2033
- Figure 30: Asia Pacific Sterility Indicators Revenue (million), by Country 2025 & 2033
- Figure 31: Asia Pacific Sterility Indicators Revenue Share (%), by Country 2025 & 2033
List of Tables
- Table 1: Global Sterility Indicators Revenue million Forecast, by Application 2020 & 2033
- Table 2: Global Sterility Indicators Revenue million Forecast, by Types 2020 & 2033
- Table 3: Global Sterility Indicators Revenue million Forecast, by Region 2020 & 2033
- Table 4: Global Sterility Indicators Revenue million Forecast, by Application 2020 & 2033
- Table 5: Global Sterility Indicators Revenue million Forecast, by Types 2020 & 2033
- Table 6: Global Sterility Indicators Revenue million Forecast, by Country 2020 & 2033
- Table 7: United States Sterility Indicators Revenue (million) Forecast, by Application 2020 & 2033
- Table 8: Canada Sterility Indicators Revenue (million) Forecast, by Application 2020 & 2033
- Table 9: Mexico Sterility Indicators Revenue (million) Forecast, by Application 2020 & 2033
- Table 10: Global Sterility Indicators Revenue million Forecast, by Application 2020 & 2033
- Table 11: Global Sterility Indicators Revenue million Forecast, by Types 2020 & 2033
- Table 12: Global Sterility Indicators Revenue million Forecast, by Country 2020 & 2033
- Table 13: Brazil Sterility Indicators Revenue (million) Forecast, by Application 2020 & 2033
- Table 14: Argentina Sterility Indicators Revenue (million) Forecast, by Application 2020 & 2033
- Table 15: Rest of South America Sterility Indicators Revenue (million) Forecast, by Application 2020 & 2033
- Table 16: Global Sterility Indicators Revenue million Forecast, by Application 2020 & 2033
- Table 17: Global Sterility Indicators Revenue million Forecast, by Types 2020 & 2033
- Table 18: Global Sterility Indicators Revenue million Forecast, by Country 2020 & 2033
- Table 19: United Kingdom Sterility Indicators Revenue (million) Forecast, by Application 2020 & 2033
- Table 20: Germany Sterility Indicators Revenue (million) Forecast, by Application 2020 & 2033
- Table 21: France Sterility Indicators Revenue (million) Forecast, by Application 2020 & 2033
- Table 22: Italy Sterility Indicators Revenue (million) Forecast, by Application 2020 & 2033
- Table 23: Spain Sterility Indicators Revenue (million) Forecast, by Application 2020 & 2033
- Table 24: Russia Sterility Indicators Revenue (million) Forecast, by Application 2020 & 2033
- Table 25: Benelux Sterility Indicators Revenue (million) Forecast, by Application 2020 & 2033
- Table 26: Nordics Sterility Indicators Revenue (million) Forecast, by Application 2020 & 2033
- Table 27: Rest of Europe Sterility Indicators Revenue (million) Forecast, by Application 2020 & 2033
- Table 28: Global Sterility Indicators Revenue million Forecast, by Application 2020 & 2033
- Table 29: Global Sterility Indicators Revenue million Forecast, by Types 2020 & 2033
- Table 30: Global Sterility Indicators Revenue million Forecast, by Country 2020 & 2033
- Table 31: Turkey Sterility Indicators Revenue (million) Forecast, by Application 2020 & 2033
- Table 32: Israel Sterility Indicators Revenue (million) Forecast, by Application 2020 & 2033
- Table 33: GCC Sterility Indicators Revenue (million) Forecast, by Application 2020 & 2033
- Table 34: North Africa Sterility Indicators Revenue (million) Forecast, by Application 2020 & 2033
- Table 35: South Africa Sterility Indicators Revenue (million) Forecast, by Application 2020 & 2033
- Table 36: Rest of Middle East & Africa Sterility Indicators Revenue (million) Forecast, by Application 2020 & 2033
- Table 37: Global Sterility Indicators Revenue million Forecast, by Application 2020 & 2033
- Table 38: Global Sterility Indicators Revenue million Forecast, by Types 2020 & 2033
- Table 39: Global Sterility Indicators Revenue million Forecast, by Country 2020 & 2033
- Table 40: China Sterility Indicators Revenue (million) Forecast, by Application 2020 & 2033
- Table 41: India Sterility Indicators Revenue (million) Forecast, by Application 2020 & 2033
- Table 42: Japan Sterility Indicators Revenue (million) Forecast, by Application 2020 & 2033
- Table 43: South Korea Sterility Indicators Revenue (million) Forecast, by Application 2020 & 2033
- Table 44: ASEAN Sterility Indicators Revenue (million) Forecast, by Application 2020 & 2033
- Table 45: Oceania Sterility Indicators Revenue (million) Forecast, by Application 2020 & 2033
- Table 46: Rest of Asia Pacific Sterility Indicators Revenue (million) Forecast, by Application 2020 & 2033
Frequently Asked Questions
1. What is the projected Compound Annual Growth Rate (CAGR) of the Sterility Indicators?
The projected CAGR is approximately 8.3%.
2. Which companies are prominent players in the Sterility Indicators?
Key companies in the market include 3M Company, Anderson Products Inc, Cantel Medical Corporation, Cardinal Health Inc, Getinge AB, Matachana Group, Mesa Laboratories.
3. What are the main segments of the Sterility Indicators?
The market segments include Application, Types.
4. Can you provide details about the market size?
The market size is estimated to be USD 879.8 million as of 2022.
5. What are some drivers contributing to market growth?
N/A
6. What are the notable trends driving market growth?
N/A
7. Are there any restraints impacting market growth?
N/A
8. Can you provide examples of recent developments in the market?
N/A
9. What pricing options are available for accessing the report?
Pricing options include single-user, multi-user, and enterprise licenses priced at USD 2900.00, USD 4350.00, and USD 5800.00 respectively.
10. Is the market size provided in terms of value or volume?
The market size is provided in terms of value, measured in million.
11. Are there any specific market keywords associated with the report?
Yes, the market keyword associated with the report is "Sterility Indicators," which aids in identifying and referencing the specific market segment covered.
12. How do I determine which pricing option suits my needs best?
The pricing options vary based on user requirements and access needs. Individual users may opt for single-user licenses, while businesses requiring broader access may choose multi-user or enterprise licenses for cost-effective access to the report.
13. Are there any additional resources or data provided in the Sterility Indicators report?
While the report offers comprehensive insights, it's advisable to review the specific contents or supplementary materials provided to ascertain if additional resources or data are available.
14. How can I stay updated on further developments or reports in the Sterility Indicators?
To stay informed about further developments, trends, and reports in the Sterility Indicators, consider subscribing to industry newsletters, following relevant companies and organizations, or regularly checking reputable industry news sources and publications.
Methodology
Step 1 - Identification of Relevant Samples Size from Population Database


Step 2 - Approaches for Defining Global Market Size (Value, Volume* & Price*)

Note*: In applicable scenarios
Step 3 - Data Sources
Primary Research
- Web Analytics
- Survey Reports
- Research Institute
- Latest Research Reports
- Opinion Leaders
Secondary Research
- Annual Reports
- White Paper
- Latest Press Release
- Industry Association
- Paid Database
- Investor Presentations

Step 4 - Data Triangulation
Involves using different sources of information in order to increase the validity of a study
These sources are likely to be stakeholders in a program - participants, other researchers, program staff, other community members, and so on.
Then we put all data in single framework & apply various statistical tools to find out the dynamic on the market.
During the analysis stage, feedback from the stakeholder groups would be compared to determine areas of agreement as well as areas of divergence