

Key Insights
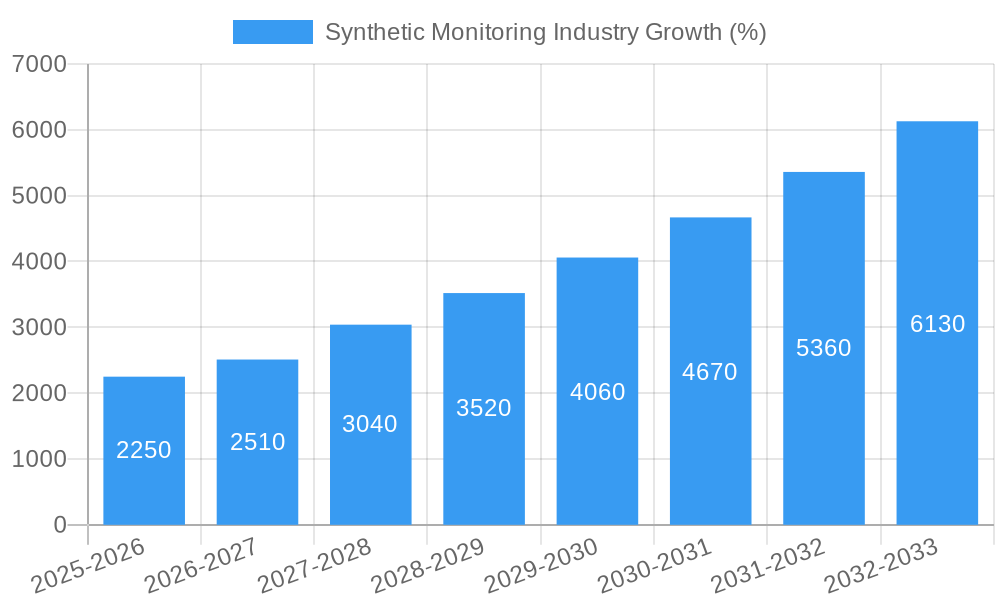
The Synthetic Monitoring market is experiencing robust growth, driven by the increasing reliance on digital applications and the critical need for ensuring seamless user experiences across websites, APIs, and mobile apps. A Compound Annual Growth Rate (CAGR) of 15.30% from 2019 to 2024 suggests a significant expansion, and this momentum is expected to continue through 2033. Key drivers include the rising adoption of cloud computing, the growing demand for enhanced application performance, and the increasing pressure on businesses to maintain high levels of availability and responsiveness. The BFSI (Banking, Financial Services, and Insurance) sector, along with IT and telecommunications, represent major end-user verticals, driving significant demand. While data privacy regulations and the complexity of integrating monitoring tools can pose challenges, the overall market outlook remains positive, fuelled by continuous innovation in monitoring technologies and the expanding digital landscape. Segmentation by monitoring type (API, website, mobile application) allows vendors to tailor their solutions to specific customer needs, further propelling market growth. The competitive landscape is dynamic, with established players like HP Enterprise, IBM, and Oracle competing alongside newer entrants and specialized providers. The market's evolution is marked by a shift towards AI-powered analytics and predictive capabilities within monitoring platforms, enabling businesses to proactively identify and resolve potential issues before they impact users.
Continued expansion into emerging economies in the Asia-Pacific region, along with ongoing digital transformation initiatives across various industries, will contribute significantly to the market’s sustained growth. The increasing adoption of DevOps methodologies and the need for robust testing and monitoring throughout the software development lifecycle are further reinforcing the demand for synthetic monitoring solutions. Competition is likely to intensify as companies innovate to offer more comprehensive and integrated platforms, focusing on advanced features such as real-user monitoring (RUM) integration and enhanced visualization capabilities for better insights into application performance. Despite the challenges, the long-term outlook for the synthetic monitoring market remains extremely positive, driven by the undeniable need for reliable and effective application monitoring in today’s digital economy. This is projected to lead to a substantial increase in market size over the forecast period, creating significant opportunities for established players and new market entrants.
Synthetic Monitoring Industry Market Report: 2019-2033
This comprehensive report provides a deep dive into the Synthetic Monitoring industry, analyzing market dynamics, growth trends, and key players. The study covers the period 2019-2033, with a focus on the 2025-2033 forecast period. The report segments the market by type (API Monitoring, Website Monitoring, Mobile Application Monitoring) and end-user vertical (BFSI, IT & Telecommunication, Retail, Government, Manufacturing & Automotive, Military & Defense, Other). Discover crucial insights to navigate this rapidly evolving market.
Synthetic Monitoring Industry Market Dynamics & Structure
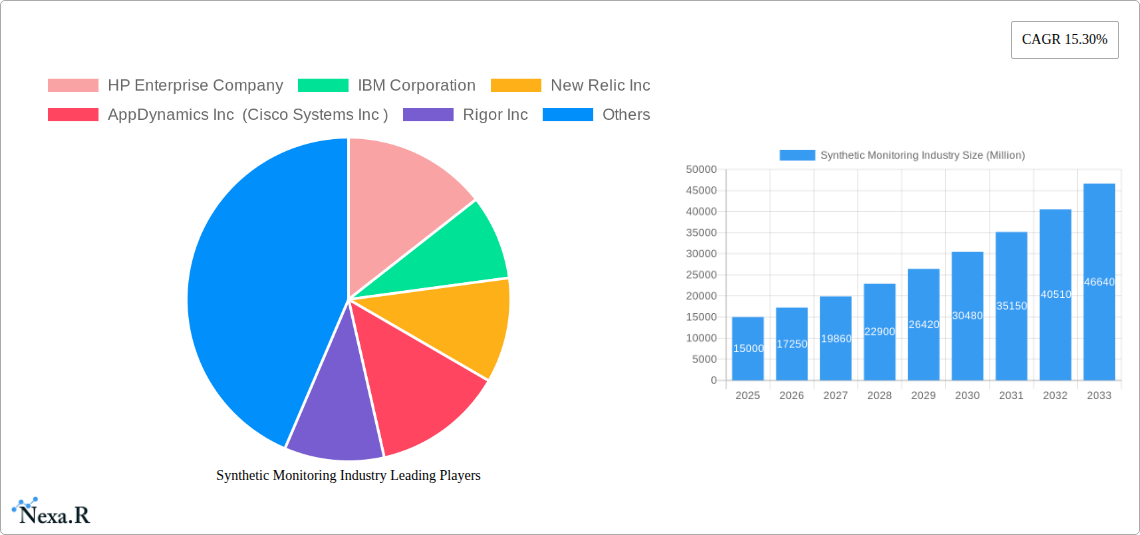
The Synthetic Monitoring market, valued at xx Million in 2024, is characterized by a moderately concentrated landscape. Key players like HP Enterprise Company, IBM Corporation, New Relic Inc, and AppDynamics Inc (Cisco Systems Inc) hold significant market share, engaging in ongoing competition through innovation and strategic acquisitions. The market's growth is fueled by increasing digital transformation initiatives and the rising need for ensuring application performance and uptime across diverse platforms.
- Market Concentration: Moderately concentrated, with top players holding xx% market share collectively (2024).
- Technological Innovation Drivers: AI/ML-powered anomaly detection, automation, and cloud-based solutions.
- Regulatory Frameworks: Compliance mandates (e.g., GDPR, HIPAA) drive adoption for data security and privacy.
- Competitive Product Substitutes: Real user monitoring (RUM) tools offer alternative perspectives but lack the controlled environment of synthetic monitoring.
- End-User Demographics: Predominantly large enterprises and SMEs in technologically advanced regions.
- M&A Trends: Consolidation is likely, driven by the need to expand product portfolios and geographic reach; xx M&A deals observed between 2019-2024.
Synthetic Monitoring Industry Growth Trends & Insights
The Synthetic Monitoring market exhibits strong growth, driven by the increasing adoption of cloud-based applications, the rise of mobile and API-driven services, and the growing need for proactive performance management. The market is expected to reach xx Million by 2033, exhibiting a CAGR of xx% during the forecast period (2025-2033). This growth is further fueled by the increasing complexity of modern IT infrastructure and the need for ensuring a seamless digital experience for end-users. Market penetration is currently at xx% in key regions and is projected to increase significantly by 2033. Technological disruptions, such as the integration of AI/ML for predictive analytics and automation, are further accelerating market adoption. Consumer behavior shifts toward seamless digital experiences increase demand for robust monitoring solutions.
Dominant Regions, Countries, or Segments in Synthetic Monitoring Industry
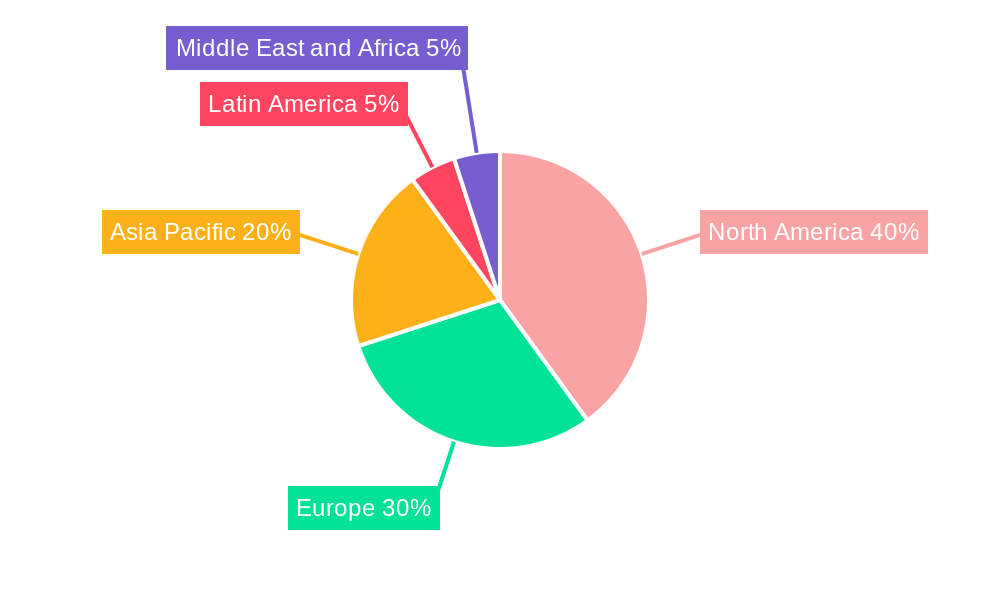
North America currently dominates the Synthetic Monitoring market, holding the largest market share, owing to high technology adoption rates, robust IT infrastructure, and the presence of major players. Within the segments, Website Monitoring currently holds the largest market share driven by widespread e-commerce and online services adoption. However, API Monitoring is projected for significant growth due to the increasing reliance on APIs for application integration. In terms of end-user verticals, BFSI and IT & Telecommunication lead, driven by stringent performance requirements and compliance needs.
- Key Drivers (North America): High digitalization, robust IT infrastructure, early adoption of new technologies.
- Key Drivers (Website Monitoring): E-commerce growth, high dependency on online services.
- Key Drivers (API Monitoring): Microservices architecture, API-driven applications.
- Key Drivers (BFSI): Stringent regulatory compliance, need for high availability.
- Key Drivers (IT & Telecommunication): High reliance on network infrastructure, demand for performance optimization.
Synthetic Monitoring Industry Product Landscape
Synthetic monitoring solutions are evolving rapidly, integrating advanced features like AI/ML-driven anomaly detection, self-healing capabilities, and real-time dashboards. Products are increasingly offered as SaaS solutions, providing scalability, accessibility, and cost-effectiveness. Unique selling propositions include enhanced visualization, improved alert management, and integrations with other monitoring tools. Technological advancements like serverless computing and edge computing are driving innovation in this space, with solutions tailored to these environments.
Key Drivers, Barriers & Challenges in Synthetic Monitoring Industry
Key Drivers: Growing adoption of cloud-native applications, increasing complexity of IT infrastructure, stringent regulatory compliance needs for application performance, and rising demand for superior digital customer experiences.
Challenges: High initial investment costs for enterprise-grade solutions, integration complexities with existing IT infrastructure, and skill gaps in managing sophisticated monitoring tools. Furthermore, competition from open-source solutions and the need for continuous innovation to meet evolving market demands poses challenges. The global market experienced supply chain disruptions (estimated xx% impact on product availability in 2022), creating delays in deployments and impacting revenue streams.
Emerging Opportunities in Synthetic Monitoring Industry
Emerging opportunities lie in untapped markets (e.g., developing economies) and innovative applications, such as the integration of synthetic monitoring with IoT devices, blockchain technology, and the metaverse. The increasing adoption of Serverless architecture and edge computing presents opportunities for specialized monitoring solutions tailored to these environments. Moreover, the rise of AIOps promises increased automation and intelligence in synthetic monitoring.
Growth Accelerators in the Synthetic Monitoring Industry
Strategic partnerships between synthetic monitoring vendors and cloud providers are expanding market reach and fostering innovation. Technological breakthroughs in AI/ML are enhancing the capabilities of existing solutions, leading to improved accuracy, automation, and predictive capabilities. Expansion into new geographical markets and industry verticals, particularly in emerging economies with growing digital adoption, fuels further growth.
Key Players Shaping the Synthetic Monitoring Industry Market
- HP Enterprise Company
- IBM Corporation
- New Relic Inc
- AppDynamics Inc (Cisco Systems Inc)
- Rigor Inc
- Smart Bear Software Inc
- Broadcom Inc
- BMC Software Inc
- Monitis Inc
- Oracle Corporation
- Apica AB
- Dell Technologies Inc
- Dynatrace LLC
- SolarWinds Inc
Notable Milestones in Synthetic Monitoring Industry Sector
- December 2022: Broadcom Inc. launched CA 1 flexible storage, enabling cost-effective and secure mainframe data storage in hybrid IT environments, positively impacting the market's adoption of cloud-based solutions.
- June 2022: SmartBear Software integrated web browser testing into its BitBar platform, enhancing mobile app testing capabilities and boosting the platform's market competitiveness.
In-Depth Synthetic Monitoring Industry Market Outlook
The Synthetic Monitoring market is poised for continued strong growth, driven by technological advancements, increased digital adoption, and the growing need for robust application performance monitoring. Strategic partnerships, market expansion, and innovation in AI/ML will play crucial roles in shaping the market's future. This presents significant opportunities for existing players and new entrants to capitalize on the evolving needs of the global digital landscape.
Synthetic Monitoring Industry Segmentation
-
1. Type
- 1.1. API Monitoring
- 1.2. Website Monitoring
- 1.3. Mobile Application Monitoring
-
2. End-User Vertical
- 2.1. BFSI
- 2.2. IT and Telecommunication
- 2.3. Retail
- 2.4. Government
- 2.5. Manufacturing and Automotive
- 2.6. Military and Defense
- 2.7. Other End-user Verticals
Synthetic Monitoring Industry Segmentation By Geography
- 1. North America
- 2. Europe
- 3. Asia Pacific
- 4. Latin America
- 5. Middle East and Africa
Synthetic Monitoring Industry REPORT HIGHLIGHTS
| Aspects | Details |
|---|---|
| Study Period | 2019-2033 |
| Base Year | 2024 |
| Estimated Year | 2025 |
| Forecast Period | 2025-2033 |
| Historical Period | 2019-2024 |
| Growth Rate | CAGR of 15.30% from 2019-2033 |
| Segmentation |
|
Table of Contents
- 1. Introduction
- 1.1. Research Scope
- 1.2. Market Segmentation
- 1.3. Research Methodology
- 1.4. Definitions and Assumptions
- 2. Executive Summary
- 2.1. Introduction
- 3. Market Dynamics
- 3.1. Introduction
- 3.2. Market Drivers
- 3.2.1. Increasing Need for Monitoring Service Level Agreement (SLA) Targets; Rising Demand for Application Performance Management; Increasing Need for DevOPs
- 3.3. Market Restrains
- 3.3.1. Increased Demand for Outsourcing and Automation in Pharmaceutical Manufacturing
- 3.4. Market Trends
- 3.4.1. IT and Telecommunications is Expected to Show Significant Growth
- 4. Market Factor Analysis
- 4.1. Porters Five Forces
- 4.2. Supply/Value Chain
- 4.3. PESTEL analysis
- 4.4. Market Entropy
- 4.5. Patent/Trademark Analysis
- 5. Global Synthetic Monitoring Industry Analysis, Insights and Forecast, 2019-2031
- 5.1. Market Analysis, Insights and Forecast - by Type
- 5.1.1. API Monitoring
- 5.1.2. Website Monitoring
- 5.1.3. Mobile Application Monitoring
- 5.2. Market Analysis, Insights and Forecast - by End-User Vertical
- 5.2.1. BFSI
- 5.2.2. IT and Telecommunication
- 5.2.3. Retail
- 5.2.4. Government
- 5.2.5. Manufacturing and Automotive
- 5.2.6. Military and Defense
- 5.2.7. Other End-user Verticals
- 5.3. Market Analysis, Insights and Forecast - by Region
- 5.3.1. North America
- 5.3.2. Europe
- 5.3.3. Asia Pacific
- 5.3.4. Latin America
- 5.3.5. Middle East and Africa
- 5.1. Market Analysis, Insights and Forecast - by Type
- 6. North America Synthetic Monitoring Industry Analysis, Insights and Forecast, 2019-2031
- 6.1. Market Analysis, Insights and Forecast - by Type
- 6.1.1. API Monitoring
- 6.1.2. Website Monitoring
- 6.1.3. Mobile Application Monitoring
- 6.2. Market Analysis, Insights and Forecast - by End-User Vertical
- 6.2.1. BFSI
- 6.2.2. IT and Telecommunication
- 6.2.3. Retail
- 6.2.4. Government
- 6.2.5. Manufacturing and Automotive
- 6.2.6. Military and Defense
- 6.2.7. Other End-user Verticals
- 6.1. Market Analysis, Insights and Forecast - by Type
- 7. Europe Synthetic Monitoring Industry Analysis, Insights and Forecast, 2019-2031
- 7.1. Market Analysis, Insights and Forecast - by Type
- 7.1.1. API Monitoring
- 7.1.2. Website Monitoring
- 7.1.3. Mobile Application Monitoring
- 7.2. Market Analysis, Insights and Forecast - by End-User Vertical
- 7.2.1. BFSI
- 7.2.2. IT and Telecommunication
- 7.2.3. Retail
- 7.2.4. Government
- 7.2.5. Manufacturing and Automotive
- 7.2.6. Military and Defense
- 7.2.7. Other End-user Verticals
- 7.1. Market Analysis, Insights and Forecast - by Type
- 8. Asia Pacific Synthetic Monitoring Industry Analysis, Insights and Forecast, 2019-2031
- 8.1. Market Analysis, Insights and Forecast - by Type
- 8.1.1. API Monitoring
- 8.1.2. Website Monitoring
- 8.1.3. Mobile Application Monitoring
- 8.2. Market Analysis, Insights and Forecast - by End-User Vertical
- 8.2.1. BFSI
- 8.2.2. IT and Telecommunication
- 8.2.3. Retail
- 8.2.4. Government
- 8.2.5. Manufacturing and Automotive
- 8.2.6. Military and Defense
- 8.2.7. Other End-user Verticals
- 8.1. Market Analysis, Insights and Forecast - by Type
- 9. Latin America Synthetic Monitoring Industry Analysis, Insights and Forecast, 2019-2031
- 9.1. Market Analysis, Insights and Forecast - by Type
- 9.1.1. API Monitoring
- 9.1.2. Website Monitoring
- 9.1.3. Mobile Application Monitoring
- 9.2. Market Analysis, Insights and Forecast - by End-User Vertical
- 9.2.1. BFSI
- 9.2.2. IT and Telecommunication
- 9.2.3. Retail
- 9.2.4. Government
- 9.2.5. Manufacturing and Automotive
- 9.2.6. Military and Defense
- 9.2.7. Other End-user Verticals
- 9.1. Market Analysis, Insights and Forecast - by Type
- 10. Middle East and Africa Synthetic Monitoring Industry Analysis, Insights and Forecast, 2019-2031
- 10.1. Market Analysis, Insights and Forecast - by Type
- 10.1.1. API Monitoring
- 10.1.2. Website Monitoring
- 10.1.3. Mobile Application Monitoring
- 10.2. Market Analysis, Insights and Forecast - by End-User Vertical
- 10.2.1. BFSI
- 10.2.2. IT and Telecommunication
- 10.2.3. Retail
- 10.2.4. Government
- 10.2.5. Manufacturing and Automotive
- 10.2.6. Military and Defense
- 10.2.7. Other End-user Verticals
- 10.1. Market Analysis, Insights and Forecast - by Type
- 11. North America Synthetic Monitoring Industry Analysis, Insights and Forecast, 2019-2031
- 11.1. Market Analysis, Insights and Forecast - By Country/Sub-region
- 11.1.1.
- 12. Europe Synthetic Monitoring Industry Analysis, Insights and Forecast, 2019-2031
- 12.1. Market Analysis, Insights and Forecast - By Country/Sub-region
- 12.1.1.
- 13. Asia Pacific Synthetic Monitoring Industry Analysis, Insights and Forecast, 2019-2031
- 13.1. Market Analysis, Insights and Forecast - By Country/Sub-region
- 13.1.1.
- 14. Latin America Synthetic Monitoring Industry Analysis, Insights and Forecast, 2019-2031
- 14.1. Market Analysis, Insights and Forecast - By Country/Sub-region
- 14.1.1.
- 15. Middle East and Africa Synthetic Monitoring Industry Analysis, Insights and Forecast, 2019-2031
- 15.1. Market Analysis, Insights and Forecast - By Country/Sub-region
- 15.1.1.
- 16. Competitive Analysis
- 16.1. Global Market Share Analysis 2024
- 16.2. Company Profiles
- 16.2.1 HP Enterprise Company
- 16.2.1.1. Overview
- 16.2.1.2. Products
- 16.2.1.3. SWOT Analysis
- 16.2.1.4. Recent Developments
- 16.2.1.5. Financials (Based on Availability)
- 16.2.2 IBM Corporation
- 16.2.2.1. Overview
- 16.2.2.2. Products
- 16.2.2.3. SWOT Analysis
- 16.2.2.4. Recent Developments
- 16.2.2.5. Financials (Based on Availability)
- 16.2.3 New Relic Inc
- 16.2.3.1. Overview
- 16.2.3.2. Products
- 16.2.3.3. SWOT Analysis
- 16.2.3.4. Recent Developments
- 16.2.3.5. Financials (Based on Availability)
- 16.2.4 AppDynamics Inc (Cisco Systems Inc )
- 16.2.4.1. Overview
- 16.2.4.2. Products
- 16.2.4.3. SWOT Analysis
- 16.2.4.4. Recent Developments
- 16.2.4.5. Financials (Based on Availability)
- 16.2.5 Rigor Inc
- 16.2.5.1. Overview
- 16.2.5.2. Products
- 16.2.5.3. SWOT Analysis
- 16.2.5.4. Recent Developments
- 16.2.5.5. Financials (Based on Availability)
- 16.2.6 Smart Bear Software Inc
- 16.2.6.1. Overview
- 16.2.6.2. Products
- 16.2.6.3. SWOT Analysis
- 16.2.6.4. Recent Developments
- 16.2.6.5. Financials (Based on Availability)
- 16.2.7 Broadcom Inc
- 16.2.7.1. Overview
- 16.2.7.2. Products
- 16.2.7.3. SWOT Analysis
- 16.2.7.4. Recent Developments
- 16.2.7.5. Financials (Based on Availability)
- 16.2.8 BMC Software Inc
- 16.2.8.1. Overview
- 16.2.8.2. Products
- 16.2.8.3. SWOT Analysis
- 16.2.8.4. Recent Developments
- 16.2.8.5. Financials (Based on Availability)
- 16.2.9 Monitis Inc
- 16.2.9.1. Overview
- 16.2.9.2. Products
- 16.2.9.3. SWOT Analysis
- 16.2.9.4. Recent Developments
- 16.2.9.5. Financials (Based on Availability)
- 16.2.10 Oracle Corporation
- 16.2.10.1. Overview
- 16.2.10.2. Products
- 16.2.10.3. SWOT Analysis
- 16.2.10.4. Recent Developments
- 16.2.10.5. Financials (Based on Availability)
- 16.2.11 Apica AB
- 16.2.11.1. Overview
- 16.2.11.2. Products
- 16.2.11.3. SWOT Analysis
- 16.2.11.4. Recent Developments
- 16.2.11.5. Financials (Based on Availability)
- 16.2.12 Dell Technologies Inc
- 16.2.12.1. Overview
- 16.2.12.2. Products
- 16.2.12.3. SWOT Analysis
- 16.2.12.4. Recent Developments
- 16.2.12.5. Financials (Based on Availability)
- 16.2.13 Dynatrace LLC
- 16.2.13.1. Overview
- 16.2.13.2. Products
- 16.2.13.3. SWOT Analysis
- 16.2.13.4. Recent Developments
- 16.2.13.5. Financials (Based on Availability)
- 16.2.14 SolarWinds Inc
- 16.2.14.1. Overview
- 16.2.14.2. Products
- 16.2.14.3. SWOT Analysis
- 16.2.14.4. Recent Developments
- 16.2.14.5. Financials (Based on Availability)
- 16.2.1 HP Enterprise Company
List of Figures
- Figure 1: Global Synthetic Monitoring Industry Revenue Breakdown (Million, %) by Region 2024 & 2032
- Figure 2: North America Synthetic Monitoring Industry Revenue (Million), by Country 2024 & 2032
- Figure 3: North America Synthetic Monitoring Industry Revenue Share (%), by Country 2024 & 2032
- Figure 4: Europe Synthetic Monitoring Industry Revenue (Million), by Country 2024 & 2032
- Figure 5: Europe Synthetic Monitoring Industry Revenue Share (%), by Country 2024 & 2032
- Figure 6: Asia Pacific Synthetic Monitoring Industry Revenue (Million), by Country 2024 & 2032
- Figure 7: Asia Pacific Synthetic Monitoring Industry Revenue Share (%), by Country 2024 & 2032
- Figure 8: Latin America Synthetic Monitoring Industry Revenue (Million), by Country 2024 & 2032
- Figure 9: Latin America Synthetic Monitoring Industry Revenue Share (%), by Country 2024 & 2032
- Figure 10: Middle East and Africa Synthetic Monitoring Industry Revenue (Million), by Country 2024 & 2032
- Figure 11: Middle East and Africa Synthetic Monitoring Industry Revenue Share (%), by Country 2024 & 2032
- Figure 12: North America Synthetic Monitoring Industry Revenue (Million), by Type 2024 & 2032
- Figure 13: North America Synthetic Monitoring Industry Revenue Share (%), by Type 2024 & 2032
- Figure 14: North America Synthetic Monitoring Industry Revenue (Million), by End-User Vertical 2024 & 2032
- Figure 15: North America Synthetic Monitoring Industry Revenue Share (%), by End-User Vertical 2024 & 2032
- Figure 16: North America Synthetic Monitoring Industry Revenue (Million), by Country 2024 & 2032
- Figure 17: North America Synthetic Monitoring Industry Revenue Share (%), by Country 2024 & 2032
- Figure 18: Europe Synthetic Monitoring Industry Revenue (Million), by Type 2024 & 2032
- Figure 19: Europe Synthetic Monitoring Industry Revenue Share (%), by Type 2024 & 2032
- Figure 20: Europe Synthetic Monitoring Industry Revenue (Million), by End-User Vertical 2024 & 2032
- Figure 21: Europe Synthetic Monitoring Industry Revenue Share (%), by End-User Vertical 2024 & 2032
- Figure 22: Europe Synthetic Monitoring Industry Revenue (Million), by Country 2024 & 2032
- Figure 23: Europe Synthetic Monitoring Industry Revenue Share (%), by Country 2024 & 2032
- Figure 24: Asia Pacific Synthetic Monitoring Industry Revenue (Million), by Type 2024 & 2032
- Figure 25: Asia Pacific Synthetic Monitoring Industry Revenue Share (%), by Type 2024 & 2032
- Figure 26: Asia Pacific Synthetic Monitoring Industry Revenue (Million), by End-User Vertical 2024 & 2032
- Figure 27: Asia Pacific Synthetic Monitoring Industry Revenue Share (%), by End-User Vertical 2024 & 2032
- Figure 28: Asia Pacific Synthetic Monitoring Industry Revenue (Million), by Country 2024 & 2032
- Figure 29: Asia Pacific Synthetic Monitoring Industry Revenue Share (%), by Country 2024 & 2032
- Figure 30: Latin America Synthetic Monitoring Industry Revenue (Million), by Type 2024 & 2032
- Figure 31: Latin America Synthetic Monitoring Industry Revenue Share (%), by Type 2024 & 2032
- Figure 32: Latin America Synthetic Monitoring Industry Revenue (Million), by End-User Vertical 2024 & 2032
- Figure 33: Latin America Synthetic Monitoring Industry Revenue Share (%), by End-User Vertical 2024 & 2032
- Figure 34: Latin America Synthetic Monitoring Industry Revenue (Million), by Country 2024 & 2032
- Figure 35: Latin America Synthetic Monitoring Industry Revenue Share (%), by Country 2024 & 2032
- Figure 36: Middle East and Africa Synthetic Monitoring Industry Revenue (Million), by Type 2024 & 2032
- Figure 37: Middle East and Africa Synthetic Monitoring Industry Revenue Share (%), by Type 2024 & 2032
- Figure 38: Middle East and Africa Synthetic Monitoring Industry Revenue (Million), by End-User Vertical 2024 & 2032
- Figure 39: Middle East and Africa Synthetic Monitoring Industry Revenue Share (%), by End-User Vertical 2024 & 2032
- Figure 40: Middle East and Africa Synthetic Monitoring Industry Revenue (Million), by Country 2024 & 2032
- Figure 41: Middle East and Africa Synthetic Monitoring Industry Revenue Share (%), by Country 2024 & 2032
List of Tables
- Table 1: Global Synthetic Monitoring Industry Revenue Million Forecast, by Region 2019 & 2032
- Table 2: Global Synthetic Monitoring Industry Revenue Million Forecast, by Type 2019 & 2032
- Table 3: Global Synthetic Monitoring Industry Revenue Million Forecast, by End-User Vertical 2019 & 2032
- Table 4: Global Synthetic Monitoring Industry Revenue Million Forecast, by Region 2019 & 2032
- Table 5: Global Synthetic Monitoring Industry Revenue Million Forecast, by Country 2019 & 2032
- Table 6: Synthetic Monitoring Industry Revenue (Million) Forecast, by Application 2019 & 2032
- Table 7: Global Synthetic Monitoring Industry Revenue Million Forecast, by Country 2019 & 2032
- Table 8: Synthetic Monitoring Industry Revenue (Million) Forecast, by Application 2019 & 2032
- Table 9: Global Synthetic Monitoring Industry Revenue Million Forecast, by Country 2019 & 2032
- Table 10: Synthetic Monitoring Industry Revenue (Million) Forecast, by Application 2019 & 2032
- Table 11: Global Synthetic Monitoring Industry Revenue Million Forecast, by Country 2019 & 2032
- Table 12: Synthetic Monitoring Industry Revenue (Million) Forecast, by Application 2019 & 2032
- Table 13: Global Synthetic Monitoring Industry Revenue Million Forecast, by Country 2019 & 2032
- Table 14: Synthetic Monitoring Industry Revenue (Million) Forecast, by Application 2019 & 2032
- Table 15: Global Synthetic Monitoring Industry Revenue Million Forecast, by Type 2019 & 2032
- Table 16: Global Synthetic Monitoring Industry Revenue Million Forecast, by End-User Vertical 2019 & 2032
- Table 17: Global Synthetic Monitoring Industry Revenue Million Forecast, by Country 2019 & 2032
- Table 18: Global Synthetic Monitoring Industry Revenue Million Forecast, by Type 2019 & 2032
- Table 19: Global Synthetic Monitoring Industry Revenue Million Forecast, by End-User Vertical 2019 & 2032
- Table 20: Global Synthetic Monitoring Industry Revenue Million Forecast, by Country 2019 & 2032
- Table 21: Global Synthetic Monitoring Industry Revenue Million Forecast, by Type 2019 & 2032
- Table 22: Global Synthetic Monitoring Industry Revenue Million Forecast, by End-User Vertical 2019 & 2032
- Table 23: Global Synthetic Monitoring Industry Revenue Million Forecast, by Country 2019 & 2032
- Table 24: Global Synthetic Monitoring Industry Revenue Million Forecast, by Type 2019 & 2032
- Table 25: Global Synthetic Monitoring Industry Revenue Million Forecast, by End-User Vertical 2019 & 2032
- Table 26: Global Synthetic Monitoring Industry Revenue Million Forecast, by Country 2019 & 2032
- Table 27: Global Synthetic Monitoring Industry Revenue Million Forecast, by Type 2019 & 2032
- Table 28: Global Synthetic Monitoring Industry Revenue Million Forecast, by End-User Vertical 2019 & 2032
- Table 29: Global Synthetic Monitoring Industry Revenue Million Forecast, by Country 2019 & 2032
Frequently Asked Questions
1. What is the projected Compound Annual Growth Rate (CAGR) of the Synthetic Monitoring Industry?
The projected CAGR is approximately 15.30%.
2. Which companies are prominent players in the Synthetic Monitoring Industry?
Key companies in the market include HP Enterprise Company, IBM Corporation, New Relic Inc, AppDynamics Inc (Cisco Systems Inc ), Rigor Inc, Smart Bear Software Inc, Broadcom Inc, BMC Software Inc, Monitis Inc , Oracle Corporation, Apica AB, Dell Technologies Inc, Dynatrace LLC, SolarWinds Inc.
3. What are the main segments of the Synthetic Monitoring Industry?
The market segments include Type, End-User Vertical.
4. Can you provide details about the market size?
The market size is estimated to be USD XX Million as of 2022.
5. What are some drivers contributing to market growth?
Increasing Need for Monitoring Service Level Agreement (SLA) Targets; Rising Demand for Application Performance Management; Increasing Need for DevOPs.
6. What are the notable trends driving market growth?
IT and Telecommunications is Expected to Show Significant Growth.
7. Are there any restraints impacting market growth?
Increased Demand for Outsourcing and Automation in Pharmaceutical Manufacturing.
8. Can you provide examples of recent developments in the market?
December 2022: Broadcom Inc. announced the availability of a new solution that enables enterprises to store their mainframe data anywhere they choose, including the Cloud. Broadcom's CA 1 flexible storage solution provides secure, cost-effective mainframe data storage options for hybrid IT environments, enabling customers to achieve dramatic cost savings and protect against ransomware.
9. What pricing options are available for accessing the report?
Pricing options include single-user, multi-user, and enterprise licenses priced at USD 4750, USD 5250, and USD 8750 respectively.
10. Is the market size provided in terms of value or volume?
The market size is provided in terms of value, measured in Million.
11. Are there any specific market keywords associated with the report?
Yes, the market keyword associated with the report is "Synthetic Monitoring Industry," which aids in identifying and referencing the specific market segment covered.
12. How do I determine which pricing option suits my needs best?
The pricing options vary based on user requirements and access needs. Individual users may opt for single-user licenses, while businesses requiring broader access may choose multi-user or enterprise licenses for cost-effective access to the report.
13. Are there any additional resources or data provided in the Synthetic Monitoring Industry report?
While the report offers comprehensive insights, it's advisable to review the specific contents or supplementary materials provided to ascertain if additional resources or data are available.
14. How can I stay updated on further developments or reports in the Synthetic Monitoring Industry?
To stay informed about further developments, trends, and reports in the Synthetic Monitoring Industry, consider subscribing to industry newsletters, following relevant companies and organizations, or regularly checking reputable industry news sources and publications.
Methodology
Step 1 - Identification of Relevant Samples Size from Population Database


Step 2 - Approaches for Defining Global Market Size (Value, Volume* & Price*)

Note*: In applicable scenarios
Step 3 - Data Sources
Primary Research
- Web Analytics
- Survey Reports
- Research Institute
- Latest Research Reports
- Opinion Leaders
Secondary Research
- Annual Reports
- White Paper
- Latest Press Release
- Industry Association
- Paid Database
- Investor Presentations

Step 4 - Data Triangulation
Involves using different sources of information in order to increase the validity of a study
These sources are likely to be stakeholders in a program - participants, other researchers, program staff, other community members, and so on.
Then we put all data in single framework & apply various statistical tools to find out the dynamic on the market.
During the analysis stage, feedback from the stakeholder groups would be compared to determine areas of agreement as well as areas of divergence
