

Key Insights
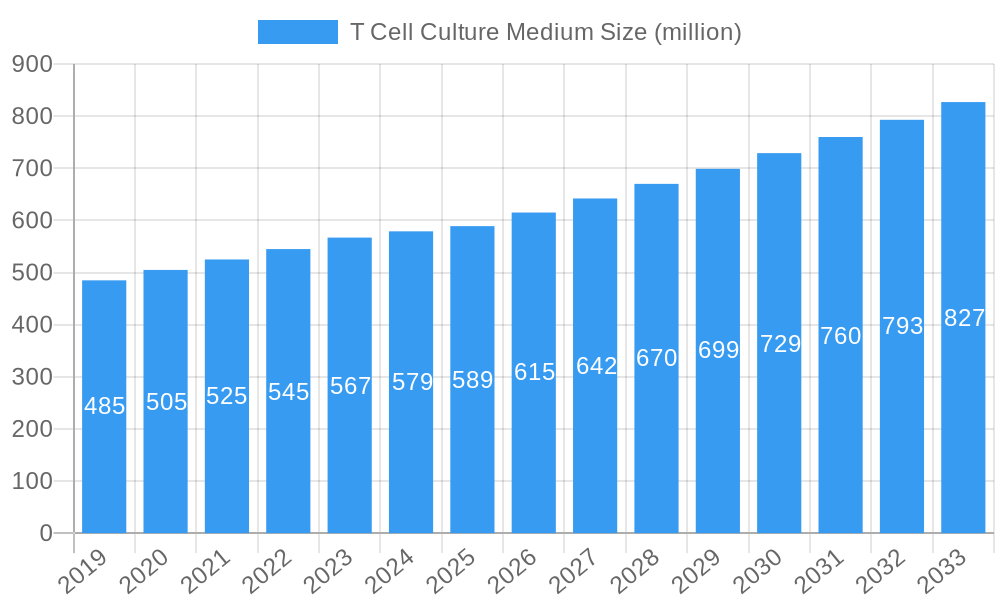
The global T Cell Culture Medium market is poised for robust expansion, projected to reach $589 million by 2025, with an anticipated Compound Annual Growth Rate (CAGR) of 4.7% from 2019 to 2033. This growth is primarily propelled by the escalating demand for advanced cell-based therapies and immunotherapies, particularly in the fields of oncology and autoimmune disorders. The increasing investments in research and development within academic institutions and biological laboratories, coupled with the growing adoption of T cell-based diagnostics, are significant drivers. Furthermore, the technological advancements in developing specialized T cell culture media formulations that enhance cell viability, expansion, and functionality are also contributing to market expansion. The rise of personalized medicine and the expanding applications of T cells in regenerative medicine further underscore the positive market trajectory.
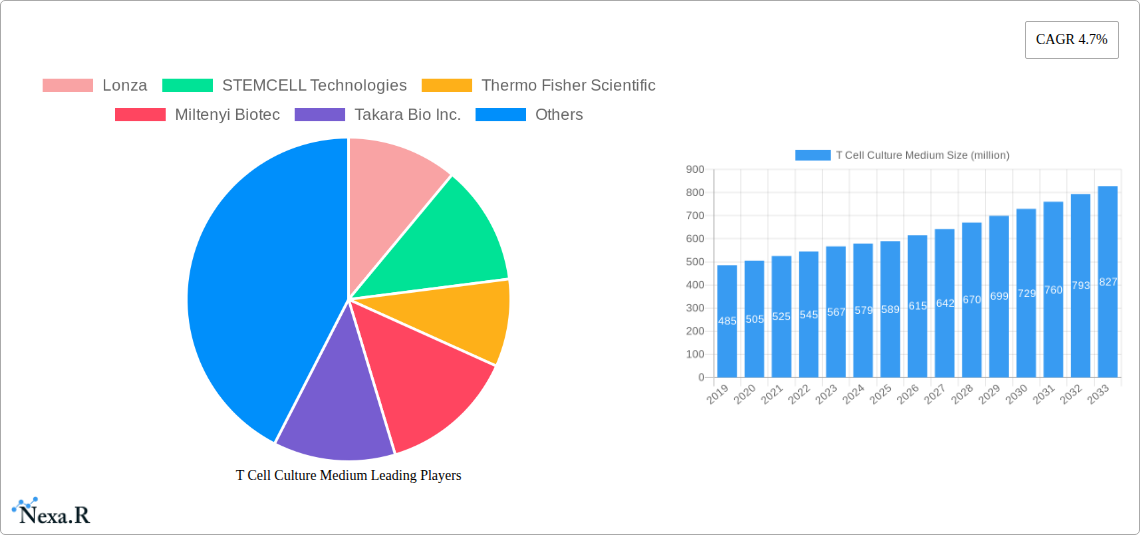
T Cell Culture Medium Market Size (In Million)
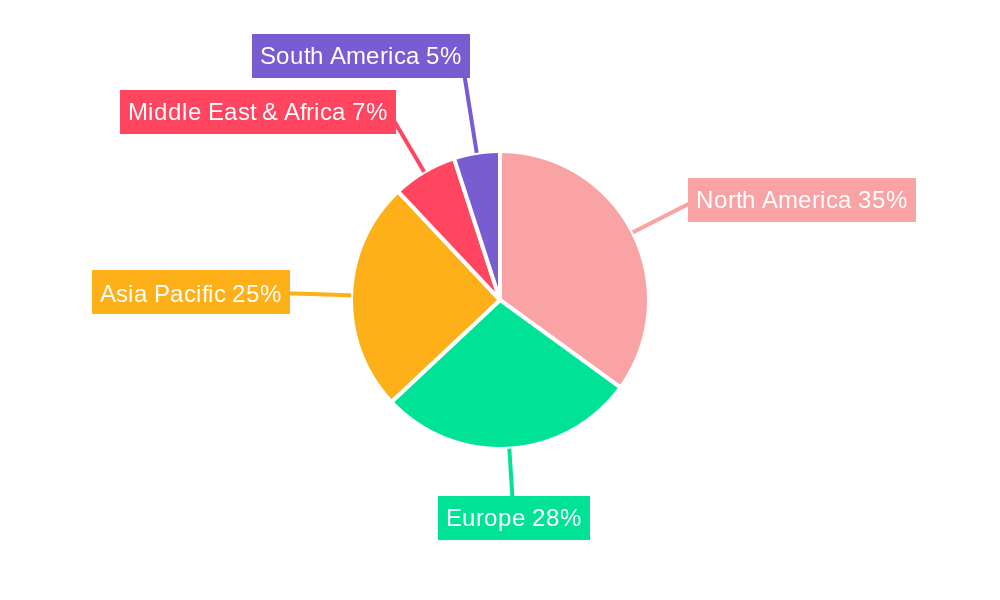
The market segmentation reveals a strong presence of biological laboratories and universities as key application segments, reflecting their pivotal role in T cell research and therapeutic development. The 500ML and 250ML types are expected to dominate, catering to both large-scale research initiatives and niche applications. Geographically, North America is anticipated to lead the market, driven by substantial R&D expenditure, a well-established biotechnology ecosystem, and early adoption of innovative T cell therapies. Asia Pacific is expected to exhibit the fastest growth, fueled by increasing healthcare investments, a burgeoning pharmaceutical industry, and a growing pool of researchers. Restraints such as the high cost of specialized media and stringent regulatory requirements are being progressively mitigated by innovations and strategic collaborations among key players like Lonza, STEMCELL Technologies, and Thermo Fisher Scientific.
T Cell Culture Medium Company Market Share
T Cell Culture Medium Market: Comprehensive Analysis and Forecast (2019–2033)
This in-depth report provides a thorough analysis of the global T Cell Culture Medium market, encompassing its dynamics, growth trends, regional dominance, product landscape, key drivers and challenges, emerging opportunities, and future outlook. Leveraging extensive research and industry data, this report is an indispensable resource for stakeholders seeking to understand and capitalize on the evolving T Cell Culture Medium landscape.
T Cell Culture Medium Market Dynamics & Structure
The T Cell Culture Medium market exhibits a moderately concentrated structure, with leading players such as Lonza, STEMCELL Technologies, Thermo Fisher Scientific, Miltenyi Biotec, Takara Bio Inc., Sartorius AG, FUJIFILM, and ExCell Bio holding significant market shares. Technological innovation is a primary driver, fueled by advancements in cell therapy research, immunotherapy development, and the growing need for personalized medicine. Regulatory frameworks, while evolving, play a crucial role in ensuring product quality and safety, influencing market entry and product development. Competitive product substitutes, though less prevalent for specialized T cell applications, primarily include alternative cell culture media formulations and basic reagents. End-user demographics are diverse, spanning academic research institutions, pharmaceutical and biotechnology companies, contract research organizations (CROs), and diagnostic laboratories. Mergers and acquisitions (M&A) trends indicate a strategic consolidation to enhance product portfolios, expand geographical reach, and secure market leadership. For instance, recent M&A activity has seen larger entities acquiring smaller, innovative biotech firms specializing in cell culture technologies. The market concentration is estimated at approximately 60% held by the top four players. M&A deal volumes are projected to remain steady, with an estimated 8-12 significant transactions annually. Innovation barriers include the high cost of research and development, stringent regulatory approval processes, and the need for specialized expertise in cell biology.
T Cell Culture Medium Growth Trends & Insights
The global T Cell Culture Medium market is poised for robust growth, driven by escalating investments in cell-based therapies, a surge in cancer research, and the expanding applications of T cells in various therapeutic areas. Our analysis projects a Compound Annual Growth Rate (CAGR) of approximately 11.5% for the forecast period of 2025–2033. The market size for T Cell Culture Medium, which stood at an estimated $850 million in 2024, is anticipated to reach $1.8 billion by 2033. Adoption rates are accelerating, particularly within the biotechnology and pharmaceutical sectors, where T cell therapies like CAR-T cell therapy are gaining significant traction. Technological disruptions are continually reshaping the market, with innovations focusing on improving T cell viability, functionality, and expansion efficiency. This includes the development of serum-free and chemically defined media, which offer greater consistency and reproducibility in experimental results. Consumer behavior shifts are evident, with researchers increasingly demanding customized media formulations tailored to specific T cell subtypes and experimental protocols. Furthermore, the growing emphasis on personalized medicine and the increasing prevalence of chronic diseases are creating sustained demand for advanced T cell culture solutions. The market penetration of specialized T cell culture media is estimated to be around 45% in 2024, with expectations to reach over 60% by 2033. The rising adoption of automated cell culture systems also contributes to the market's expansion, enabling higher throughput and more efficient T cell production.
Dominant Regions, Countries, or Segments in T Cell Culture Medium
The North America region is currently the dominant force in the global T Cell Culture Medium market, driven by its robust biotechnology and pharmaceutical infrastructure, substantial government funding for life sciences research, and a high prevalence of T cell therapy development. The United States, in particular, represents a significant market share, estimated at 45% of the global market in 2024, due to its pioneering role in CAR-T cell therapy and a thriving ecosystem of academic institutions and biopharmaceutical companies. Universities within North America, such as the University of Pennsylvania and Memorial Sloan Kettering Cancer Center, are at the forefront of T cell research, driving demand for advanced culture media.
Key Drivers in North America:
- Strong R&D Investment: Significant private and public investment in life sciences research and development.
- Leading Pharmaceutical & Biotech Hubs: Concentration of major pharmaceutical companies and innovative biotech startups.
- Advanced Healthcare Infrastructure: Well-developed healthcare systems and widespread adoption of advanced medical treatments.
- Favorable Regulatory Environment: Streamlined regulatory pathways for novel therapies and research.
Dominance Factors: The region's dominance is further bolstered by the presence of key market players like Lonza and Thermo Fisher Scientific, which have strong established distribution networks and manufacturing capabilities in North America. The application segment of Biological Laboratory also holds a significant share, reflecting the extensive use of T cell culture media in basic research, drug discovery, and preclinical studies.
Growth Potential in Other Segments: While North America leads, the Asia Pacific region is emerging as a high-growth market, fueled by increasing healthcare expenditure, expanding biopharmaceutical sectors in countries like China and India, and growing government initiatives to promote biotechnology research. Europe also represents a substantial market, with countries like Germany and the UK contributing significantly due to their strong academic research base and established biopharmaceutical industries. The "Others" segment for Application is also showing promising growth, encompassing areas like veterinary medicine and industrial biotechnology. For Types, while 250ML and 500ML are standard, the "Others" category, representing custom formulations and larger bulk quantities for commercial manufacturing, is projected to witness substantial growth as cell therapy production scales up.
T Cell Culture Medium Product Landscape
The T Cell Culture Medium product landscape is characterized by continuous innovation aimed at enhancing T cell expansion, viability, and functionality for diverse therapeutic and research applications. Key product advancements include the development of serum-free and chemically defined media formulations, which minimize lot-to-lot variability and reduce the risk of contamination. Many products now incorporate optimized combinations of growth factors, cytokines, and nutrients tailored for specific T cell subsets (e.g., CD4+, CD8+, regulatory T cells). Performance metrics are increasingly focused on achieving high cell yields with superior cell phenotype and effector function. Unique selling propositions often revolve around enhanced T cell activation, improved persistence in vivo, and reduced manufacturing costs. Technological advancements are also leading to media formulations that support the scale-up of T cell cultures for clinical applications.
Key Drivers, Barriers & Challenges in T Cell Culture Medium
Key Drivers:
- Rising Incidence of Cancer and Autoimmune Diseases: Increased demand for T cell-based immunotherapies.
- Advancements in Cell Therapy Research: Growing success and investment in CAR-T, TCR-T, and TIL therapies.
- Expanding Applications in Regenerative Medicine: T cell expansion for tissue repair and regeneration.
- Government Funding and Initiatives: Increased support for biotechnology and cell therapy research.
- Technological Innovations: Development of serum-free, defined, and optimized media for improved cell performance.
Barriers & Challenges:
- High Cost of Production and R&D: Complex manufacturing processes and extensive research required.
- Stringent Regulatory Hurdles: Navigating complex approval processes for clinical applications.
- Supply Chain Complexities: Ensuring the consistent availability of high-quality raw materials.
- Competition and Pricing Pressures: Market competition from established and emerging players.
- Need for Specialized Expertise: Requirement for skilled personnel in cell culture and related fields.
- Scalability Challenges: Transitioning from lab-scale to commercial-scale T cell production can be difficult. The global supply chain for critical raw materials faced disruptions estimated at 15% in 2022, impacting production timelines and costs.
Emerging Opportunities in T Cell Culture Medium
Emerging opportunities in the T Cell Culture Medium market lie in the development of personalized and patient-specific media formulations to enhance the efficacy of cell therapies. The growing interest in engineered T cells beyond CAR-T, such as NK-T cells and gamma delta T cells, presents a significant untapped market. Furthermore, the expansion of T cell applications into infectious diseases and autoimmune disorders, beyond oncology, offers new avenues for growth. The increasing demand for closed-system cell culture solutions, which minimize contamination risk and improve workflow efficiency, also represents a lucrative segment. The integration of AI and machine learning in optimizing media composition and culture conditions for predictive outcomes is another exciting frontier.
Growth Accelerators in the T Cell Culture Medium Industry
Growth accelerators in the T Cell Culture Medium industry are largely driven by continued technological breakthroughs in optimizing cell expansion and functionality, coupled with strategic partnerships between media manufacturers and leading cell therapy developers. The expanding pipeline of T cell-based therapies across various indications is a major catalyst. Furthermore, market expansion strategies by key players, including geographical diversification and the development of cost-effective solutions for emerging markets, are fueling long-term growth. The increasing adoption of T cell culture for diagnostic purposes and in bioprocessing for other biologics also contributes to sustained market expansion. The development of novel cytokines and growth factors with enhanced potency and specificity will further accelerate growth.
Key Players Shaping the T Cell Culture Medium Market
- Lonza
- STEMCELL Technologies
- Thermo Fisher Scientific
- Miltenyi Biotec
- Takara Bio Inc.
- Sartorius AG
- FUJIFILM
- ExCell Bio
Notable Milestones in T Cell Culture Medium Sector
- 2019: Launch of advanced chemically defined media for CAR-T cell expansion by major players.
- 2020: Increased investment in R&D for novel cytokine cocktails to enhance T cell potency.
- 2021: Acquisition of specialized cell culture media companies by larger biotechnology firms to bolster portfolios.
- 2022: Significant advancements in serum-free media formulations leading to improved T cell viability and function.
- 2023: Growing adoption of T cell culture media in preclinical studies for a broader range of autoimmune diseases.
- 2024: Emergence of customized media solutions tailored for specific T cell subsets and therapeutic targets.
In-Depth T Cell Culture Medium Market Outlook
The T Cell Culture Medium market is set for continued strong growth, propelled by the unrelenting demand for advanced cell therapies and ongoing research into novel T cell applications. The shift towards chemically defined and serum-free media will remain a dominant trend, offering enhanced reproducibility and safety profiles essential for clinical translation. Strategic collaborations and partnerships between media manufacturers and cell therapy developers will be crucial in accelerating product development and market penetration. Geographical expansion, particularly in Asia Pacific, presents significant untapped potential. The market will also witness increased focus on cost optimization and scalability solutions to support the burgeoning demand for commercially viable cell therapies. The future looks promising for innovative solutions that enhance T cell manufacturing efficiency and therapeutic outcomes.
T Cell Culture Medium Segmentation
-
1. Application
- 1.1. Biological Laboratory
- 1.2. University
- 1.3. Others
-
2. Types
- 2.1. 250ML
- 2.2. 500ML
- 2.3. Others
T Cell Culture Medium Segmentation By Geography
-
1. North America
- 1.1. United States
- 1.2. Canada
- 1.3. Mexico
-
2. South America
- 2.1. Brazil
- 2.2. Argentina
- 2.3. Rest of South America
-
3. Europe
- 3.1. United Kingdom
- 3.2. Germany
- 3.3. France
- 3.4. Italy
- 3.5. Spain
- 3.6. Russia
- 3.7. Benelux
- 3.8. Nordics
- 3.9. Rest of Europe
-
4. Middle East & Africa
- 4.1. Turkey
- 4.2. Israel
- 4.3. GCC
- 4.4. North Africa
- 4.5. South Africa
- 4.6. Rest of Middle East & Africa
-
5. Asia Pacific
- 5.1. China
- 5.2. India
- 5.3. Japan
- 5.4. South Korea
- 5.5. ASEAN
- 5.6. Oceania
- 5.7. Rest of Asia Pacific
T Cell Culture Medium Regional Market Share
Geographic Coverage of T Cell Culture Medium
T Cell Culture Medium REPORT HIGHLIGHTS
| Aspects | Details |
|---|---|
| Study Period | 2020-2034 |
| Base Year | 2025 |
| Estimated Year | 2026 |
| Forecast Period | 2026-2034 |
| Historical Period | 2020-2025 |
| Growth Rate | CAGR of 4.7% from 2020-2034 |
| Segmentation |
|
Table of Contents
- 1. Introduction
- 1.1. Research Scope
- 1.2. Market Segmentation
- 1.3. Research Objective
- 1.4. Definitions and Assumptions
- 2. Executive Summary
- 2.1. Market Snapshot
- 3. Market Dynamics
- 3.1. Market Drivers
- 3.2. Market Restrains
- 3.3. Market Trends
- 3.4. Market Opportunities
- 4. Market Factor Analysis
- 4.1. Porters Five Forces
- 4.1.1. Bargaining Power of Suppliers
- 4.1.2. Bargaining Power of Buyers
- 4.1.3. Threat of New Entrants
- 4.1.4. Threat of Substitutes
- 4.1.5. Competitive Rivalry
- 4.2. PESTEL analysis
- 4.3. BCG Analysis
- 4.3.1. Stars (High Growth, High Market Share)
- 4.3.2. Cash Cows (Low Growth, High Market Share)
- 4.3.3. Question Mark (High Growth, Low Market Share)
- 4.3.4. Dogs (Low Growth, Low Market Share)
- 4.4. Ansoff Matrix Analysis
- 4.5. Supply Chain Analysis
- 4.6. Regulatory Landscape
- 4.7. Current Market Potential and Opportunity Assessment (TAM–SAM–SOM Framework)
- 4.8. NRP Analyst Note
- 4.1. Porters Five Forces
- 5. Market Analysis, Insights and Forecast 2021-2033
- 5.1. Market Analysis, Insights and Forecast - by Application
- 5.1.1. Biological Laboratory
- 5.1.2. University
- 5.1.3. Others
- 5.2. Market Analysis, Insights and Forecast - by Types
- 5.2.1. 250ML
- 5.2.2. 500ML
- 5.2.3. Others
- 5.3. Market Analysis, Insights and Forecast - by Region
- 5.3.1. North America
- 5.3.2. South America
- 5.3.3. Europe
- 5.3.4. Middle East & Africa
- 5.3.5. Asia Pacific
- 5.1. Market Analysis, Insights and Forecast - by Application
- 6. Global T Cell Culture Medium Analysis, Insights and Forecast, 2021-2033
- 6.1. Market Analysis, Insights and Forecast - by Application
- 6.1.1. Biological Laboratory
- 6.1.2. University
- 6.1.3. Others
- 6.2. Market Analysis, Insights and Forecast - by Types
- 6.2.1. 250ML
- 6.2.2. 500ML
- 6.2.3. Others
- 6.1. Market Analysis, Insights and Forecast - by Application
- 7. North America T Cell Culture Medium Analysis, Insights and Forecast, 2020-2032
- 7.1. Market Analysis, Insights and Forecast - by Application
- 7.1.1. Biological Laboratory
- 7.1.2. University
- 7.1.3. Others
- 7.2. Market Analysis, Insights and Forecast - by Types
- 7.2.1. 250ML
- 7.2.2. 500ML
- 7.2.3. Others
- 7.1. Market Analysis, Insights and Forecast - by Application
- 8. South America T Cell Culture Medium Analysis, Insights and Forecast, 2020-2032
- 8.1. Market Analysis, Insights and Forecast - by Application
- 8.1.1. Biological Laboratory
- 8.1.2. University
- 8.1.3. Others
- 8.2. Market Analysis, Insights and Forecast - by Types
- 8.2.1. 250ML
- 8.2.2. 500ML
- 8.2.3. Others
- 8.1. Market Analysis, Insights and Forecast - by Application
- 9. Europe T Cell Culture Medium Analysis, Insights and Forecast, 2020-2032
- 9.1. Market Analysis, Insights and Forecast - by Application
- 9.1.1. Biological Laboratory
- 9.1.2. University
- 9.1.3. Others
- 9.2. Market Analysis, Insights and Forecast - by Types
- 9.2.1. 250ML
- 9.2.2. 500ML
- 9.2.3. Others
- 9.1. Market Analysis, Insights and Forecast - by Application
- 10. Middle East & Africa T Cell Culture Medium Analysis, Insights and Forecast, 2020-2032
- 10.1. Market Analysis, Insights and Forecast - by Application
- 10.1.1. Biological Laboratory
- 10.1.2. University
- 10.1.3. Others
- 10.2. Market Analysis, Insights and Forecast - by Types
- 10.2.1. 250ML
- 10.2.2. 500ML
- 10.2.3. Others
- 10.1. Market Analysis, Insights and Forecast - by Application
- 11. Asia Pacific T Cell Culture Medium Analysis, Insights and Forecast, 2020-2032
- 11.1. Market Analysis, Insights and Forecast - by Application
- 11.1.1. Biological Laboratory
- 11.1.2. University
- 11.1.3. Others
- 11.2. Market Analysis, Insights and Forecast - by Types
- 11.2.1. 250ML
- 11.2.2. 500ML
- 11.2.3. Others
- 11.1. Market Analysis, Insights and Forecast - by Application
- 12. Competitive Analysis
- 12.1. Company Profiles
- 12.1.1 Lonza
- 12.1.1.1. Company Overview
- 12.1.1.2. Products
- 12.1.1.3. Company Financials
- 12.1.1.4. SWOT Analysis
- 12.1.2 STEMCELL Technologies
- 12.1.2.1. Company Overview
- 12.1.2.2. Products
- 12.1.2.3. Company Financials
- 12.1.2.4. SWOT Analysis
- 12.1.3 Thermo Fisher Scientific
- 12.1.3.1. Company Overview
- 12.1.3.2. Products
- 12.1.3.3. Company Financials
- 12.1.3.4. SWOT Analysis
- 12.1.4 Miltenyi Biotec
- 12.1.4.1. Company Overview
- 12.1.4.2. Products
- 12.1.4.3. Company Financials
- 12.1.4.4. SWOT Analysis
- 12.1.5 Takara Bio Inc.
- 12.1.5.1. Company Overview
- 12.1.5.2. Products
- 12.1.5.3. Company Financials
- 12.1.5.4. SWOT Analysis
- 12.1.6 Sartorius AG
- 12.1.6.1. Company Overview
- 12.1.6.2. Products
- 12.1.6.3. Company Financials
- 12.1.6.4. SWOT Analysis
- 12.1.7 FUJIFILM
- 12.1.7.1. Company Overview
- 12.1.7.2. Products
- 12.1.7.3. Company Financials
- 12.1.7.4. SWOT Analysis
- 12.1.8 ExCell Bio
- 12.1.8.1. Company Overview
- 12.1.8.2. Products
- 12.1.8.3. Company Financials
- 12.1.8.4. SWOT Analysis
- 12.1.1 Lonza
- 12.2. Market Entropy
- 12.2.1 Company's Key Areas Served
- 12.2.2 Recent Developments
- 12.3. Company Market Share Analysis 2025
- 12.3.1 Top 5 Companies Market Share Analysis
- 12.3.2 Top 3 Companies Market Share Analysis
- 12.4. List of Potential Customers
- 13. Research Methodology
List of Figures
- Figure 1: Global T Cell Culture Medium Revenue Breakdown (million, %) by Region 2025 & 2033
- Figure 2: Global T Cell Culture Medium Volume Breakdown (K, %) by Region 2025 & 2033
- Figure 3: North America T Cell Culture Medium Revenue (million), by Application 2025 & 2033
- Figure 4: North America T Cell Culture Medium Volume (K), by Application 2025 & 2033
- Figure 5: North America T Cell Culture Medium Revenue Share (%), by Application 2025 & 2033
- Figure 6: North America T Cell Culture Medium Volume Share (%), by Application 2025 & 2033
- Figure 7: North America T Cell Culture Medium Revenue (million), by Types 2025 & 2033
- Figure 8: North America T Cell Culture Medium Volume (K), by Types 2025 & 2033
- Figure 9: North America T Cell Culture Medium Revenue Share (%), by Types 2025 & 2033
- Figure 10: North America T Cell Culture Medium Volume Share (%), by Types 2025 & 2033
- Figure 11: North America T Cell Culture Medium Revenue (million), by Country 2025 & 2033
- Figure 12: North America T Cell Culture Medium Volume (K), by Country 2025 & 2033
- Figure 13: North America T Cell Culture Medium Revenue Share (%), by Country 2025 & 2033
- Figure 14: North America T Cell Culture Medium Volume Share (%), by Country 2025 & 2033
- Figure 15: South America T Cell Culture Medium Revenue (million), by Application 2025 & 2033
- Figure 16: South America T Cell Culture Medium Volume (K), by Application 2025 & 2033
- Figure 17: South America T Cell Culture Medium Revenue Share (%), by Application 2025 & 2033
- Figure 18: South America T Cell Culture Medium Volume Share (%), by Application 2025 & 2033
- Figure 19: South America T Cell Culture Medium Revenue (million), by Types 2025 & 2033
- Figure 20: South America T Cell Culture Medium Volume (K), by Types 2025 & 2033
- Figure 21: South America T Cell Culture Medium Revenue Share (%), by Types 2025 & 2033
- Figure 22: South America T Cell Culture Medium Volume Share (%), by Types 2025 & 2033
- Figure 23: South America T Cell Culture Medium Revenue (million), by Country 2025 & 2033
- Figure 24: South America T Cell Culture Medium Volume (K), by Country 2025 & 2033
- Figure 25: South America T Cell Culture Medium Revenue Share (%), by Country 2025 & 2033
- Figure 26: South America T Cell Culture Medium Volume Share (%), by Country 2025 & 2033
- Figure 27: Europe T Cell Culture Medium Revenue (million), by Application 2025 & 2033
- Figure 28: Europe T Cell Culture Medium Volume (K), by Application 2025 & 2033
- Figure 29: Europe T Cell Culture Medium Revenue Share (%), by Application 2025 & 2033
- Figure 30: Europe T Cell Culture Medium Volume Share (%), by Application 2025 & 2033
- Figure 31: Europe T Cell Culture Medium Revenue (million), by Types 2025 & 2033
- Figure 32: Europe T Cell Culture Medium Volume (K), by Types 2025 & 2033
- Figure 33: Europe T Cell Culture Medium Revenue Share (%), by Types 2025 & 2033
- Figure 34: Europe T Cell Culture Medium Volume Share (%), by Types 2025 & 2033
- Figure 35: Europe T Cell Culture Medium Revenue (million), by Country 2025 & 2033
- Figure 36: Europe T Cell Culture Medium Volume (K), by Country 2025 & 2033
- Figure 37: Europe T Cell Culture Medium Revenue Share (%), by Country 2025 & 2033
- Figure 38: Europe T Cell Culture Medium Volume Share (%), by Country 2025 & 2033
- Figure 39: Middle East & Africa T Cell Culture Medium Revenue (million), by Application 2025 & 2033
- Figure 40: Middle East & Africa T Cell Culture Medium Volume (K), by Application 2025 & 2033
- Figure 41: Middle East & Africa T Cell Culture Medium Revenue Share (%), by Application 2025 & 2033
- Figure 42: Middle East & Africa T Cell Culture Medium Volume Share (%), by Application 2025 & 2033
- Figure 43: Middle East & Africa T Cell Culture Medium Revenue (million), by Types 2025 & 2033
- Figure 44: Middle East & Africa T Cell Culture Medium Volume (K), by Types 2025 & 2033
- Figure 45: Middle East & Africa T Cell Culture Medium Revenue Share (%), by Types 2025 & 2033
- Figure 46: Middle East & Africa T Cell Culture Medium Volume Share (%), by Types 2025 & 2033
- Figure 47: Middle East & Africa T Cell Culture Medium Revenue (million), by Country 2025 & 2033
- Figure 48: Middle East & Africa T Cell Culture Medium Volume (K), by Country 2025 & 2033
- Figure 49: Middle East & Africa T Cell Culture Medium Revenue Share (%), by Country 2025 & 2033
- Figure 50: Middle East & Africa T Cell Culture Medium Volume Share (%), by Country 2025 & 2033
- Figure 51: Asia Pacific T Cell Culture Medium Revenue (million), by Application 2025 & 2033
- Figure 52: Asia Pacific T Cell Culture Medium Volume (K), by Application 2025 & 2033
- Figure 53: Asia Pacific T Cell Culture Medium Revenue Share (%), by Application 2025 & 2033
- Figure 54: Asia Pacific T Cell Culture Medium Volume Share (%), by Application 2025 & 2033
- Figure 55: Asia Pacific T Cell Culture Medium Revenue (million), by Types 2025 & 2033
- Figure 56: Asia Pacific T Cell Culture Medium Volume (K), by Types 2025 & 2033
- Figure 57: Asia Pacific T Cell Culture Medium Revenue Share (%), by Types 2025 & 2033
- Figure 58: Asia Pacific T Cell Culture Medium Volume Share (%), by Types 2025 & 2033
- Figure 59: Asia Pacific T Cell Culture Medium Revenue (million), by Country 2025 & 2033
- Figure 60: Asia Pacific T Cell Culture Medium Volume (K), by Country 2025 & 2033
- Figure 61: Asia Pacific T Cell Culture Medium Revenue Share (%), by Country 2025 & 2033
- Figure 62: Asia Pacific T Cell Culture Medium Volume Share (%), by Country 2025 & 2033
List of Tables
- Table 1: Global T Cell Culture Medium Revenue million Forecast, by Application 2020 & 2033
- Table 2: Global T Cell Culture Medium Volume K Forecast, by Application 2020 & 2033
- Table 3: Global T Cell Culture Medium Revenue million Forecast, by Types 2020 & 2033
- Table 4: Global T Cell Culture Medium Volume K Forecast, by Types 2020 & 2033
- Table 5: Global T Cell Culture Medium Revenue million Forecast, by Region 2020 & 2033
- Table 6: Global T Cell Culture Medium Volume K Forecast, by Region 2020 & 2033
- Table 7: Global T Cell Culture Medium Revenue million Forecast, by Application 2020 & 2033
- Table 8: Global T Cell Culture Medium Volume K Forecast, by Application 2020 & 2033
- Table 9: Global T Cell Culture Medium Revenue million Forecast, by Types 2020 & 2033
- Table 10: Global T Cell Culture Medium Volume K Forecast, by Types 2020 & 2033
- Table 11: Global T Cell Culture Medium Revenue million Forecast, by Country 2020 & 2033
- Table 12: Global T Cell Culture Medium Volume K Forecast, by Country 2020 & 2033
- Table 13: United States T Cell Culture Medium Revenue (million) Forecast, by Application 2020 & 2033
- Table 14: United States T Cell Culture Medium Volume (K) Forecast, by Application 2020 & 2033
- Table 15: Canada T Cell Culture Medium Revenue (million) Forecast, by Application 2020 & 2033
- Table 16: Canada T Cell Culture Medium Volume (K) Forecast, by Application 2020 & 2033
- Table 17: Mexico T Cell Culture Medium Revenue (million) Forecast, by Application 2020 & 2033
- Table 18: Mexico T Cell Culture Medium Volume (K) Forecast, by Application 2020 & 2033
- Table 19: Global T Cell Culture Medium Revenue million Forecast, by Application 2020 & 2033
- Table 20: Global T Cell Culture Medium Volume K Forecast, by Application 2020 & 2033
- Table 21: Global T Cell Culture Medium Revenue million Forecast, by Types 2020 & 2033
- Table 22: Global T Cell Culture Medium Volume K Forecast, by Types 2020 & 2033
- Table 23: Global T Cell Culture Medium Revenue million Forecast, by Country 2020 & 2033
- Table 24: Global T Cell Culture Medium Volume K Forecast, by Country 2020 & 2033
- Table 25: Brazil T Cell Culture Medium Revenue (million) Forecast, by Application 2020 & 2033
- Table 26: Brazil T Cell Culture Medium Volume (K) Forecast, by Application 2020 & 2033
- Table 27: Argentina T Cell Culture Medium Revenue (million) Forecast, by Application 2020 & 2033
- Table 28: Argentina T Cell Culture Medium Volume (K) Forecast, by Application 2020 & 2033
- Table 29: Rest of South America T Cell Culture Medium Revenue (million) Forecast, by Application 2020 & 2033
- Table 30: Rest of South America T Cell Culture Medium Volume (K) Forecast, by Application 2020 & 2033
- Table 31: Global T Cell Culture Medium Revenue million Forecast, by Application 2020 & 2033
- Table 32: Global T Cell Culture Medium Volume K Forecast, by Application 2020 & 2033
- Table 33: Global T Cell Culture Medium Revenue million Forecast, by Types 2020 & 2033
- Table 34: Global T Cell Culture Medium Volume K Forecast, by Types 2020 & 2033
- Table 35: Global T Cell Culture Medium Revenue million Forecast, by Country 2020 & 2033
- Table 36: Global T Cell Culture Medium Volume K Forecast, by Country 2020 & 2033
- Table 37: United Kingdom T Cell Culture Medium Revenue (million) Forecast, by Application 2020 & 2033
- Table 38: United Kingdom T Cell Culture Medium Volume (K) Forecast, by Application 2020 & 2033
- Table 39: Germany T Cell Culture Medium Revenue (million) Forecast, by Application 2020 & 2033
- Table 40: Germany T Cell Culture Medium Volume (K) Forecast, by Application 2020 & 2033
- Table 41: France T Cell Culture Medium Revenue (million) Forecast, by Application 2020 & 2033
- Table 42: France T Cell Culture Medium Volume (K) Forecast, by Application 2020 & 2033
- Table 43: Italy T Cell Culture Medium Revenue (million) Forecast, by Application 2020 & 2033
- Table 44: Italy T Cell Culture Medium Volume (K) Forecast, by Application 2020 & 2033
- Table 45: Spain T Cell Culture Medium Revenue (million) Forecast, by Application 2020 & 2033
- Table 46: Spain T Cell Culture Medium Volume (K) Forecast, by Application 2020 & 2033
- Table 47: Russia T Cell Culture Medium Revenue (million) Forecast, by Application 2020 & 2033
- Table 48: Russia T Cell Culture Medium Volume (K) Forecast, by Application 2020 & 2033
- Table 49: Benelux T Cell Culture Medium Revenue (million) Forecast, by Application 2020 & 2033
- Table 50: Benelux T Cell Culture Medium Volume (K) Forecast, by Application 2020 & 2033
- Table 51: Nordics T Cell Culture Medium Revenue (million) Forecast, by Application 2020 & 2033
- Table 52: Nordics T Cell Culture Medium Volume (K) Forecast, by Application 2020 & 2033
- Table 53: Rest of Europe T Cell Culture Medium Revenue (million) Forecast, by Application 2020 & 2033
- Table 54: Rest of Europe T Cell Culture Medium Volume (K) Forecast, by Application 2020 & 2033
- Table 55: Global T Cell Culture Medium Revenue million Forecast, by Application 2020 & 2033
- Table 56: Global T Cell Culture Medium Volume K Forecast, by Application 2020 & 2033
- Table 57: Global T Cell Culture Medium Revenue million Forecast, by Types 2020 & 2033
- Table 58: Global T Cell Culture Medium Volume K Forecast, by Types 2020 & 2033
- Table 59: Global T Cell Culture Medium Revenue million Forecast, by Country 2020 & 2033
- Table 60: Global T Cell Culture Medium Volume K Forecast, by Country 2020 & 2033
- Table 61: Turkey T Cell Culture Medium Revenue (million) Forecast, by Application 2020 & 2033
- Table 62: Turkey T Cell Culture Medium Volume (K) Forecast, by Application 2020 & 2033
- Table 63: Israel T Cell Culture Medium Revenue (million) Forecast, by Application 2020 & 2033
- Table 64: Israel T Cell Culture Medium Volume (K) Forecast, by Application 2020 & 2033
- Table 65: GCC T Cell Culture Medium Revenue (million) Forecast, by Application 2020 & 2033
- Table 66: GCC T Cell Culture Medium Volume (K) Forecast, by Application 2020 & 2033
- Table 67: North Africa T Cell Culture Medium Revenue (million) Forecast, by Application 2020 & 2033
- Table 68: North Africa T Cell Culture Medium Volume (K) Forecast, by Application 2020 & 2033
- Table 69: South Africa T Cell Culture Medium Revenue (million) Forecast, by Application 2020 & 2033
- Table 70: South Africa T Cell Culture Medium Volume (K) Forecast, by Application 2020 & 2033
- Table 71: Rest of Middle East & Africa T Cell Culture Medium Revenue (million) Forecast, by Application 2020 & 2033
- Table 72: Rest of Middle East & Africa T Cell Culture Medium Volume (K) Forecast, by Application 2020 & 2033
- Table 73: Global T Cell Culture Medium Revenue million Forecast, by Application 2020 & 2033
- Table 74: Global T Cell Culture Medium Volume K Forecast, by Application 2020 & 2033
- Table 75: Global T Cell Culture Medium Revenue million Forecast, by Types 2020 & 2033
- Table 76: Global T Cell Culture Medium Volume K Forecast, by Types 2020 & 2033
- Table 77: Global T Cell Culture Medium Revenue million Forecast, by Country 2020 & 2033
- Table 78: Global T Cell Culture Medium Volume K Forecast, by Country 2020 & 2033
- Table 79: China T Cell Culture Medium Revenue (million) Forecast, by Application 2020 & 2033
- Table 80: China T Cell Culture Medium Volume (K) Forecast, by Application 2020 & 2033
- Table 81: India T Cell Culture Medium Revenue (million) Forecast, by Application 2020 & 2033
- Table 82: India T Cell Culture Medium Volume (K) Forecast, by Application 2020 & 2033
- Table 83: Japan T Cell Culture Medium Revenue (million) Forecast, by Application 2020 & 2033
- Table 84: Japan T Cell Culture Medium Volume (K) Forecast, by Application 2020 & 2033
- Table 85: South Korea T Cell Culture Medium Revenue (million) Forecast, by Application 2020 & 2033
- Table 86: South Korea T Cell Culture Medium Volume (K) Forecast, by Application 2020 & 2033
- Table 87: ASEAN T Cell Culture Medium Revenue (million) Forecast, by Application 2020 & 2033
- Table 88: ASEAN T Cell Culture Medium Volume (K) Forecast, by Application 2020 & 2033
- Table 89: Oceania T Cell Culture Medium Revenue (million) Forecast, by Application 2020 & 2033
- Table 90: Oceania T Cell Culture Medium Volume (K) Forecast, by Application 2020 & 2033
- Table 91: Rest of Asia Pacific T Cell Culture Medium Revenue (million) Forecast, by Application 2020 & 2033
- Table 92: Rest of Asia Pacific T Cell Culture Medium Volume (K) Forecast, by Application 2020 & 2033
Frequently Asked Questions
1. What is the projected Compound Annual Growth Rate (CAGR) of the T Cell Culture Medium?
The projected CAGR is approximately 4.7%.
2. Which companies are prominent players in the T Cell Culture Medium?
Key companies in the market include Lonza, STEMCELL Technologies, Thermo Fisher Scientific, Miltenyi Biotec, Takara Bio Inc., Sartorius AG, FUJIFILM, ExCell Bio.
3. What are the main segments of the T Cell Culture Medium?
The market segments include Application, Types.
4. Can you provide details about the market size?
The market size is estimated to be USD 589 million as of 2022.
5. What are some drivers contributing to market growth?
N/A
6. What are the notable trends driving market growth?
N/A
7. Are there any restraints impacting market growth?
N/A
8. Can you provide examples of recent developments in the market?
N/A
9. What pricing options are available for accessing the report?
Pricing options include single-user, multi-user, and enterprise licenses priced at USD 3950.00, USD 5925.00, and USD 7900.00 respectively.
10. Is the market size provided in terms of value or volume?
The market size is provided in terms of value, measured in million and volume, measured in K.
11. Are there any specific market keywords associated with the report?
Yes, the market keyword associated with the report is "T Cell Culture Medium," which aids in identifying and referencing the specific market segment covered.
12. How do I determine which pricing option suits my needs best?
The pricing options vary based on user requirements and access needs. Individual users may opt for single-user licenses, while businesses requiring broader access may choose multi-user or enterprise licenses for cost-effective access to the report.
13. Are there any additional resources or data provided in the T Cell Culture Medium report?
While the report offers comprehensive insights, it's advisable to review the specific contents or supplementary materials provided to ascertain if additional resources or data are available.
14. How can I stay updated on further developments or reports in the T Cell Culture Medium?
To stay informed about further developments, trends, and reports in the T Cell Culture Medium, consider subscribing to industry newsletters, following relevant companies and organizations, or regularly checking reputable industry news sources and publications.
Methodology
Step 1 - Identification of Relevant Samples Size from Population Database


Step 2 - Approaches for Defining Global Market Size (Value, Volume* & Price*)

Note*: In applicable scenarios
Step 3 - Data Sources
Primary Research
- Web Analytics
- Survey Reports
- Research Institute
- Latest Research Reports
- Opinion Leaders
Secondary Research
- Annual Reports
- White Paper
- Latest Press Release
- Industry Association
- Paid Database
- Investor Presentations

Step 4 - Data Triangulation
Involves using different sources of information in order to increase the validity of a study
These sources are likely to be stakeholders in a program - participants, other researchers, program staff, other community members, and so on.
Then we put all data in single framework & apply various statistical tools to find out the dynamic on the market.
During the analysis stage, feedback from the stakeholder groups would be compared to determine areas of agreement as well as areas of divergence