

Key Insights
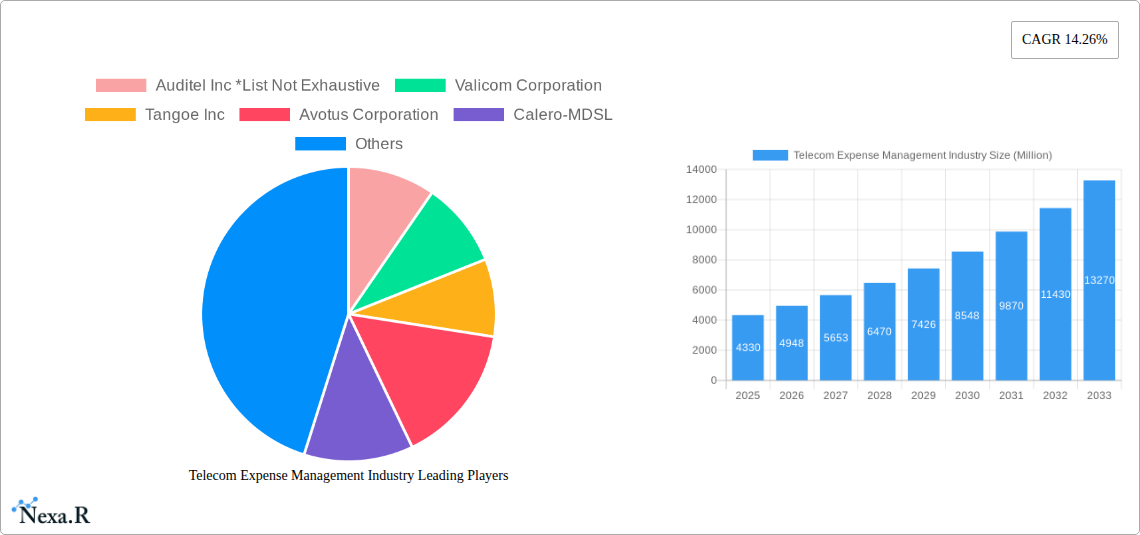
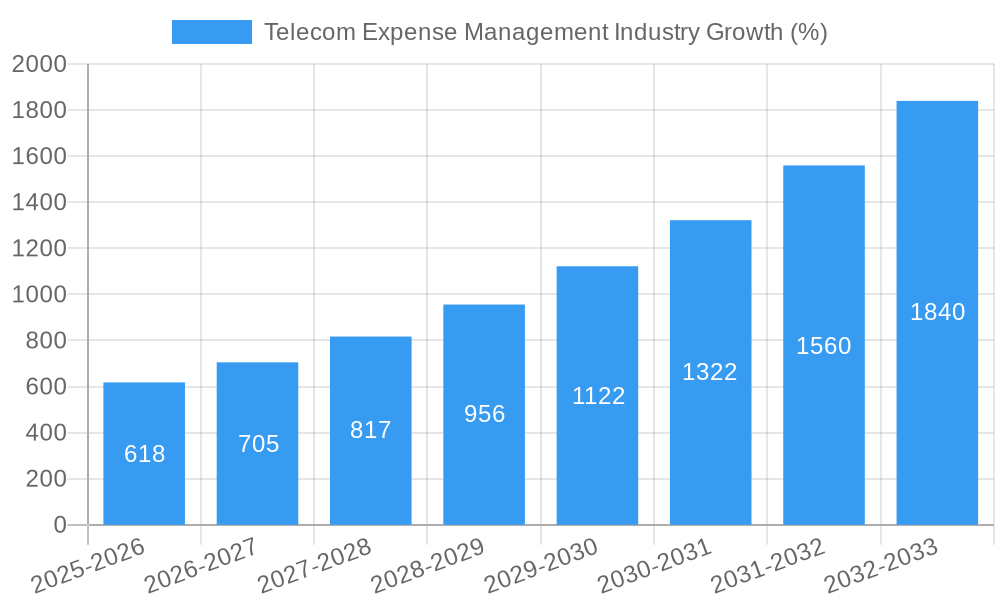
The Telecom Expense Management (TEM) market, valued at $4.33 billion in 2025, is projected to experience robust growth, exhibiting a Compound Annual Growth Rate (CAGR) of 14.26% from 2025 to 2033. This expansion is driven by several key factors. The increasing complexity of telecom services and the rising need for cost optimization among enterprises are primary drivers. Businesses across various sectors, including BFSI, consumer goods & retail, manufacturing, IT & telecom, and healthcare, are increasingly adopting TEM solutions to gain better visibility into their telecom spending, identify cost-saving opportunities, and streamline invoice processing. The shift towards cloud-based hosted services and managed services further fuels market growth, providing enterprises with scalable and cost-effective solutions. The competitive landscape features established players like Auditel Inc., Valicom Corporation, and Tangoe Inc., alongside emerging companies innovating in areas such as AI-powered analytics for expense optimization.
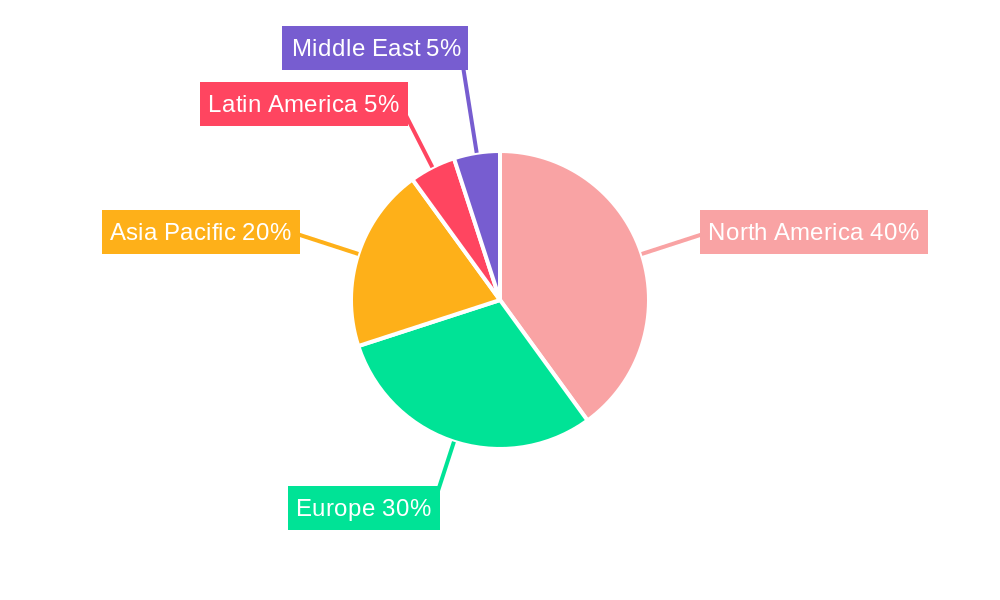
Growth within the TEM market will be segmented, with Invoice Management and Sourcing Management solutions leading the way due to their direct impact on cost reduction. The adoption of TEM solutions is geographically diverse, with North America and Europe currently holding significant market shares. However, the Asia-Pacific region is poised for significant growth, fueled by increasing digitalization and the expanding telecom infrastructure. While challenges remain, such as integration complexities and the need for specialized expertise, the overall market outlook remains positive, with significant potential for further expansion throughout the forecast period. The continuous evolution of telecom technologies and the growing demand for enhanced cost control will continue to drive adoption and innovation within the TEM sector.
Telecom Expense Management (TEM) Industry Market Report: 2019-2033
This comprehensive report provides a detailed analysis of the Telecom Expense Management (TEM) industry, encompassing market size, growth trends, competitive landscape, and future outlook. With a focus on key segments like Invoice Management, Sourcing Management, and Hosted Services, this report is an invaluable resource for industry professionals, investors, and strategic decision-makers. The study period covers 2019-2033, with a base year of 2025 and a forecast period of 2025-2033.
Telecom Expense Management Industry Market Dynamics & Structure
The global Telecom Expense Management (TEM) market, valued at $xx million in 2024, is characterized by moderate consolidation with several key players vying for market share. Technological advancements, particularly in automation and AI, are driving significant industry transformation. Stringent regulatory frameworks concerning data privacy and security influence market practices. Competitive pressures arise from alternative expense management solutions and internal IT capabilities within large enterprises. The market exhibits diverse end-user demographics, with significant demand from BFSI, IT & Telecom, and Manufacturing sectors. M&A activity is a notable trend, with recent deals indicative of market consolidation and expansion into adjacent service areas.
- Market Concentration: Moderately consolidated, with top 5 players holding approximately xx% market share in 2024.
- Technological Innovation: AI, machine learning, and robotic process automation (RPA) are key drivers, enhancing efficiency and accuracy.
- Regulatory Landscape: Compliance with data privacy regulations (e.g., GDPR, CCPA) significantly impacts solution design and implementation.
- Competitive Substitutes: Internal TEM capabilities within large organizations and alternative expense management software pose challenges.
- End-User Demographics: BFSI, IT & Telecom, and Manufacturing sectors represent major market segments.
- M&A Activity: Significant M&A activity observed in recent years, reflecting market consolidation and expansion. For example, the November 2022 acquisition of 12 Points Consulting by Renodis demonstrates this trend.
Telecom Expense Management Industry Growth Trends & Insights
The TEM market demonstrates a robust growth trajectory, exhibiting a Compound Annual Growth Rate (CAGR) of xx% during the historical period (2019-2024) and a projected CAGR of xx% during the forecast period (2025-2033). This growth is fueled by increasing telecom expenses, the need for enhanced cost optimization, and the adoption of advanced technologies like AI and cloud-based solutions. Market penetration is currently at xx%, with significant growth potential across various end-user industries. Technological disruptions, particularly the adoption of RPA and cloud-based TEM platforms, are accelerating market expansion. A shift towards managed services is also contributing to overall market growth.
Dominant Regions, Countries, or Segments in Telecom Expense Management Industry
North America currently holds the largest market share in the TEM industry, driven by high telecom expenditures, advanced technological adoption, and the presence of major TEM solution providers. Within the segments, Invoice Management and Hosted Services demonstrate the highest growth potential.
- By Solution: Invoice Management holds the largest market share, driven by the need for automated invoice processing and accuracy.
- By Service: Hosted Services are experiencing rapid growth due to their scalability and cost-effectiveness.
- By End-user Industry: BFSI and IT & Telecom sectors display the highest adoption rates, owing to their high telecom expenditure and complex billing structures.
- Key Drivers: Strong economic growth in key regions, increasing adoption of cloud-based solutions, and government initiatives promoting digital transformation.
Telecom Expense Management Industry Product Landscape
The TEM market offers a range of solutions, from basic invoice processing tools to comprehensive, AI-powered platforms that integrate across multiple telecom providers. Key innovations include advanced analytics dashboards for better cost visibility, self-service portals for employees, and automation capabilities that drastically reduce manual effort. Unique selling propositions (USPs) often center on ease of use, integration capabilities, and advanced reporting features, along with customized solutions for diverse industry needs.
Key Drivers, Barriers & Challenges in Telecom Expense Management Industry
Key Drivers:
- Growing telecom expenses and the need for cost optimization.
- Increasing adoption of cloud-based and AI-powered solutions.
- Stringent regulatory compliance requirements.
Challenges:
- Integration complexities across multiple telecom providers and internal systems.
- Resistance to change and adoption within organizations.
- High initial investment costs for advanced TEM solutions.
Emerging Opportunities in Telecom Expense Management Industry
Untapped market potential exists in emerging economies and among smaller enterprises with limited in-house TEM capabilities. Innovative applications of AI and machine learning offer opportunities to further improve accuracy, automate processes, and provide predictive analytics. Growing demand for improved mobile expense management is also creating new opportunities.
Growth Accelerators in the Telecom Expense Management Industry Industry
Technological advancements such as AI-driven automation and the shift to cloud-based platforms are significant growth accelerators. Strategic partnerships between TEM providers and telecom operators further enhance market penetration and solution adoption. Expanding into new geographical regions and targeting niche markets will also fuel market growth.
Key Players Shaping the Telecom Expense Management Industry Market
- Auditel Inc
- Valicom Corporation
- Tangoe Inc
- Avotus Corporation
- Calero-MDSL
- CGI Inc
- WidePoint Solutions Corporation
- Upland Software Inc (Cimpl)
- Sakon Inc
- TeleManagement Technologies Inc
Notable Milestones in Telecom Expense Management Industry Sector
- September 2023: Prodapt partners with ServiceNow to expand TMT business, driving digital workflows for CSPs.
- November 2022: Renodis acquires 12 Points Consulting, expanding its telecom and utility management services.
- September 2022: Tangoe integrates robotic process automation, enhancing data processing efficiency.
In-Depth Telecom Expense Management Industry Market Outlook
The TEM market is poised for continued growth, driven by technological innovation, increased enterprise adoption, and expansion into new market segments. Strategic partnerships and investments in advanced analytics capabilities will further enhance market competitiveness and create lucrative opportunities for established and emerging players. The market is expected to reach $xx million by 2033.
Telecom Expense Management Industry Segmentation
-
1. Solution
- 1.1. Invoice Management
- 1.2. Sourcing Management
- 1.3. Business Management
- 1.4. Dispute Management
- 1.5. Other Solutions
-
2. Service
- 2.1. Hosted Service
- 2.2. Managed Service
-
3. End-user Industry
- 3.1. BFSI
- 3.2. Consumer Goods & Retail
- 3.3. Manufacturing
- 3.4. IT & Telecom
- 3.5. Healthcare
- 3.6. Other End-user Industries
Telecom Expense Management Industry Segmentation By Geography
- 1. North America
- 2. Europe
- 3. Asia Pacific
- 4. Latin America
- 5. Middle East
Telecom Expense Management Industry REPORT HIGHLIGHTS
| Aspects | Details |
|---|---|
| Study Period | 2019-2033 |
| Base Year | 2024 |
| Estimated Year | 2025 |
| Forecast Period | 2025-2033 |
| Historical Period | 2019-2024 |
| Growth Rate | CAGR of 14.26% from 2019-2033 |
| Segmentation |
|
Table of Contents
- 1. Introduction
- 1.1. Research Scope
- 1.2. Market Segmentation
- 1.3. Research Methodology
- 1.4. Definitions and Assumptions
- 2. Executive Summary
- 2.1. Introduction
- 3. Market Dynamics
- 3.1. Introduction
- 3.2. Market Drivers
- 3.2.1. Increasing Adoption of Mobile Phones and Other Portable Devices; Significant Cost Reduction and Expense Visibility
- 3.3. Market Restrains
- 3.3.1. Lack of Interoperability Due to Set Industry Standards
- 3.4. Market Trends
- 3.4.1. BFSI Segment is Expected to Gain Significant Traction
- 4. Market Factor Analysis
- 4.1. Porters Five Forces
- 4.2. Supply/Value Chain
- 4.3. PESTEL analysis
- 4.4. Market Entropy
- 4.5. Patent/Trademark Analysis
- 5. Global Telecom Expense Management Industry Analysis, Insights and Forecast, 2019-2031
- 5.1. Market Analysis, Insights and Forecast - by Solution
- 5.1.1. Invoice Management
- 5.1.2. Sourcing Management
- 5.1.3. Business Management
- 5.1.4. Dispute Management
- 5.1.5. Other Solutions
- 5.2. Market Analysis, Insights and Forecast - by Service
- 5.2.1. Hosted Service
- 5.2.2. Managed Service
- 5.3. Market Analysis, Insights and Forecast - by End-user Industry
- 5.3.1. BFSI
- 5.3.2. Consumer Goods & Retail
- 5.3.3. Manufacturing
- 5.3.4. IT & Telecom
- 5.3.5. Healthcare
- 5.3.6. Other End-user Industries
- 5.4. Market Analysis, Insights and Forecast - by Region
- 5.4.1. North America
- 5.4.2. Europe
- 5.4.3. Asia Pacific
- 5.4.4. Latin America
- 5.4.5. Middle East
- 5.1. Market Analysis, Insights and Forecast - by Solution
- 6. North America Telecom Expense Management Industry Analysis, Insights and Forecast, 2019-2031
- 6.1. Market Analysis, Insights and Forecast - by Solution
- 6.1.1. Invoice Management
- 6.1.2. Sourcing Management
- 6.1.3. Business Management
- 6.1.4. Dispute Management
- 6.1.5. Other Solutions
- 6.2. Market Analysis, Insights and Forecast - by Service
- 6.2.1. Hosted Service
- 6.2.2. Managed Service
- 6.3. Market Analysis, Insights and Forecast - by End-user Industry
- 6.3.1. BFSI
- 6.3.2. Consumer Goods & Retail
- 6.3.3. Manufacturing
- 6.3.4. IT & Telecom
- 6.3.5. Healthcare
- 6.3.6. Other End-user Industries
- 6.1. Market Analysis, Insights and Forecast - by Solution
- 7. Europe Telecom Expense Management Industry Analysis, Insights and Forecast, 2019-2031
- 7.1. Market Analysis, Insights and Forecast - by Solution
- 7.1.1. Invoice Management
- 7.1.2. Sourcing Management
- 7.1.3. Business Management
- 7.1.4. Dispute Management
- 7.1.5. Other Solutions
- 7.2. Market Analysis, Insights and Forecast - by Service
- 7.2.1. Hosted Service
- 7.2.2. Managed Service
- 7.3. Market Analysis, Insights and Forecast - by End-user Industry
- 7.3.1. BFSI
- 7.3.2. Consumer Goods & Retail
- 7.3.3. Manufacturing
- 7.3.4. IT & Telecom
- 7.3.5. Healthcare
- 7.3.6. Other End-user Industries
- 7.1. Market Analysis, Insights and Forecast - by Solution
- 8. Asia Pacific Telecom Expense Management Industry Analysis, Insights and Forecast, 2019-2031
- 8.1. Market Analysis, Insights and Forecast - by Solution
- 8.1.1. Invoice Management
- 8.1.2. Sourcing Management
- 8.1.3. Business Management
- 8.1.4. Dispute Management
- 8.1.5. Other Solutions
- 8.2. Market Analysis, Insights and Forecast - by Service
- 8.2.1. Hosted Service
- 8.2.2. Managed Service
- 8.3. Market Analysis, Insights and Forecast - by End-user Industry
- 8.3.1. BFSI
- 8.3.2. Consumer Goods & Retail
- 8.3.3. Manufacturing
- 8.3.4. IT & Telecom
- 8.3.5. Healthcare
- 8.3.6. Other End-user Industries
- 8.1. Market Analysis, Insights and Forecast - by Solution
- 9. Latin America Telecom Expense Management Industry Analysis, Insights and Forecast, 2019-2031
- 9.1. Market Analysis, Insights and Forecast - by Solution
- 9.1.1. Invoice Management
- 9.1.2. Sourcing Management
- 9.1.3. Business Management
- 9.1.4. Dispute Management
- 9.1.5. Other Solutions
- 9.2. Market Analysis, Insights and Forecast - by Service
- 9.2.1. Hosted Service
- 9.2.2. Managed Service
- 9.3. Market Analysis, Insights and Forecast - by End-user Industry
- 9.3.1. BFSI
- 9.3.2. Consumer Goods & Retail
- 9.3.3. Manufacturing
- 9.3.4. IT & Telecom
- 9.3.5. Healthcare
- 9.3.6. Other End-user Industries
- 9.1. Market Analysis, Insights and Forecast - by Solution
- 10. Middle East Telecom Expense Management Industry Analysis, Insights and Forecast, 2019-2031
- 10.1. Market Analysis, Insights and Forecast - by Solution
- 10.1.1. Invoice Management
- 10.1.2. Sourcing Management
- 10.1.3. Business Management
- 10.1.4. Dispute Management
- 10.1.5. Other Solutions
- 10.2. Market Analysis, Insights and Forecast - by Service
- 10.2.1. Hosted Service
- 10.2.2. Managed Service
- 10.3. Market Analysis, Insights and Forecast - by End-user Industry
- 10.3.1. BFSI
- 10.3.2. Consumer Goods & Retail
- 10.3.3. Manufacturing
- 10.3.4. IT & Telecom
- 10.3.5. Healthcare
- 10.3.6. Other End-user Industries
- 10.1. Market Analysis, Insights and Forecast - by Solution
- 11. North America Telecom Expense Management Industry Analysis, Insights and Forecast, 2019-2031
- 11.1. Market Analysis, Insights and Forecast - By Country/Sub-region
- 11.1.1.
- 12. Europe Telecom Expense Management Industry Analysis, Insights and Forecast, 2019-2031
- 12.1. Market Analysis, Insights and Forecast - By Country/Sub-region
- 12.1.1.
- 13. Asia Pacific Telecom Expense Management Industry Analysis, Insights and Forecast, 2019-2031
- 13.1. Market Analysis, Insights and Forecast - By Country/Sub-region
- 13.1.1.
- 14. Latin America Telecom Expense Management Industry Analysis, Insights and Forecast, 2019-2031
- 14.1. Market Analysis, Insights and Forecast - By Country/Sub-region
- 14.1.1.
- 15. Middle East Telecom Expense Management Industry Analysis, Insights and Forecast, 2019-2031
- 15.1. Market Analysis, Insights and Forecast - By Country/Sub-region
- 15.1.1.
- 16. Competitive Analysis
- 16.1. Global Market Share Analysis 2024
- 16.2. Company Profiles
- 16.2.1 Auditel Inc *List Not Exhaustive
- 16.2.1.1. Overview
- 16.2.1.2. Products
- 16.2.1.3. SWOT Analysis
- 16.2.1.4. Recent Developments
- 16.2.1.5. Financials (Based on Availability)
- 16.2.2 Valicom Corporation
- 16.2.2.1. Overview
- 16.2.2.2. Products
- 16.2.2.3. SWOT Analysis
- 16.2.2.4. Recent Developments
- 16.2.2.5. Financials (Based on Availability)
- 16.2.3 Tangoe Inc
- 16.2.3.1. Overview
- 16.2.3.2. Products
- 16.2.3.3. SWOT Analysis
- 16.2.3.4. Recent Developments
- 16.2.3.5. Financials (Based on Availability)
- 16.2.4 Avotus Corporation
- 16.2.4.1. Overview
- 16.2.4.2. Products
- 16.2.4.3. SWOT Analysis
- 16.2.4.4. Recent Developments
- 16.2.4.5. Financials (Based on Availability)
- 16.2.5 Calero-MDSL
- 16.2.5.1. Overview
- 16.2.5.2. Products
- 16.2.5.3. SWOT Analysis
- 16.2.5.4. Recent Developments
- 16.2.5.5. Financials (Based on Availability)
- 16.2.6 CGI Inc
- 16.2.6.1. Overview
- 16.2.6.2. Products
- 16.2.6.3. SWOT Analysis
- 16.2.6.4. Recent Developments
- 16.2.6.5. Financials (Based on Availability)
- 16.2.7 WidePoint Solutions Corporation
- 16.2.7.1. Overview
- 16.2.7.2. Products
- 16.2.7.3. SWOT Analysis
- 16.2.7.4. Recent Developments
- 16.2.7.5. Financials (Based on Availability)
- 16.2.8 Upland Software Inc (Cimpl)
- 16.2.8.1. Overview
- 16.2.8.2. Products
- 16.2.8.3. SWOT Analysis
- 16.2.8.4. Recent Developments
- 16.2.8.5. Financials (Based on Availability)
- 16.2.9 Sakon Inc
- 16.2.9.1. Overview
- 16.2.9.2. Products
- 16.2.9.3. SWOT Analysis
- 16.2.9.4. Recent Developments
- 16.2.9.5. Financials (Based on Availability)
- 16.2.10 TeleManagement Technologies Inc
- 16.2.10.1. Overview
- 16.2.10.2. Products
- 16.2.10.3. SWOT Analysis
- 16.2.10.4. Recent Developments
- 16.2.10.5. Financials (Based on Availability)
- 16.2.1 Auditel Inc *List Not Exhaustive
List of Figures
- Figure 1: Global Telecom Expense Management Industry Revenue Breakdown (Million, %) by Region 2024 & 2032
- Figure 2: North America Telecom Expense Management Industry Revenue (Million), by Country 2024 & 2032
- Figure 3: North America Telecom Expense Management Industry Revenue Share (%), by Country 2024 & 2032
- Figure 4: Europe Telecom Expense Management Industry Revenue (Million), by Country 2024 & 2032
- Figure 5: Europe Telecom Expense Management Industry Revenue Share (%), by Country 2024 & 2032
- Figure 6: Asia Pacific Telecom Expense Management Industry Revenue (Million), by Country 2024 & 2032
- Figure 7: Asia Pacific Telecom Expense Management Industry Revenue Share (%), by Country 2024 & 2032
- Figure 8: Latin America Telecom Expense Management Industry Revenue (Million), by Country 2024 & 2032
- Figure 9: Latin America Telecom Expense Management Industry Revenue Share (%), by Country 2024 & 2032
- Figure 10: Middle East Telecom Expense Management Industry Revenue (Million), by Country 2024 & 2032
- Figure 11: Middle East Telecom Expense Management Industry Revenue Share (%), by Country 2024 & 2032
- Figure 12: North America Telecom Expense Management Industry Revenue (Million), by Solution 2024 & 2032
- Figure 13: North America Telecom Expense Management Industry Revenue Share (%), by Solution 2024 & 2032
- Figure 14: North America Telecom Expense Management Industry Revenue (Million), by Service 2024 & 2032
- Figure 15: North America Telecom Expense Management Industry Revenue Share (%), by Service 2024 & 2032
- Figure 16: North America Telecom Expense Management Industry Revenue (Million), by End-user Industry 2024 & 2032
- Figure 17: North America Telecom Expense Management Industry Revenue Share (%), by End-user Industry 2024 & 2032
- Figure 18: North America Telecom Expense Management Industry Revenue (Million), by Country 2024 & 2032
- Figure 19: North America Telecom Expense Management Industry Revenue Share (%), by Country 2024 & 2032
- Figure 20: Europe Telecom Expense Management Industry Revenue (Million), by Solution 2024 & 2032
- Figure 21: Europe Telecom Expense Management Industry Revenue Share (%), by Solution 2024 & 2032
- Figure 22: Europe Telecom Expense Management Industry Revenue (Million), by Service 2024 & 2032
- Figure 23: Europe Telecom Expense Management Industry Revenue Share (%), by Service 2024 & 2032
- Figure 24: Europe Telecom Expense Management Industry Revenue (Million), by End-user Industry 2024 & 2032
- Figure 25: Europe Telecom Expense Management Industry Revenue Share (%), by End-user Industry 2024 & 2032
- Figure 26: Europe Telecom Expense Management Industry Revenue (Million), by Country 2024 & 2032
- Figure 27: Europe Telecom Expense Management Industry Revenue Share (%), by Country 2024 & 2032
- Figure 28: Asia Pacific Telecom Expense Management Industry Revenue (Million), by Solution 2024 & 2032
- Figure 29: Asia Pacific Telecom Expense Management Industry Revenue Share (%), by Solution 2024 & 2032
- Figure 30: Asia Pacific Telecom Expense Management Industry Revenue (Million), by Service 2024 & 2032
- Figure 31: Asia Pacific Telecom Expense Management Industry Revenue Share (%), by Service 2024 & 2032
- Figure 32: Asia Pacific Telecom Expense Management Industry Revenue (Million), by End-user Industry 2024 & 2032
- Figure 33: Asia Pacific Telecom Expense Management Industry Revenue Share (%), by End-user Industry 2024 & 2032
- Figure 34: Asia Pacific Telecom Expense Management Industry Revenue (Million), by Country 2024 & 2032
- Figure 35: Asia Pacific Telecom Expense Management Industry Revenue Share (%), by Country 2024 & 2032
- Figure 36: Latin America Telecom Expense Management Industry Revenue (Million), by Solution 2024 & 2032
- Figure 37: Latin America Telecom Expense Management Industry Revenue Share (%), by Solution 2024 & 2032
- Figure 38: Latin America Telecom Expense Management Industry Revenue (Million), by Service 2024 & 2032
- Figure 39: Latin America Telecom Expense Management Industry Revenue Share (%), by Service 2024 & 2032
- Figure 40: Latin America Telecom Expense Management Industry Revenue (Million), by End-user Industry 2024 & 2032
- Figure 41: Latin America Telecom Expense Management Industry Revenue Share (%), by End-user Industry 2024 & 2032
- Figure 42: Latin America Telecom Expense Management Industry Revenue (Million), by Country 2024 & 2032
- Figure 43: Latin America Telecom Expense Management Industry Revenue Share (%), by Country 2024 & 2032
- Figure 44: Middle East Telecom Expense Management Industry Revenue (Million), by Solution 2024 & 2032
- Figure 45: Middle East Telecom Expense Management Industry Revenue Share (%), by Solution 2024 & 2032
- Figure 46: Middle East Telecom Expense Management Industry Revenue (Million), by Service 2024 & 2032
- Figure 47: Middle East Telecom Expense Management Industry Revenue Share (%), by Service 2024 & 2032
- Figure 48: Middle East Telecom Expense Management Industry Revenue (Million), by End-user Industry 2024 & 2032
- Figure 49: Middle East Telecom Expense Management Industry Revenue Share (%), by End-user Industry 2024 & 2032
- Figure 50: Middle East Telecom Expense Management Industry Revenue (Million), by Country 2024 & 2032
- Figure 51: Middle East Telecom Expense Management Industry Revenue Share (%), by Country 2024 & 2032
List of Tables
- Table 1: Global Telecom Expense Management Industry Revenue Million Forecast, by Region 2019 & 2032
- Table 2: Global Telecom Expense Management Industry Revenue Million Forecast, by Solution 2019 & 2032
- Table 3: Global Telecom Expense Management Industry Revenue Million Forecast, by Service 2019 & 2032
- Table 4: Global Telecom Expense Management Industry Revenue Million Forecast, by End-user Industry 2019 & 2032
- Table 5: Global Telecom Expense Management Industry Revenue Million Forecast, by Region 2019 & 2032
- Table 6: Global Telecom Expense Management Industry Revenue Million Forecast, by Country 2019 & 2032
- Table 7: Telecom Expense Management Industry Revenue (Million) Forecast, by Application 2019 & 2032
- Table 8: Global Telecom Expense Management Industry Revenue Million Forecast, by Country 2019 & 2032
- Table 9: Telecom Expense Management Industry Revenue (Million) Forecast, by Application 2019 & 2032
- Table 10: Global Telecom Expense Management Industry Revenue Million Forecast, by Country 2019 & 2032
- Table 11: Telecom Expense Management Industry Revenue (Million) Forecast, by Application 2019 & 2032
- Table 12: Global Telecom Expense Management Industry Revenue Million Forecast, by Country 2019 & 2032
- Table 13: Telecom Expense Management Industry Revenue (Million) Forecast, by Application 2019 & 2032
- Table 14: Global Telecom Expense Management Industry Revenue Million Forecast, by Country 2019 & 2032
- Table 15: Telecom Expense Management Industry Revenue (Million) Forecast, by Application 2019 & 2032
- Table 16: Global Telecom Expense Management Industry Revenue Million Forecast, by Solution 2019 & 2032
- Table 17: Global Telecom Expense Management Industry Revenue Million Forecast, by Service 2019 & 2032
- Table 18: Global Telecom Expense Management Industry Revenue Million Forecast, by End-user Industry 2019 & 2032
- Table 19: Global Telecom Expense Management Industry Revenue Million Forecast, by Country 2019 & 2032
- Table 20: Global Telecom Expense Management Industry Revenue Million Forecast, by Solution 2019 & 2032
- Table 21: Global Telecom Expense Management Industry Revenue Million Forecast, by Service 2019 & 2032
- Table 22: Global Telecom Expense Management Industry Revenue Million Forecast, by End-user Industry 2019 & 2032
- Table 23: Global Telecom Expense Management Industry Revenue Million Forecast, by Country 2019 & 2032
- Table 24: Global Telecom Expense Management Industry Revenue Million Forecast, by Solution 2019 & 2032
- Table 25: Global Telecom Expense Management Industry Revenue Million Forecast, by Service 2019 & 2032
- Table 26: Global Telecom Expense Management Industry Revenue Million Forecast, by End-user Industry 2019 & 2032
- Table 27: Global Telecom Expense Management Industry Revenue Million Forecast, by Country 2019 & 2032
- Table 28: Global Telecom Expense Management Industry Revenue Million Forecast, by Solution 2019 & 2032
- Table 29: Global Telecom Expense Management Industry Revenue Million Forecast, by Service 2019 & 2032
- Table 30: Global Telecom Expense Management Industry Revenue Million Forecast, by End-user Industry 2019 & 2032
- Table 31: Global Telecom Expense Management Industry Revenue Million Forecast, by Country 2019 & 2032
- Table 32: Global Telecom Expense Management Industry Revenue Million Forecast, by Solution 2019 & 2032
- Table 33: Global Telecom Expense Management Industry Revenue Million Forecast, by Service 2019 & 2032
- Table 34: Global Telecom Expense Management Industry Revenue Million Forecast, by End-user Industry 2019 & 2032
- Table 35: Global Telecom Expense Management Industry Revenue Million Forecast, by Country 2019 & 2032
Frequently Asked Questions
1. What is the projected Compound Annual Growth Rate (CAGR) of the Telecom Expense Management Industry?
The projected CAGR is approximately 14.26%.
2. Which companies are prominent players in the Telecom Expense Management Industry?
Key companies in the market include Auditel Inc *List Not Exhaustive, Valicom Corporation, Tangoe Inc, Avotus Corporation, Calero-MDSL, CGI Inc, WidePoint Solutions Corporation, Upland Software Inc (Cimpl), Sakon Inc, TeleManagement Technologies Inc.
3. What are the main segments of the Telecom Expense Management Industry?
The market segments include Solution, Service, End-user Industry.
4. Can you provide details about the market size?
The market size is estimated to be USD 4.33 Million as of 2022.
5. What are some drivers contributing to market growth?
Increasing Adoption of Mobile Phones and Other Portable Devices; Significant Cost Reduction and Expense Visibility.
6. What are the notable trends driving market growth?
BFSI Segment is Expected to Gain Significant Traction.
7. Are there any restraints impacting market growth?
Lack of Interoperability Due to Set Industry Standards.
8. Can you provide examples of recent developments in the market?
September 2023: Prodapt, one of the largest and fastest-growing specialized firms in the Connectedness industry, partnered to enable ServiceNow to expand its telecom, media, and tech (TMT) business to assist Communication Service Providers (CSPs). The expanded scope would drive digital workflows for greater operational agility, enhanced productivity, and intuitive customer experiences.
9. What pricing options are available for accessing the report?
Pricing options include single-user, multi-user, and enterprise licenses priced at USD 4750, USD 5250, and USD 8750 respectively.
10. Is the market size provided in terms of value or volume?
The market size is provided in terms of value, measured in Million.
11. Are there any specific market keywords associated with the report?
Yes, the market keyword associated with the report is "Telecom Expense Management Industry," which aids in identifying and referencing the specific market segment covered.
12. How do I determine which pricing option suits my needs best?
The pricing options vary based on user requirements and access needs. Individual users may opt for single-user licenses, while businesses requiring broader access may choose multi-user or enterprise licenses for cost-effective access to the report.
13. Are there any additional resources or data provided in the Telecom Expense Management Industry report?
While the report offers comprehensive insights, it's advisable to review the specific contents or supplementary materials provided to ascertain if additional resources or data are available.
14. How can I stay updated on further developments or reports in the Telecom Expense Management Industry?
To stay informed about further developments, trends, and reports in the Telecom Expense Management Industry, consider subscribing to industry newsletters, following relevant companies and organizations, or regularly checking reputable industry news sources and publications.
Methodology
Step 1 - Identification of Relevant Samples Size from Population Database


Step 2 - Approaches for Defining Global Market Size (Value, Volume* & Price*)

Note*: In applicable scenarios
Step 3 - Data Sources
Primary Research
- Web Analytics
- Survey Reports
- Research Institute
- Latest Research Reports
- Opinion Leaders
Secondary Research
- Annual Reports
- White Paper
- Latest Press Release
- Industry Association
- Paid Database
- Investor Presentations

Step 4 - Data Triangulation
Involves using different sources of information in order to increase the validity of a study
These sources are likely to be stakeholders in a program - participants, other researchers, program staff, other community members, and so on.
Then we put all data in single framework & apply various statistical tools to find out the dynamic on the market.
During the analysis stage, feedback from the stakeholder groups would be compared to determine areas of agreement as well as areas of divergence
