

Key Insights
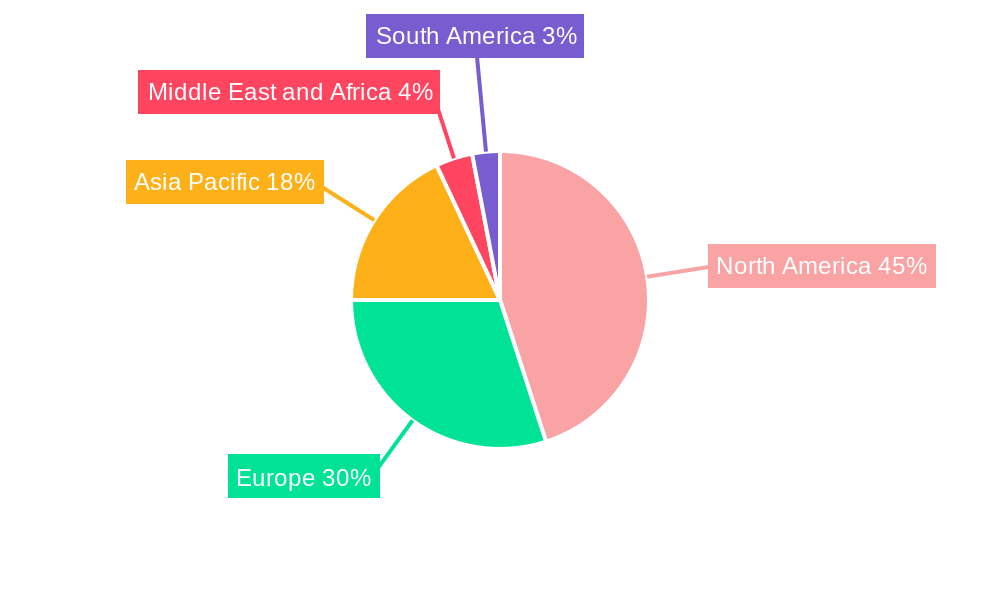
The Tissue Microarray (TMA) market is experiencing robust growth, driven by the increasing prevalence of cancer and other diseases requiring precise diagnostic and prognostic tools. The market's Compound Annual Growth Rate (CAGR) exceeding 10.30% from 2019-2024 suggests a significant expansion, projected to continue throughout the forecast period (2025-2033). This growth is fueled by several key factors. Firstly, the rising adoption of TMAs in pharmaceutical and biotechnological research accelerates drug discovery and development processes. Secondly, advancements in technologies like polymerase chain reaction (PCR), next-generation sequencing (NGS), and DNA microarrays enhance the accuracy and efficiency of TMA analysis. Furthermore, the increasing demand for personalized medicine necessitates precise diagnostic tools, thereby bolstering the demand for TMAs. The market segmentation reveals that immunohistochemistry remains a dominant procedure type, although FISH and in situ hybridization are witnessing notable growth due to their ability to provide comprehensive genetic and protein information. Geographically, North America currently holds the largest market share, attributed to advanced healthcare infrastructure and high research spending. However, the Asia-Pacific region is expected to witness the fastest growth, driven by rising healthcare expenditure and an expanding pool of research facilities.
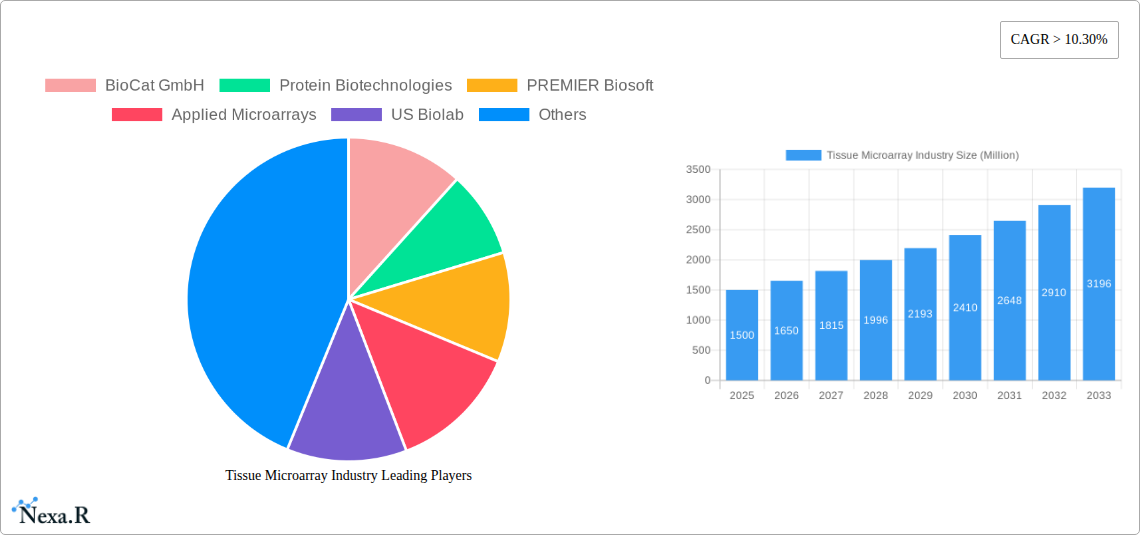
Despite the promising outlook, certain restraints limit market expansion. High initial investment costs for advanced equipment and specialized expertise needed to conduct TMA analysis can deter smaller research institutions and laboratories. Furthermore, the complex regulatory landscape surrounding diagnostic procedures in some regions can pose challenges. However, the overall positive trend, driven by technological advancements, increasing research activities, and the growing demand for personalized medicine, indicates that the Tissue Microarray market will continue to expand considerably during the forecast period, with significant opportunities for key players such as BioCat GmbH, Protein Biotechnologies, and PREMIER Biosoft. The market is likely to witness strategic partnerships, mergers, and acquisitions to drive innovation and expand market reach. The continued evolution of TMA technology and its integration with other advanced diagnostic techniques will further propel the market growth.
Tissue Microarray Industry Market Report: 2019-2033
This comprehensive report provides an in-depth analysis of the Tissue Microarray (TMA) industry, encompassing market dynamics, growth trends, regional segmentation, product landscape, and key players. With a study period spanning 2019-2033, a base year of 2025, and a forecast period of 2025-2033, this report offers invaluable insights for industry professionals, investors, and researchers seeking to understand and capitalize on the opportunities within this rapidly evolving sector. The global market value is estimated at XX Million units in 2025 and is projected to reach XX Million units by 2033.
Tissue Microarray Industry Market Dynamics & Structure
The Tissue Microarray (TMA) market is characterized by a moderately fragmented landscape with several key players vying for market share. Technological advancements, particularly in next-generation sequencing (NGS) and polymerase chain reaction (PCR) integration with TMAs, are significant drivers of innovation. Stringent regulatory frameworks, including those governing medical device approvals and diagnostic testing, influence market growth. Competitive substitutes, such as traditional histology techniques, pose challenges, while the increasing prevalence of chronic diseases drives demand. The market is witnessing a rise in strategic mergers and acquisitions (M&A) activity, as larger companies seek to consolidate their presence and expand their product portfolios. The market is witnessing a high level of innovation and R&D activity, with players focused on developing advanced TMA technologies for enhanced accuracy and throughput.
- Market Concentration: Moderately fragmented, with no single dominant player.
- Technological Innovation: Driven by NGS, PCR integration, and automation.
- Regulatory Landscape: Stringent regulations impacting market entry and product development.
- Competitive Substitutes: Traditional histology techniques pose a moderate threat.
- M&A Activity: XX deals recorded between 2019 and 2024, with a projected increase in the forecast period.
- End-User Demographics: Growth driven by increasing demand from pharmaceutical and biotechnology companies and research organizations. Pharmaceutical companies account for approximately xx% of the market, while research organizations comprise xx%
Tissue Microarray Industry Growth Trends & Insights
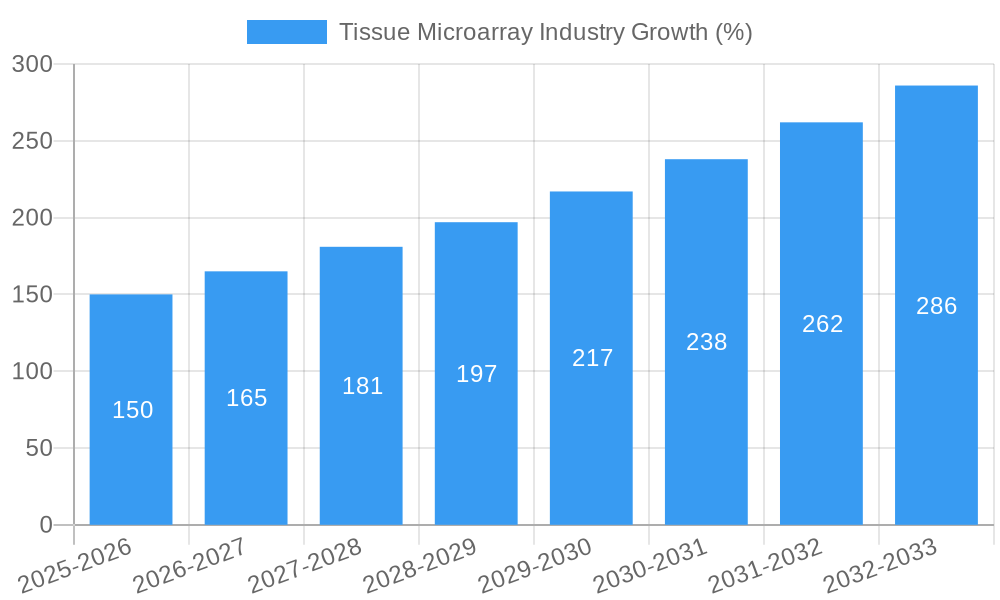
The TMA market experienced robust growth during the historical period (2019-2024), primarily driven by the increasing adoption of TMAs in drug discovery, diagnostics, and personalized medicine. The market size grew from XX Million units in 2019 to XX Million units in 2024, exhibiting a CAGR of xx%. This growth is projected to continue throughout the forecast period (2025-2033), with a predicted CAGR of xx%, reaching XX Million units by 2033. Technological disruptions, particularly the integration of advanced imaging and analysis techniques, are accelerating market growth. A shift towards personalized medicine and the increasing prevalence of cancer are key factors driving market adoption.
Dominant Regions, Countries, or Segments in Tissue Microarray Industry
North America currently dominates the TMA market, driven by robust research funding, a high concentration of pharmaceutical and biotechnology companies, and well-established healthcare infrastructure. Europe is expected to witness significant growth, fueled by increasing investments in healthcare and life sciences research. Within the segments, the pharmaceutical and biotechnological companies end-user segment leads, followed by research organizations. Immunohistochemistry remains the dominant procedure type, owing to its established application in cancer research and diagnostics. DNA microarrays are the most widely utilized technology, benefiting from maturity and established workflows.
- Leading Region: North America (Market share: xx%)
- Key Drivers: Robust R&D investment, high concentration of pharmaceutical/biotech companies, advanced healthcare infrastructure.
- High-growth Segment: Pharmaceutical and Biotechnological Companies (Market share: xx%, projected growth of xx% CAGR)
- Leading Procedure: Immunohistochemistry (Market share: xx%)
- Dominant Technology: DNA Microarray (Market share: xx%)
Tissue Microarray Industry Product Landscape
The TMA market offers a diverse range of products, including pre-constructed arrays, custom-designed arrays, and related consumables (reagents and staining kits). Product innovations focus on improving array quality, increasing throughput, and integrating advanced analytical capabilities. These innovations, combined with advancements in automated systems and data analysis software, enhances accuracy and efficiency, making TMA a more cost-effective and reliable solution. Unique selling propositions include ease of use, high throughput, and reduced cost compared to conventional methods.
Key Drivers, Barriers & Challenges in Tissue Microarray Industry
Key Drivers:
- Increasing prevalence of chronic diseases, particularly cancer.
- Growing demand for personalized medicine approaches.
- Technological advancements in array construction, imaging, and data analysis.
- Rising investments in research and development across pharmaceutical and biotechnology sectors.
Key Challenges:
- High initial investment costs associated with equipment and infrastructure.
- Stringent regulatory requirements for diagnostic applications.
- Limited awareness and understanding of TMA technology in certain regions.
- Competition from alternative tissue analysis techniques. (e.g., xx% market share of traditional methods)
Emerging Opportunities in Tissue Microarray Industry
Emerging opportunities lie in the expansion of TMA applications beyond oncology, including areas such as infectious disease research and cardiovascular disease research. The integration of AI and machine learning into TMA analysis offers significant potential for improving diagnostic accuracy and efficiency. The development of novel array formats, such as 3D TMAs, opens up exciting new avenues for exploring complex tissue architectures and their roles in disease. Untapped markets in developing countries represent significant growth potential.
Growth Accelerators in the Tissue Microarray Industry Industry
Strategic partnerships and collaborations between TMA manufacturers, research institutions, and pharmaceutical companies are accelerating market growth. Technological advancements, specifically in automation and high-throughput screening, are improving efficiency and reducing costs. Expanding applications into new therapeutic areas beyond oncology are creating new revenue streams and driving market expansion.
Key Players Shaping the Tissue Microarray Industry Market
- BioCat GmbH
- Protein Biotechnologies
- PREMIER Biosoft
- Applied Microarrays
- US Biolab
- Arrayit Corporation
- Bio SB
- OriGene
- ProteoGenex
- Biocompare
- Novus Biologicals
- BioIVT
Notable Milestones in Tissue Microarray Industry Sector
- May 2023: PathogenDx plans to launch a microarray-based test for urinary tract infections, enabling the identification of 26 pathogens and 20 antimicrobial resistance genes.
- March 2023: TriMetis Life Sciences and ISENET collaborate to offer an automated tissue coring system, enhancing genomic profiling services.
In-Depth Tissue Microarray Industry Market Outlook
The TMA market is poised for continued growth, fueled by technological innovation, expanding applications, and increasing demand from research organizations and pharmaceutical companies. Strategic partnerships and investments in R&D will play a key role in shaping the future of the industry. The development of more sophisticated, high-throughput systems coupled with advanced data analysis capabilities will further expand the capabilities and applications of TMAs. Focus on personalized medicine and diagnostics will drive substantial market growth in the coming years.
Tissue Microarray Industry Segmentation
-
1. Procedure
- 1.1. Immunohistochemistry
- 1.2. Fluorescence in situ hybridization (FISH)
- 1.3. In Situ Hybridization
- 1.4. Other Procedure Types
-
2. Technology
- 2.1. Polymerase Chain Reaction (PCR)
- 2.2. Next-Generation Sequencing
- 2.3. DNA Microarray
- 2.4. Other Technology Types
-
3. End-User
- 3.1. Pharmaceutical and Biotechnological Companies
- 3.2. Research Organizations
Tissue Microarray Industry Segmentation By Geography
-
1. North America
- 1.1. United States
- 1.2. Canada
- 1.3. Mexico
-
2. Europe
- 2.1. Germany
- 2.2. United Kingdom
- 2.3. France
- 2.4. Italy
- 2.5. Spain
- 2.6. Rest of Europe
-
3. Asia Pacific
- 3.1. China
- 3.2. Japan
- 3.3. India
- 3.4. Australia
- 3.5. South Korea
- 3.6. Rest of Asia Pacific
-
4. Middle East and Africa
- 4.1. GCC
- 4.2. South Africa
- 4.3. Rest of Middle East and Africa
-
5. South America
- 5.1. Brazil
- 5.2. Argentina
- 5.3. Rest of South America
Tissue Microarray Industry REPORT HIGHLIGHTS
| Aspects | Details |
|---|---|
| Study Period | 2019-2033 |
| Base Year | 2024 |
| Estimated Year | 2025 |
| Forecast Period | 2025-2033 |
| Historical Period | 2019-2024 |
| Growth Rate | CAGR of > 10.30% from 2019-2033 |
| Segmentation |
|
Table of Contents
- 1. Introduction
- 1.1. Research Scope
- 1.2. Market Segmentation
- 1.3. Research Methodology
- 1.4. Definitions and Assumptions
- 2. Executive Summary
- 2.1. Introduction
- 3. Market Dynamics
- 3.1. Introduction
- 3.2. Market Drivers
- 3.2.1. Growing Research and Development in Drug Discovery; Rising Burden of Cancer; Increasing Demand For Accurate Diagnostic Methods
- 3.3. Market Restrains
- 3.3.1. Availability of Alternative Techniques; High Cost Associated With Microarray Techniques
- 3.4. Market Trends
- 3.4.1. Immunohistochemistry Segment is Expected to Hold a Significant Market Share in the Tissue Microarray Market
- 4. Market Factor Analysis
- 4.1. Porters Five Forces
- 4.2. Supply/Value Chain
- 4.3. PESTEL analysis
- 4.4. Market Entropy
- 4.5. Patent/Trademark Analysis
- 5. Global Tissue Microarray Industry Analysis, Insights and Forecast, 2019-2031
- 5.1. Market Analysis, Insights and Forecast - by Procedure
- 5.1.1. Immunohistochemistry
- 5.1.2. Fluorescence in situ hybridization (FISH)
- 5.1.3. In Situ Hybridization
- 5.1.4. Other Procedure Types
- 5.2. Market Analysis, Insights and Forecast - by Technology
- 5.2.1. Polymerase Chain Reaction (PCR)
- 5.2.2. Next-Generation Sequencing
- 5.2.3. DNA Microarray
- 5.2.4. Other Technology Types
- 5.3. Market Analysis, Insights and Forecast - by End-User
- 5.3.1. Pharmaceutical and Biotechnological Companies
- 5.3.2. Research Organizations
- 5.4. Market Analysis, Insights and Forecast - by Region
- 5.4.1. North America
- 5.4.2. Europe
- 5.4.3. Asia Pacific
- 5.4.4. Middle East and Africa
- 5.4.5. South America
- 5.1. Market Analysis, Insights and Forecast - by Procedure
- 6. North America Tissue Microarray Industry Analysis, Insights and Forecast, 2019-2031
- 6.1. Market Analysis, Insights and Forecast - by Procedure
- 6.1.1. Immunohistochemistry
- 6.1.2. Fluorescence in situ hybridization (FISH)
- 6.1.3. In Situ Hybridization
- 6.1.4. Other Procedure Types
- 6.2. Market Analysis, Insights and Forecast - by Technology
- 6.2.1. Polymerase Chain Reaction (PCR)
- 6.2.2. Next-Generation Sequencing
- 6.2.3. DNA Microarray
- 6.2.4. Other Technology Types
- 6.3. Market Analysis, Insights and Forecast - by End-User
- 6.3.1. Pharmaceutical and Biotechnological Companies
- 6.3.2. Research Organizations
- 6.1. Market Analysis, Insights and Forecast - by Procedure
- 7. Europe Tissue Microarray Industry Analysis, Insights and Forecast, 2019-2031
- 7.1. Market Analysis, Insights and Forecast - by Procedure
- 7.1.1. Immunohistochemistry
- 7.1.2. Fluorescence in situ hybridization (FISH)
- 7.1.3. In Situ Hybridization
- 7.1.4. Other Procedure Types
- 7.2. Market Analysis, Insights and Forecast - by Technology
- 7.2.1. Polymerase Chain Reaction (PCR)
- 7.2.2. Next-Generation Sequencing
- 7.2.3. DNA Microarray
- 7.2.4. Other Technology Types
- 7.3. Market Analysis, Insights and Forecast - by End-User
- 7.3.1. Pharmaceutical and Biotechnological Companies
- 7.3.2. Research Organizations
- 7.1. Market Analysis, Insights and Forecast - by Procedure
- 8. Asia Pacific Tissue Microarray Industry Analysis, Insights and Forecast, 2019-2031
- 8.1. Market Analysis, Insights and Forecast - by Procedure
- 8.1.1. Immunohistochemistry
- 8.1.2. Fluorescence in situ hybridization (FISH)
- 8.1.3. In Situ Hybridization
- 8.1.4. Other Procedure Types
- 8.2. Market Analysis, Insights and Forecast - by Technology
- 8.2.1. Polymerase Chain Reaction (PCR)
- 8.2.2. Next-Generation Sequencing
- 8.2.3. DNA Microarray
- 8.2.4. Other Technology Types
- 8.3. Market Analysis, Insights and Forecast - by End-User
- 8.3.1. Pharmaceutical and Biotechnological Companies
- 8.3.2. Research Organizations
- 8.1. Market Analysis, Insights and Forecast - by Procedure
- 9. Middle East and Africa Tissue Microarray Industry Analysis, Insights and Forecast, 2019-2031
- 9.1. Market Analysis, Insights and Forecast - by Procedure
- 9.1.1. Immunohistochemistry
- 9.1.2. Fluorescence in situ hybridization (FISH)
- 9.1.3. In Situ Hybridization
- 9.1.4. Other Procedure Types
- 9.2. Market Analysis, Insights and Forecast - by Technology
- 9.2.1. Polymerase Chain Reaction (PCR)
- 9.2.2. Next-Generation Sequencing
- 9.2.3. DNA Microarray
- 9.2.4. Other Technology Types
- 9.3. Market Analysis, Insights and Forecast - by End-User
- 9.3.1. Pharmaceutical and Biotechnological Companies
- 9.3.2. Research Organizations
- 9.1. Market Analysis, Insights and Forecast - by Procedure
- 10. South America Tissue Microarray Industry Analysis, Insights and Forecast, 2019-2031
- 10.1. Market Analysis, Insights and Forecast - by Procedure
- 10.1.1. Immunohistochemistry
- 10.1.2. Fluorescence in situ hybridization (FISH)
- 10.1.3. In Situ Hybridization
- 10.1.4. Other Procedure Types
- 10.2. Market Analysis, Insights and Forecast - by Technology
- 10.2.1. Polymerase Chain Reaction (PCR)
- 10.2.2. Next-Generation Sequencing
- 10.2.3. DNA Microarray
- 10.2.4. Other Technology Types
- 10.3. Market Analysis, Insights and Forecast - by End-User
- 10.3.1. Pharmaceutical and Biotechnological Companies
- 10.3.2. Research Organizations
- 10.1. Market Analysis, Insights and Forecast - by Procedure
- 11. North America Tissue Microarray Industry Analysis, Insights and Forecast, 2019-2031
- 11.1. Market Analysis, Insights and Forecast - By Country/Sub-region
- 11.1.1 United States
- 11.1.2 Canada
- 11.1.3 Mexico
- 12. Europe Tissue Microarray Industry Analysis, Insights and Forecast, 2019-2031
- 12.1. Market Analysis, Insights and Forecast - By Country/Sub-region
- 12.1.1 Germany
- 12.1.2 United Kingdom
- 12.1.3 France
- 12.1.4 Italy
- 12.1.5 Spain
- 12.1.6 Rest of Europe
- 13. Asia Pacific Tissue Microarray Industry Analysis, Insights and Forecast, 2019-2031
- 13.1. Market Analysis, Insights and Forecast - By Country/Sub-region
- 13.1.1 China
- 13.1.2 Japan
- 13.1.3 India
- 13.1.4 Australia
- 13.1.5 South Korea
- 13.1.6 Rest of Asia Pacific
- 14. Middle East and Africa Tissue Microarray Industry Analysis, Insights and Forecast, 2019-2031
- 14.1. Market Analysis, Insights and Forecast - By Country/Sub-region
- 14.1.1 GCC
- 14.1.2 South Africa
- 14.1.3 Rest of Middle East and Africa
- 15. South America Tissue Microarray Industry Analysis, Insights and Forecast, 2019-2031
- 15.1. Market Analysis, Insights and Forecast - By Country/Sub-region
- 15.1.1 Brazil
- 15.1.2 Argentina
- 15.1.3 Rest of South America
- 16. Competitive Analysis
- 16.1. Global Market Share Analysis 2024
- 16.2. Company Profiles
- 16.2.1 BioCat GmbH
- 16.2.1.1. Overview
- 16.2.1.2. Products
- 16.2.1.3. SWOT Analysis
- 16.2.1.4. Recent Developments
- 16.2.1.5. Financials (Based on Availability)
- 16.2.2 Protein Biotechnologies
- 16.2.2.1. Overview
- 16.2.2.2. Products
- 16.2.2.3. SWOT Analysis
- 16.2.2.4. Recent Developments
- 16.2.2.5. Financials (Based on Availability)
- 16.2.3 PREMIER Biosoft
- 16.2.3.1. Overview
- 16.2.3.2. Products
- 16.2.3.3. SWOT Analysis
- 16.2.3.4. Recent Developments
- 16.2.3.5. Financials (Based on Availability)
- 16.2.4 Applied Microarrays
- 16.2.4.1. Overview
- 16.2.4.2. Products
- 16.2.4.3. SWOT Analysis
- 16.2.4.4. Recent Developments
- 16.2.4.5. Financials (Based on Availability)
- 16.2.5 US Biolab
- 16.2.5.1. Overview
- 16.2.5.2. Products
- 16.2.5.3. SWOT Analysis
- 16.2.5.4. Recent Developments
- 16.2.5.5. Financials (Based on Availability)
- 16.2.6 Arrayit Corporation
- 16.2.6.1. Overview
- 16.2.6.2. Products
- 16.2.6.3. SWOT Analysis
- 16.2.6.4. Recent Developments
- 16.2.6.5. Financials (Based on Availability)
- 16.2.7 Bio SB
- 16.2.7.1. Overview
- 16.2.7.2. Products
- 16.2.7.3. SWOT Analysis
- 16.2.7.4. Recent Developments
- 16.2.7.5. Financials (Based on Availability)
- 16.2.8 OriGene
- 16.2.8.1. Overview
- 16.2.8.2. Products
- 16.2.8.3. SWOT Analysis
- 16.2.8.4. Recent Developments
- 16.2.8.5. Financials (Based on Availability)
- 16.2.9 ProteoGenex
- 16.2.9.1. Overview
- 16.2.9.2. Products
- 16.2.9.3. SWOT Analysis
- 16.2.9.4. Recent Developments
- 16.2.9.5. Financials (Based on Availability)
- 16.2.10 Biocompare
- 16.2.10.1. Overview
- 16.2.10.2. Products
- 16.2.10.3. SWOT Analysis
- 16.2.10.4. Recent Developments
- 16.2.10.5. Financials (Based on Availability)
- 16.2.11 Novus Biologicals
- 16.2.11.1. Overview
- 16.2.11.2. Products
- 16.2.11.3. SWOT Analysis
- 16.2.11.4. Recent Developments
- 16.2.11.5. Financials (Based on Availability)
- 16.2.12 BioIVT
- 16.2.12.1. Overview
- 16.2.12.2. Products
- 16.2.12.3. SWOT Analysis
- 16.2.12.4. Recent Developments
- 16.2.12.5. Financials (Based on Availability)
- 16.2.1 BioCat GmbH
List of Figures
- Figure 1: Global Tissue Microarray Industry Revenue Breakdown (Million, %) by Region 2024 & 2032
- Figure 2: Global Tissue Microarray Industry Volume Breakdown (K Unit, %) by Region 2024 & 2032
- Figure 3: North America Tissue Microarray Industry Revenue (Million), by Country 2024 & 2032
- Figure 4: North America Tissue Microarray Industry Volume (K Unit), by Country 2024 & 2032
- Figure 5: North America Tissue Microarray Industry Revenue Share (%), by Country 2024 & 2032
- Figure 6: North America Tissue Microarray Industry Volume Share (%), by Country 2024 & 2032
- Figure 7: Europe Tissue Microarray Industry Revenue (Million), by Country 2024 & 2032
- Figure 8: Europe Tissue Microarray Industry Volume (K Unit), by Country 2024 & 2032
- Figure 9: Europe Tissue Microarray Industry Revenue Share (%), by Country 2024 & 2032
- Figure 10: Europe Tissue Microarray Industry Volume Share (%), by Country 2024 & 2032
- Figure 11: Asia Pacific Tissue Microarray Industry Revenue (Million), by Country 2024 & 2032
- Figure 12: Asia Pacific Tissue Microarray Industry Volume (K Unit), by Country 2024 & 2032
- Figure 13: Asia Pacific Tissue Microarray Industry Revenue Share (%), by Country 2024 & 2032
- Figure 14: Asia Pacific Tissue Microarray Industry Volume Share (%), by Country 2024 & 2032
- Figure 15: Middle East and Africa Tissue Microarray Industry Revenue (Million), by Country 2024 & 2032
- Figure 16: Middle East and Africa Tissue Microarray Industry Volume (K Unit), by Country 2024 & 2032
- Figure 17: Middle East and Africa Tissue Microarray Industry Revenue Share (%), by Country 2024 & 2032
- Figure 18: Middle East and Africa Tissue Microarray Industry Volume Share (%), by Country 2024 & 2032
- Figure 19: South America Tissue Microarray Industry Revenue (Million), by Country 2024 & 2032
- Figure 20: South America Tissue Microarray Industry Volume (K Unit), by Country 2024 & 2032
- Figure 21: South America Tissue Microarray Industry Revenue Share (%), by Country 2024 & 2032
- Figure 22: South America Tissue Microarray Industry Volume Share (%), by Country 2024 & 2032
- Figure 23: North America Tissue Microarray Industry Revenue (Million), by Procedure 2024 & 2032
- Figure 24: North America Tissue Microarray Industry Volume (K Unit), by Procedure 2024 & 2032
- Figure 25: North America Tissue Microarray Industry Revenue Share (%), by Procedure 2024 & 2032
- Figure 26: North America Tissue Microarray Industry Volume Share (%), by Procedure 2024 & 2032
- Figure 27: North America Tissue Microarray Industry Revenue (Million), by Technology 2024 & 2032
- Figure 28: North America Tissue Microarray Industry Volume (K Unit), by Technology 2024 & 2032
- Figure 29: North America Tissue Microarray Industry Revenue Share (%), by Technology 2024 & 2032
- Figure 30: North America Tissue Microarray Industry Volume Share (%), by Technology 2024 & 2032
- Figure 31: North America Tissue Microarray Industry Revenue (Million), by End-User 2024 & 2032
- Figure 32: North America Tissue Microarray Industry Volume (K Unit), by End-User 2024 & 2032
- Figure 33: North America Tissue Microarray Industry Revenue Share (%), by End-User 2024 & 2032
- Figure 34: North America Tissue Microarray Industry Volume Share (%), by End-User 2024 & 2032
- Figure 35: North America Tissue Microarray Industry Revenue (Million), by Country 2024 & 2032
- Figure 36: North America Tissue Microarray Industry Volume (K Unit), by Country 2024 & 2032
- Figure 37: North America Tissue Microarray Industry Revenue Share (%), by Country 2024 & 2032
- Figure 38: North America Tissue Microarray Industry Volume Share (%), by Country 2024 & 2032
- Figure 39: Europe Tissue Microarray Industry Revenue (Million), by Procedure 2024 & 2032
- Figure 40: Europe Tissue Microarray Industry Volume (K Unit), by Procedure 2024 & 2032
- Figure 41: Europe Tissue Microarray Industry Revenue Share (%), by Procedure 2024 & 2032
- Figure 42: Europe Tissue Microarray Industry Volume Share (%), by Procedure 2024 & 2032
- Figure 43: Europe Tissue Microarray Industry Revenue (Million), by Technology 2024 & 2032
- Figure 44: Europe Tissue Microarray Industry Volume (K Unit), by Technology 2024 & 2032
- Figure 45: Europe Tissue Microarray Industry Revenue Share (%), by Technology 2024 & 2032
- Figure 46: Europe Tissue Microarray Industry Volume Share (%), by Technology 2024 & 2032
- Figure 47: Europe Tissue Microarray Industry Revenue (Million), by End-User 2024 & 2032
- Figure 48: Europe Tissue Microarray Industry Volume (K Unit), by End-User 2024 & 2032
- Figure 49: Europe Tissue Microarray Industry Revenue Share (%), by End-User 2024 & 2032
- Figure 50: Europe Tissue Microarray Industry Volume Share (%), by End-User 2024 & 2032
- Figure 51: Europe Tissue Microarray Industry Revenue (Million), by Country 2024 & 2032
- Figure 52: Europe Tissue Microarray Industry Volume (K Unit), by Country 2024 & 2032
- Figure 53: Europe Tissue Microarray Industry Revenue Share (%), by Country 2024 & 2032
- Figure 54: Europe Tissue Microarray Industry Volume Share (%), by Country 2024 & 2032
- Figure 55: Asia Pacific Tissue Microarray Industry Revenue (Million), by Procedure 2024 & 2032
- Figure 56: Asia Pacific Tissue Microarray Industry Volume (K Unit), by Procedure 2024 & 2032
- Figure 57: Asia Pacific Tissue Microarray Industry Revenue Share (%), by Procedure 2024 & 2032
- Figure 58: Asia Pacific Tissue Microarray Industry Volume Share (%), by Procedure 2024 & 2032
- Figure 59: Asia Pacific Tissue Microarray Industry Revenue (Million), by Technology 2024 & 2032
- Figure 60: Asia Pacific Tissue Microarray Industry Volume (K Unit), by Technology 2024 & 2032
- Figure 61: Asia Pacific Tissue Microarray Industry Revenue Share (%), by Technology 2024 & 2032
- Figure 62: Asia Pacific Tissue Microarray Industry Volume Share (%), by Technology 2024 & 2032
- Figure 63: Asia Pacific Tissue Microarray Industry Revenue (Million), by End-User 2024 & 2032
- Figure 64: Asia Pacific Tissue Microarray Industry Volume (K Unit), by End-User 2024 & 2032
- Figure 65: Asia Pacific Tissue Microarray Industry Revenue Share (%), by End-User 2024 & 2032
- Figure 66: Asia Pacific Tissue Microarray Industry Volume Share (%), by End-User 2024 & 2032
- Figure 67: Asia Pacific Tissue Microarray Industry Revenue (Million), by Country 2024 & 2032
- Figure 68: Asia Pacific Tissue Microarray Industry Volume (K Unit), by Country 2024 & 2032
- Figure 69: Asia Pacific Tissue Microarray Industry Revenue Share (%), by Country 2024 & 2032
- Figure 70: Asia Pacific Tissue Microarray Industry Volume Share (%), by Country 2024 & 2032
- Figure 71: Middle East and Africa Tissue Microarray Industry Revenue (Million), by Procedure 2024 & 2032
- Figure 72: Middle East and Africa Tissue Microarray Industry Volume (K Unit), by Procedure 2024 & 2032
- Figure 73: Middle East and Africa Tissue Microarray Industry Revenue Share (%), by Procedure 2024 & 2032
- Figure 74: Middle East and Africa Tissue Microarray Industry Volume Share (%), by Procedure 2024 & 2032
- Figure 75: Middle East and Africa Tissue Microarray Industry Revenue (Million), by Technology 2024 & 2032
- Figure 76: Middle East and Africa Tissue Microarray Industry Volume (K Unit), by Technology 2024 & 2032
- Figure 77: Middle East and Africa Tissue Microarray Industry Revenue Share (%), by Technology 2024 & 2032
- Figure 78: Middle East and Africa Tissue Microarray Industry Volume Share (%), by Technology 2024 & 2032
- Figure 79: Middle East and Africa Tissue Microarray Industry Revenue (Million), by End-User 2024 & 2032
- Figure 80: Middle East and Africa Tissue Microarray Industry Volume (K Unit), by End-User 2024 & 2032
- Figure 81: Middle East and Africa Tissue Microarray Industry Revenue Share (%), by End-User 2024 & 2032
- Figure 82: Middle East and Africa Tissue Microarray Industry Volume Share (%), by End-User 2024 & 2032
- Figure 83: Middle East and Africa Tissue Microarray Industry Revenue (Million), by Country 2024 & 2032
- Figure 84: Middle East and Africa Tissue Microarray Industry Volume (K Unit), by Country 2024 & 2032
- Figure 85: Middle East and Africa Tissue Microarray Industry Revenue Share (%), by Country 2024 & 2032
- Figure 86: Middle East and Africa Tissue Microarray Industry Volume Share (%), by Country 2024 & 2032
- Figure 87: South America Tissue Microarray Industry Revenue (Million), by Procedure 2024 & 2032
- Figure 88: South America Tissue Microarray Industry Volume (K Unit), by Procedure 2024 & 2032
- Figure 89: South America Tissue Microarray Industry Revenue Share (%), by Procedure 2024 & 2032
- Figure 90: South America Tissue Microarray Industry Volume Share (%), by Procedure 2024 & 2032
- Figure 91: South America Tissue Microarray Industry Revenue (Million), by Technology 2024 & 2032
- Figure 92: South America Tissue Microarray Industry Volume (K Unit), by Technology 2024 & 2032
- Figure 93: South America Tissue Microarray Industry Revenue Share (%), by Technology 2024 & 2032
- Figure 94: South America Tissue Microarray Industry Volume Share (%), by Technology 2024 & 2032
- Figure 95: South America Tissue Microarray Industry Revenue (Million), by End-User 2024 & 2032
- Figure 96: South America Tissue Microarray Industry Volume (K Unit), by End-User 2024 & 2032
- Figure 97: South America Tissue Microarray Industry Revenue Share (%), by End-User 2024 & 2032
- Figure 98: South America Tissue Microarray Industry Volume Share (%), by End-User 2024 & 2032
- Figure 99: South America Tissue Microarray Industry Revenue (Million), by Country 2024 & 2032
- Figure 100: South America Tissue Microarray Industry Volume (K Unit), by Country 2024 & 2032
- Figure 101: South America Tissue Microarray Industry Revenue Share (%), by Country 2024 & 2032
- Figure 102: South America Tissue Microarray Industry Volume Share (%), by Country 2024 & 2032
List of Tables
- Table 1: Global Tissue Microarray Industry Revenue Million Forecast, by Region 2019 & 2032
- Table 2: Global Tissue Microarray Industry Volume K Unit Forecast, by Region 2019 & 2032
- Table 3: Global Tissue Microarray Industry Revenue Million Forecast, by Procedure 2019 & 2032
- Table 4: Global Tissue Microarray Industry Volume K Unit Forecast, by Procedure 2019 & 2032
- Table 5: Global Tissue Microarray Industry Revenue Million Forecast, by Technology 2019 & 2032
- Table 6: Global Tissue Microarray Industry Volume K Unit Forecast, by Technology 2019 & 2032
- Table 7: Global Tissue Microarray Industry Revenue Million Forecast, by End-User 2019 & 2032
- Table 8: Global Tissue Microarray Industry Volume K Unit Forecast, by End-User 2019 & 2032
- Table 9: Global Tissue Microarray Industry Revenue Million Forecast, by Region 2019 & 2032
- Table 10: Global Tissue Microarray Industry Volume K Unit Forecast, by Region 2019 & 2032
- Table 11: Global Tissue Microarray Industry Revenue Million Forecast, by Country 2019 & 2032
- Table 12: Global Tissue Microarray Industry Volume K Unit Forecast, by Country 2019 & 2032
- Table 13: United States Tissue Microarray Industry Revenue (Million) Forecast, by Application 2019 & 2032
- Table 14: United States Tissue Microarray Industry Volume (K Unit) Forecast, by Application 2019 & 2032
- Table 15: Canada Tissue Microarray Industry Revenue (Million) Forecast, by Application 2019 & 2032
- Table 16: Canada Tissue Microarray Industry Volume (K Unit) Forecast, by Application 2019 & 2032
- Table 17: Mexico Tissue Microarray Industry Revenue (Million) Forecast, by Application 2019 & 2032
- Table 18: Mexico Tissue Microarray Industry Volume (K Unit) Forecast, by Application 2019 & 2032
- Table 19: Global Tissue Microarray Industry Revenue Million Forecast, by Country 2019 & 2032
- Table 20: Global Tissue Microarray Industry Volume K Unit Forecast, by Country 2019 & 2032
- Table 21: Germany Tissue Microarray Industry Revenue (Million) Forecast, by Application 2019 & 2032
- Table 22: Germany Tissue Microarray Industry Volume (K Unit) Forecast, by Application 2019 & 2032
- Table 23: United Kingdom Tissue Microarray Industry Revenue (Million) Forecast, by Application 2019 & 2032
- Table 24: United Kingdom Tissue Microarray Industry Volume (K Unit) Forecast, by Application 2019 & 2032
- Table 25: France Tissue Microarray Industry Revenue (Million) Forecast, by Application 2019 & 2032
- Table 26: France Tissue Microarray Industry Volume (K Unit) Forecast, by Application 2019 & 2032
- Table 27: Italy Tissue Microarray Industry Revenue (Million) Forecast, by Application 2019 & 2032
- Table 28: Italy Tissue Microarray Industry Volume (K Unit) Forecast, by Application 2019 & 2032
- Table 29: Spain Tissue Microarray Industry Revenue (Million) Forecast, by Application 2019 & 2032
- Table 30: Spain Tissue Microarray Industry Volume (K Unit) Forecast, by Application 2019 & 2032
- Table 31: Rest of Europe Tissue Microarray Industry Revenue (Million) Forecast, by Application 2019 & 2032
- Table 32: Rest of Europe Tissue Microarray Industry Volume (K Unit) Forecast, by Application 2019 & 2032
- Table 33: Global Tissue Microarray Industry Revenue Million Forecast, by Country 2019 & 2032
- Table 34: Global Tissue Microarray Industry Volume K Unit Forecast, by Country 2019 & 2032
- Table 35: China Tissue Microarray Industry Revenue (Million) Forecast, by Application 2019 & 2032
- Table 36: China Tissue Microarray Industry Volume (K Unit) Forecast, by Application 2019 & 2032
- Table 37: Japan Tissue Microarray Industry Revenue (Million) Forecast, by Application 2019 & 2032
- Table 38: Japan Tissue Microarray Industry Volume (K Unit) Forecast, by Application 2019 & 2032
- Table 39: India Tissue Microarray Industry Revenue (Million) Forecast, by Application 2019 & 2032
- Table 40: India Tissue Microarray Industry Volume (K Unit) Forecast, by Application 2019 & 2032
- Table 41: Australia Tissue Microarray Industry Revenue (Million) Forecast, by Application 2019 & 2032
- Table 42: Australia Tissue Microarray Industry Volume (K Unit) Forecast, by Application 2019 & 2032
- Table 43: South Korea Tissue Microarray Industry Revenue (Million) Forecast, by Application 2019 & 2032
- Table 44: South Korea Tissue Microarray Industry Volume (K Unit) Forecast, by Application 2019 & 2032
- Table 45: Rest of Asia Pacific Tissue Microarray Industry Revenue (Million) Forecast, by Application 2019 & 2032
- Table 46: Rest of Asia Pacific Tissue Microarray Industry Volume (K Unit) Forecast, by Application 2019 & 2032
- Table 47: Global Tissue Microarray Industry Revenue Million Forecast, by Country 2019 & 2032
- Table 48: Global Tissue Microarray Industry Volume K Unit Forecast, by Country 2019 & 2032
- Table 49: GCC Tissue Microarray Industry Revenue (Million) Forecast, by Application 2019 & 2032
- Table 50: GCC Tissue Microarray Industry Volume (K Unit) Forecast, by Application 2019 & 2032
- Table 51: South Africa Tissue Microarray Industry Revenue (Million) Forecast, by Application 2019 & 2032
- Table 52: South Africa Tissue Microarray Industry Volume (K Unit) Forecast, by Application 2019 & 2032
- Table 53: Rest of Middle East and Africa Tissue Microarray Industry Revenue (Million) Forecast, by Application 2019 & 2032
- Table 54: Rest of Middle East and Africa Tissue Microarray Industry Volume (K Unit) Forecast, by Application 2019 & 2032
- Table 55: Global Tissue Microarray Industry Revenue Million Forecast, by Country 2019 & 2032
- Table 56: Global Tissue Microarray Industry Volume K Unit Forecast, by Country 2019 & 2032
- Table 57: Brazil Tissue Microarray Industry Revenue (Million) Forecast, by Application 2019 & 2032
- Table 58: Brazil Tissue Microarray Industry Volume (K Unit) Forecast, by Application 2019 & 2032
- Table 59: Argentina Tissue Microarray Industry Revenue (Million) Forecast, by Application 2019 & 2032
- Table 60: Argentina Tissue Microarray Industry Volume (K Unit) Forecast, by Application 2019 & 2032
- Table 61: Rest of South America Tissue Microarray Industry Revenue (Million) Forecast, by Application 2019 & 2032
- Table 62: Rest of South America Tissue Microarray Industry Volume (K Unit) Forecast, by Application 2019 & 2032
- Table 63: Global Tissue Microarray Industry Revenue Million Forecast, by Procedure 2019 & 2032
- Table 64: Global Tissue Microarray Industry Volume K Unit Forecast, by Procedure 2019 & 2032
- Table 65: Global Tissue Microarray Industry Revenue Million Forecast, by Technology 2019 & 2032
- Table 66: Global Tissue Microarray Industry Volume K Unit Forecast, by Technology 2019 & 2032
- Table 67: Global Tissue Microarray Industry Revenue Million Forecast, by End-User 2019 & 2032
- Table 68: Global Tissue Microarray Industry Volume K Unit Forecast, by End-User 2019 & 2032
- Table 69: Global Tissue Microarray Industry Revenue Million Forecast, by Country 2019 & 2032
- Table 70: Global Tissue Microarray Industry Volume K Unit Forecast, by Country 2019 & 2032
- Table 71: United States Tissue Microarray Industry Revenue (Million) Forecast, by Application 2019 & 2032
- Table 72: United States Tissue Microarray Industry Volume (K Unit) Forecast, by Application 2019 & 2032
- Table 73: Canada Tissue Microarray Industry Revenue (Million) Forecast, by Application 2019 & 2032
- Table 74: Canada Tissue Microarray Industry Volume (K Unit) Forecast, by Application 2019 & 2032
- Table 75: Mexico Tissue Microarray Industry Revenue (Million) Forecast, by Application 2019 & 2032
- Table 76: Mexico Tissue Microarray Industry Volume (K Unit) Forecast, by Application 2019 & 2032
- Table 77: Global Tissue Microarray Industry Revenue Million Forecast, by Procedure 2019 & 2032
- Table 78: Global Tissue Microarray Industry Volume K Unit Forecast, by Procedure 2019 & 2032
- Table 79: Global Tissue Microarray Industry Revenue Million Forecast, by Technology 2019 & 2032
- Table 80: Global Tissue Microarray Industry Volume K Unit Forecast, by Technology 2019 & 2032
- Table 81: Global Tissue Microarray Industry Revenue Million Forecast, by End-User 2019 & 2032
- Table 82: Global Tissue Microarray Industry Volume K Unit Forecast, by End-User 2019 & 2032
- Table 83: Global Tissue Microarray Industry Revenue Million Forecast, by Country 2019 & 2032
- Table 84: Global Tissue Microarray Industry Volume K Unit Forecast, by Country 2019 & 2032
- Table 85: Germany Tissue Microarray Industry Revenue (Million) Forecast, by Application 2019 & 2032
- Table 86: Germany Tissue Microarray Industry Volume (K Unit) Forecast, by Application 2019 & 2032
- Table 87: United Kingdom Tissue Microarray Industry Revenue (Million) Forecast, by Application 2019 & 2032
- Table 88: United Kingdom Tissue Microarray Industry Volume (K Unit) Forecast, by Application 2019 & 2032
- Table 89: France Tissue Microarray Industry Revenue (Million) Forecast, by Application 2019 & 2032
- Table 90: France Tissue Microarray Industry Volume (K Unit) Forecast, by Application 2019 & 2032
- Table 91: Italy Tissue Microarray Industry Revenue (Million) Forecast, by Application 2019 & 2032
- Table 92: Italy Tissue Microarray Industry Volume (K Unit) Forecast, by Application 2019 & 2032
- Table 93: Spain Tissue Microarray Industry Revenue (Million) Forecast, by Application 2019 & 2032
- Table 94: Spain Tissue Microarray Industry Volume (K Unit) Forecast, by Application 2019 & 2032
- Table 95: Rest of Europe Tissue Microarray Industry Revenue (Million) Forecast, by Application 2019 & 2032
- Table 96: Rest of Europe Tissue Microarray Industry Volume (K Unit) Forecast, by Application 2019 & 2032
- Table 97: Global Tissue Microarray Industry Revenue Million Forecast, by Procedure 2019 & 2032
- Table 98: Global Tissue Microarray Industry Volume K Unit Forecast, by Procedure 2019 & 2032
- Table 99: Global Tissue Microarray Industry Revenue Million Forecast, by Technology 2019 & 2032
- Table 100: Global Tissue Microarray Industry Volume K Unit Forecast, by Technology 2019 & 2032
- Table 101: Global Tissue Microarray Industry Revenue Million Forecast, by End-User 2019 & 2032
- Table 102: Global Tissue Microarray Industry Volume K Unit Forecast, by End-User 2019 & 2032
- Table 103: Global Tissue Microarray Industry Revenue Million Forecast, by Country 2019 & 2032
- Table 104: Global Tissue Microarray Industry Volume K Unit Forecast, by Country 2019 & 2032
- Table 105: China Tissue Microarray Industry Revenue (Million) Forecast, by Application 2019 & 2032
- Table 106: China Tissue Microarray Industry Volume (K Unit) Forecast, by Application 2019 & 2032
- Table 107: Japan Tissue Microarray Industry Revenue (Million) Forecast, by Application 2019 & 2032
- Table 108: Japan Tissue Microarray Industry Volume (K Unit) Forecast, by Application 2019 & 2032
- Table 109: India Tissue Microarray Industry Revenue (Million) Forecast, by Application 2019 & 2032
- Table 110: India Tissue Microarray Industry Volume (K Unit) Forecast, by Application 2019 & 2032
- Table 111: Australia Tissue Microarray Industry Revenue (Million) Forecast, by Application 2019 & 2032
- Table 112: Australia Tissue Microarray Industry Volume (K Unit) Forecast, by Application 2019 & 2032
- Table 113: South Korea Tissue Microarray Industry Revenue (Million) Forecast, by Application 2019 & 2032
- Table 114: South Korea Tissue Microarray Industry Volume (K Unit) Forecast, by Application 2019 & 2032
- Table 115: Rest of Asia Pacific Tissue Microarray Industry Revenue (Million) Forecast, by Application 2019 & 2032
- Table 116: Rest of Asia Pacific Tissue Microarray Industry Volume (K Unit) Forecast, by Application 2019 & 2032
- Table 117: Global Tissue Microarray Industry Revenue Million Forecast, by Procedure 2019 & 2032
- Table 118: Global Tissue Microarray Industry Volume K Unit Forecast, by Procedure 2019 & 2032
- Table 119: Global Tissue Microarray Industry Revenue Million Forecast, by Technology 2019 & 2032
- Table 120: Global Tissue Microarray Industry Volume K Unit Forecast, by Technology 2019 & 2032
- Table 121: Global Tissue Microarray Industry Revenue Million Forecast, by End-User 2019 & 2032
- Table 122: Global Tissue Microarray Industry Volume K Unit Forecast, by End-User 2019 & 2032
- Table 123: Global Tissue Microarray Industry Revenue Million Forecast, by Country 2019 & 2032
- Table 124: Global Tissue Microarray Industry Volume K Unit Forecast, by Country 2019 & 2032
- Table 125: GCC Tissue Microarray Industry Revenue (Million) Forecast, by Application 2019 & 2032
- Table 126: GCC Tissue Microarray Industry Volume (K Unit) Forecast, by Application 2019 & 2032
- Table 127: South Africa Tissue Microarray Industry Revenue (Million) Forecast, by Application 2019 & 2032
- Table 128: South Africa Tissue Microarray Industry Volume (K Unit) Forecast, by Application 2019 & 2032
- Table 129: Rest of Middle East and Africa Tissue Microarray Industry Revenue (Million) Forecast, by Application 2019 & 2032
- Table 130: Rest of Middle East and Africa Tissue Microarray Industry Volume (K Unit) Forecast, by Application 2019 & 2032
- Table 131: Global Tissue Microarray Industry Revenue Million Forecast, by Procedure 2019 & 2032
- Table 132: Global Tissue Microarray Industry Volume K Unit Forecast, by Procedure 2019 & 2032
- Table 133: Global Tissue Microarray Industry Revenue Million Forecast, by Technology 2019 & 2032
- Table 134: Global Tissue Microarray Industry Volume K Unit Forecast, by Technology 2019 & 2032
- Table 135: Global Tissue Microarray Industry Revenue Million Forecast, by End-User 2019 & 2032
- Table 136: Global Tissue Microarray Industry Volume K Unit Forecast, by End-User 2019 & 2032
- Table 137: Global Tissue Microarray Industry Revenue Million Forecast, by Country 2019 & 2032
- Table 138: Global Tissue Microarray Industry Volume K Unit Forecast, by Country 2019 & 2032
- Table 139: Brazil Tissue Microarray Industry Revenue (Million) Forecast, by Application 2019 & 2032
- Table 140: Brazil Tissue Microarray Industry Volume (K Unit) Forecast, by Application 2019 & 2032
- Table 141: Argentina Tissue Microarray Industry Revenue (Million) Forecast, by Application 2019 & 2032
- Table 142: Argentina Tissue Microarray Industry Volume (K Unit) Forecast, by Application 2019 & 2032
- Table 143: Rest of South America Tissue Microarray Industry Revenue (Million) Forecast, by Application 2019 & 2032
- Table 144: Rest of South America Tissue Microarray Industry Volume (K Unit) Forecast, by Application 2019 & 2032
Frequently Asked Questions
1. What is the projected Compound Annual Growth Rate (CAGR) of the Tissue Microarray Industry?
The projected CAGR is approximately > 10.30%.
2. Which companies are prominent players in the Tissue Microarray Industry?
Key companies in the market include BioCat GmbH, Protein Biotechnologies, PREMIER Biosoft, Applied Microarrays, US Biolab, Arrayit Corporation, Bio SB, OriGene, ProteoGenex, Biocompare, Novus Biologicals, BioIVT.
3. What are the main segments of the Tissue Microarray Industry?
The market segments include Procedure, Technology, End-User.
4. Can you provide details about the market size?
The market size is estimated to be USD XX Million as of 2022.
5. What are some drivers contributing to market growth?
Growing Research and Development in Drug Discovery; Rising Burden of Cancer; Increasing Demand For Accurate Diagnostic Methods.
6. What are the notable trends driving market growth?
Immunohistochemistry Segment is Expected to Hold a Significant Market Share in the Tissue Microarray Market.
7. Are there any restraints impacting market growth?
Availability of Alternative Techniques; High Cost Associated With Microarray Techniques.
8. Can you provide examples of recent developments in the market?
May 2023: PathogenDx planned to launch a microarray-based test for urinary tract infections in late 2023. The new urinary tract infection assay will help in the identification of 26 pathogens and 20 associated antimicrobial resistance genes in one multiplexed test and favor targeted therapies for patients.
9. What pricing options are available for accessing the report?
Pricing options include single-user, multi-user, and enterprise licenses priced at USD 4750, USD 5250, and USD 8750 respectively.
10. Is the market size provided in terms of value or volume?
The market size is provided in terms of value, measured in Million and volume, measured in K Unit.
11. Are there any specific market keywords associated with the report?
Yes, the market keyword associated with the report is "Tissue Microarray Industry," which aids in identifying and referencing the specific market segment covered.
12. How do I determine which pricing option suits my needs best?
The pricing options vary based on user requirements and access needs. Individual users may opt for single-user licenses, while businesses requiring broader access may choose multi-user or enterprise licenses for cost-effective access to the report.
13. Are there any additional resources or data provided in the Tissue Microarray Industry report?
While the report offers comprehensive insights, it's advisable to review the specific contents or supplementary materials provided to ascertain if additional resources or data are available.
14. How can I stay updated on further developments or reports in the Tissue Microarray Industry?
To stay informed about further developments, trends, and reports in the Tissue Microarray Industry, consider subscribing to industry newsletters, following relevant companies and organizations, or regularly checking reputable industry news sources and publications.
Methodology
Step 1 - Identification of Relevant Samples Size from Population Database


Step 2 - Approaches for Defining Global Market Size (Value, Volume* & Price*)

Note*: In applicable scenarios
Step 3 - Data Sources
Primary Research
- Web Analytics
- Survey Reports
- Research Institute
- Latest Research Reports
- Opinion Leaders
Secondary Research
- Annual Reports
- White Paper
- Latest Press Release
- Industry Association
- Paid Database
- Investor Presentations

Step 4 - Data Triangulation
Involves using different sources of information in order to increase the validity of a study
These sources are likely to be stakeholders in a program - participants, other researchers, program staff, other community members, and so on.
Then we put all data in single framework & apply various statistical tools to find out the dynamic on the market.
During the analysis stage, feedback from the stakeholder groups would be compared to determine areas of agreement as well as areas of divergence
