

Key Insights
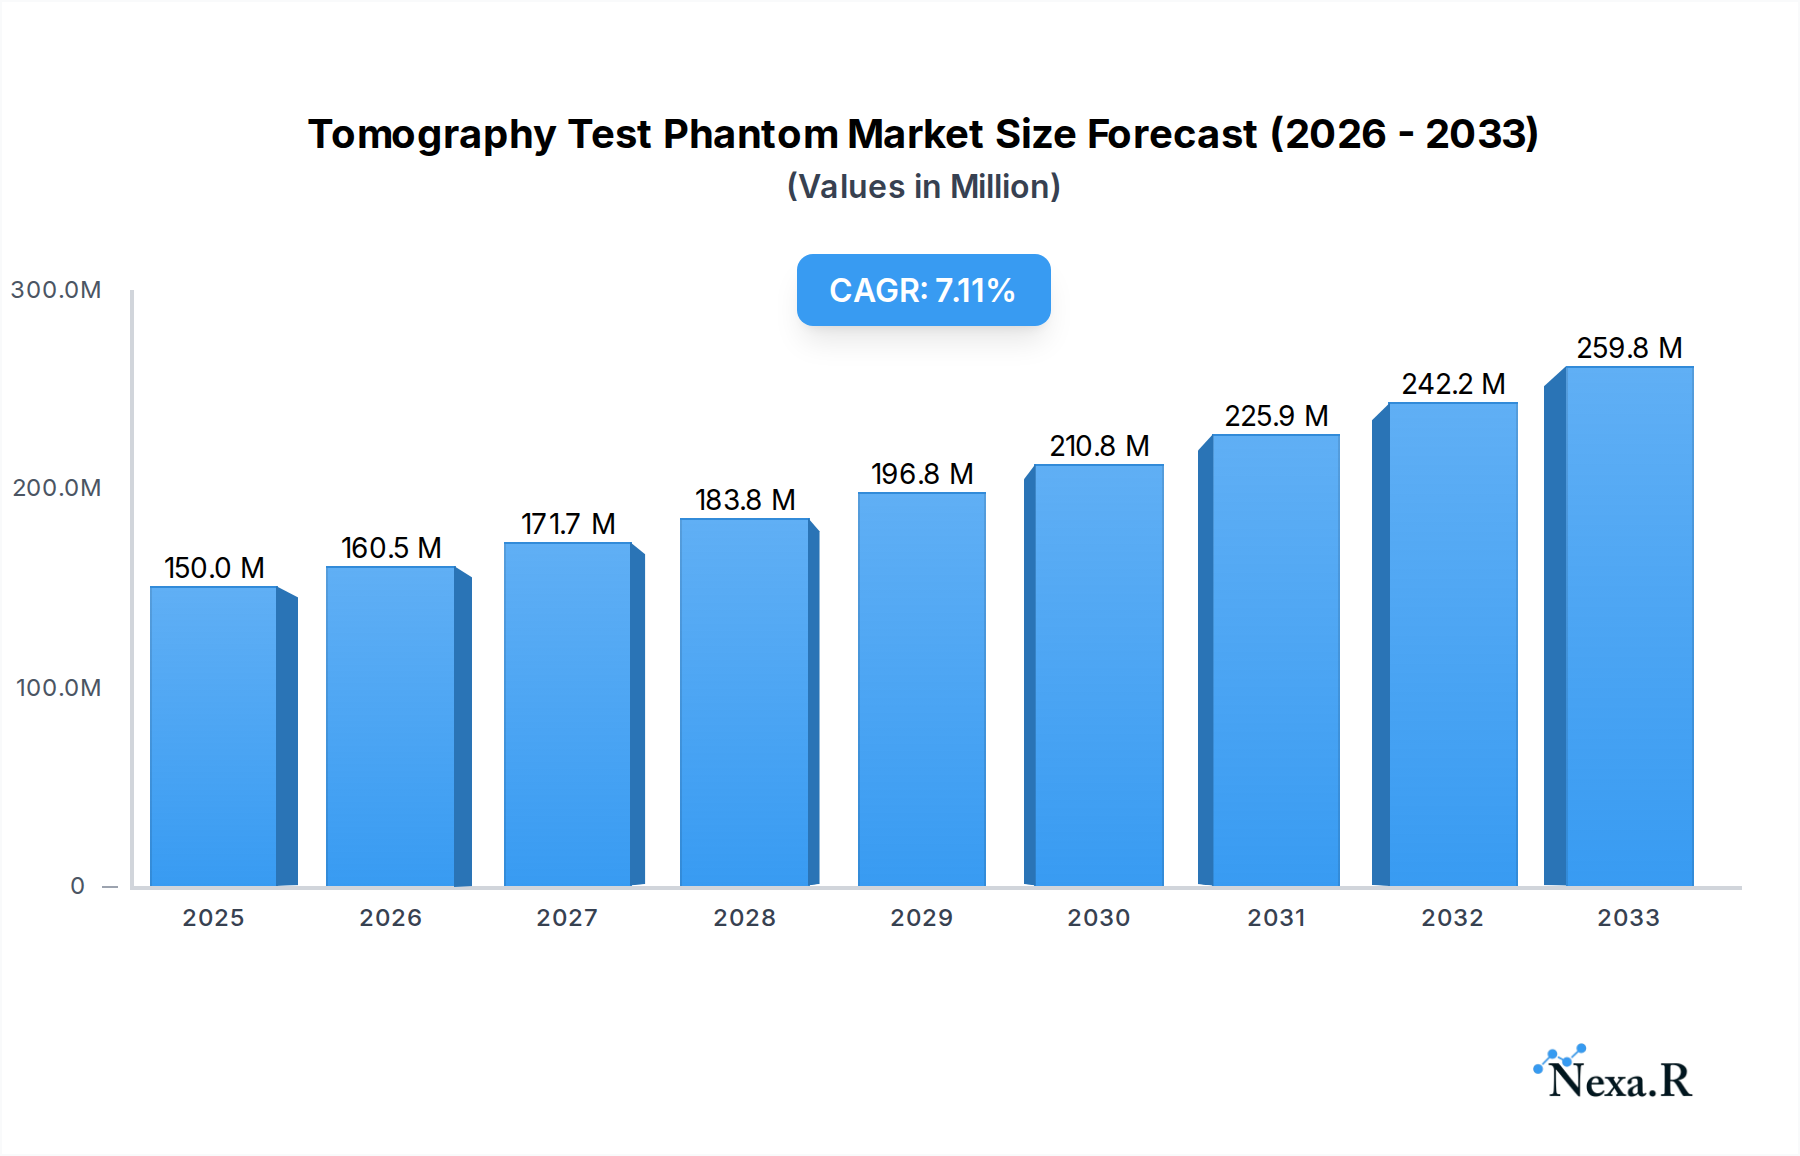
The global tomography test phantom market is poised for significant expansion, projected to reach $150 million in 2025. This growth is underpinned by a robust Compound Annual Growth Rate (CAGR) of 7%, indicating sustained demand and innovation within the sector. The increasing adoption of advanced imaging modalities like CT and MRI in hospitals and laboratories, driven by the need for precise diagnostic imaging and quality assurance in medical devices, forms a primary growth engine. Furthermore, the expanding applications in research and development, particularly in the pharmaceutical and biotechnology sectors for drug efficacy testing and preclinical studies, are contributing to market dynamism. The market is segmented by application into Hospital, Laboratory, and Other, with Hospitals expected to hold the largest share due to their extensive use of tomographic imaging. Pediatric applications are also seeing a rise, necessitating specialized phantoms for child imaging. The market is characterized by a competitive landscape with key players like Fluke Biomedical, CIRS, and Pure Imaging Phantoms actively engaged in product development and strategic partnerships to enhance their market presence.

Tomography Test Phantom Market Size (In Million)
The projected expansion of the tomography test phantom market is also influenced by emerging trends such as the development of multi-modality phantoms capable of simulating various imaging techniques, and the integration of artificial intelligence for phantom data analysis, leading to more efficient quality control. The increasing prevalence of chronic diseases globally, requiring advanced diagnostic imaging for timely and accurate detection, further fuels the demand for these essential testing tools. While the market presents substantial opportunities, potential restraints include the high cost of sophisticated phantom development and calibration, and the limited availability of skilled professionals for their operation and interpretation. Nevertheless, the continued focus on enhancing diagnostic accuracy, patient safety, and medical device performance worldwide ensures a promising future for the tomography test phantom market, with ongoing investments in research and development expected to drive further innovation and market penetration across all major regions.
Tomography Test Phantom Company Market Share
Tomography Test Phantom Market Report: Comprehensive Analysis & Future Outlook (2019-2033)
This in-depth report provides a definitive analysis of the global Tomography Test Phantom market, offering critical insights for stakeholders across the healthcare and medical imaging industries. Spanning the historical period of 2019-2024 and projecting future trends through 2033, with a base year of 2025 and an estimated year of 2025, this study delves into market dynamics, growth trajectories, regional dominance, product innovation, and key players. Leveraging high-traffic SEO keywords such as "CT phantom," "MRI phantom," "radiology test phantoms," "medical imaging quality control," and "diagnostic phantom solutions," this report is optimized for maximum search engine visibility and designed to engage professionals seeking to understand the evolving landscape of tomography test phantoms. The analysis encompasses both parent and child markets, providing a holistic view of market attractions and opportunities.
Tomography Test Phantom Market Dynamics & Structure
The global Tomography Test Phantom market, encompassing the critical parent market of medical imaging quality control and the child market of diagnostic phantom solutions, exhibits a moderate level of concentration. Leading entities like CIRS, Fluke Biomedical, and Modus Medical Devices are prominent, but the presence of specialized manufacturers such as 3Done Australia, Hongkong Medi, Pure Imaging Phantoms, True Phantom Solutions, and Yezitronix indicates a vibrant competitive environment. Technological innovation is a primary driver, with advancements in materials science and 3D printing enabling the creation of more sophisticated and realistic phantoms for CT, MRI, PET, and SPECT imaging. Regulatory frameworks, particularly those set by the FDA and EMA for medical device quality assurance, significantly influence product development and market entry. Competitive product substitutes, while limited in their ability to perfectly replicate complex tissue properties, include virtual phantoms and simulation software, posing a minor challenge. End-user demographics are predominantly hospitals and diagnostic laboratories, with a growing segment in research institutions and specialized imaging centers. Mergers and acquisitions (M&A) trends are gradually increasing as larger players seek to consolidate their market position and acquire innovative technologies. For instance, approximately 2-3 M&A deals are anticipated within the forecast period, valued at an estimated $30-50 million each, driven by the need for comprehensive quality assurance solutions.
- Market Concentration: Moderate, with key players and specialized manufacturers.
- Technological Innovation Drivers: Advanced materials, 3D printing for anatomical accuracy, multi-modality phantom development.
- Regulatory Frameworks: FDA, EMA guidelines for medical device compliance and imaging performance standards.
- Competitive Product Substitutes: Simulation software, virtual phantoms.
- End-User Demographics: Hospitals (estimated 65% market share), Diagnostic Laboratories (estimated 25% market share), Research Institutions (estimated 10% market share).
- M&A Trends: Increasing, driven by consolidation and technology acquisition.
Tomography Test Phantom Growth Trends & Insights
The global Tomography Test Phantom market is poised for robust growth, projected to expand at a Compound Annual Growth Rate (CAGR) of approximately 7.5% from 2025 to 2033. This expansion is fundamentally driven by the escalating demand for stringent quality control in medical imaging, a critical factor in accurate diagnosis and effective patient treatment. The market size, estimated at approximately $450 million in the base year 2025, is forecast to reach over $750 million by the end of the forecast period in 2033. Adoption rates of advanced tomography test phantoms are accelerating as healthcare providers increasingly recognize their indispensable role in ensuring the reliability and consistency of imaging modalities like CT scanners, MRI machines, and PET systems. Technological disruptions, such as the integration of artificial intelligence (AI) for automated phantom analysis and the development of hyper-realistic phantoms mimicking diverse pathologies, are further stimulating market penetration. Consumer behavior shifts are evident, with a growing preference for phantoms that offer multi-modality compatibility, customizable parameters, and cost-effectiveness, particularly for specialized applications. The increasing prevalence of chronic diseases and an aging global population necessitate more frequent and advanced diagnostic imaging, directly translating into a higher demand for accurate calibration and validation tools like tomography test phantoms. Furthermore, evolving reimbursement policies and the push for value-based healthcare are compelling imaging centers to invest in robust quality assurance protocols, thus bolstering the adoption of sophisticated test phantoms. The market penetration of advanced tomography test phantoms is expected to rise from an estimated 40% in 2025 to over 60% by 2033, indicating a significant shift towards more comprehensive quality assurance practices.
Dominant Regions, Countries, or Segments in Tomography Test Phantom
The Adult segment within the Tomography Test Phantom market currently dominates, driven by the higher prevalence of diagnostic imaging procedures in adult populations and the widespread use of CT and MRI for a broad spectrum of adult diseases. In terms of application, Hospitals represent the leading segment, accounting for an estimated 70% of the global market share. This dominance is attributed to the high volume of imaging procedures performed in hospital settings, the presence of advanced imaging equipment, and the stringent regulatory requirements for quality assurance in inpatient care. North America is the leading region, propelled by its advanced healthcare infrastructure, substantial investments in medical research and development, and the presence of major medical device manufacturers. The United States, in particular, holds a significant market share due to its well-established reimbursement policies for diagnostic imaging and a strong emphasis on patient safety and diagnostic accuracy.
- Dominant Segment (Type): Adult (estimated 80% market share).
- Key Drivers: Higher incidence of imaging for adult diseases, widespread use of CT/MRI for adult diagnostics.
- Dominant Segment (Application): Hospitals (estimated 70% market share).
- Key Drivers: High volume of imaging procedures, advanced equipment availability, strict quality control mandates.
- Dominant Region: North America (estimated 40% market share).
- Key Drivers: Advanced healthcare infrastructure, significant R&D investment, favorable reimbursement policies, leading medical device manufacturers.
- Leading Country: United States (estimated 75% of North American market share).
- Dominance Factors: Robust healthcare system, emphasis on patient safety, widespread adoption of imaging technologies.
The Child segment within the tomography test phantom market, while currently smaller in market share, presents significant growth potential. The increasing sophistication of pediatric imaging techniques and the unique challenges associated with pediatric radiology are driving a growing demand for specialized pediatric phantoms. This segment is expected to witness a CAGR of approximately 8.5% during the forecast period, outpacing the overall market growth. This accelerated growth is fueled by advancements in neonatal imaging, the need for reduced radiation doses in pediatric CT scans, and the development of specific phantoms designed to accurately represent pediatric anatomical structures and tissue densities. The growing awareness among healthcare professionals regarding the importance of age-appropriate quality control in pediatric imaging is also a key contributor to this expansion.
Tomography Test Phantom Product Landscape
The Tomography Test Phantom product landscape is characterized by continuous innovation, with manufacturers focusing on developing phantoms that offer enhanced realism, multi-modality compatibility, and increased cost-effectiveness. Innovations include the use of advanced tissue-mimicking materials that accurately replicate the attenuation and scatter properties of human tissues across various imaging modalities (CT, MRI, PET). Products are increasingly designed for specific applications, ranging from routine quality assurance to complex research studies. For example, advanced adult phantoms now incorporate simulated lesions and anatomical variations, while specialized child phantoms are being developed with miniature anatomical structures for precise pediatric imaging calibration. Performance metrics emphasize spatial resolution, contrast-to-noise ratio, dose monitoring capabilities, and the ability to assess image artifact reduction. Unique selling propositions revolve around customizability, durability, and ease of use, alongside compliance with international imaging standards.
Key Drivers, Barriers & Challenges in Tomography Test Phantom
Key Drivers: The primary forces propelling the Tomography Test Phantom market include the increasing global demand for high-quality medical imaging, stringent regulatory mandates for diagnostic accuracy, and the continuous technological advancements in imaging modalities. Furthermore, the growing emphasis on patient safety and the need for precise treatment planning, especially in oncology and neurology, are significant accelerators. The expanding healthcare infrastructure in emerging economies also presents a substantial growth opportunity.
Key Barriers & Challenges: Despite the positive outlook, the market faces several challenges. High development costs for advanced phantoms can be a significant barrier to entry for smaller manufacturers. The need for ongoing calibration and maintenance of phantoms, along with the complexity of developing phantoms that accurately simulate a wide range of pathological conditions, present technical hurdles. Supply chain disruptions for specialized materials and the lengthy regulatory approval processes for novel phantom designs can also impede market growth. Competitive pressures from alternative quality assurance methods, though less comprehensive, also pose a restraint. The cost of acquisition for advanced tomography test phantoms can be a barrier for smaller imaging centers, limiting their immediate adoption.
Emerging Opportunities in Tomography Test Phantom
Emerging opportunities lie in the development of cost-effective, customizable, and AI-integrated tomography test phantoms. The increasing adoption of AI in medical imaging analysis creates a demand for phantoms that can be used to train and validate AI algorithms, ensuring their accuracy and reliability. The untapped potential in emerging economies with rapidly developing healthcare sectors offers significant growth prospects. Furthermore, the development of phantoms that simulate complex dynamic processes in the body, such as blood flow or organ motion, presents a novel application area. There is also an increasing demand for phantoms specifically designed for interventional radiology procedures and image-guided surgery, reflecting evolving clinical practices and the need for precision in these complex interventions.
Growth Accelerators in the Tomography Test Phantom Industry
Catalysts driving long-term growth in the Tomography Test Phantom industry include breakthrough innovations in materials science that enable the creation of more lifelike and functional phantoms. Strategic partnerships between phantom manufacturers and leading medical imaging equipment providers are crucial for co-development and integrated quality assurance solutions. Market expansion strategies targeting underserved regions with growing healthcare needs, coupled with the increasing adoption of personalized medicine requiring highly specific imaging parameters, will further accelerate growth. The ongoing push for evidence-based medicine and increased scrutiny on diagnostic accuracy across all medical disciplines will continue to fuel the demand for reliable phantom testing.
Key Players Shaping the Tomography Test Phantom Market
- 3Done Australia
- CIRS
- Fluke Biomedical
- Hongkong Medi
- Modus Medical Devices
- Pure Imaging Phantoms
- True Phantom Solutions
- Yezitronix
Notable Milestones in Tomography Test Phantom Sector
- 2019: Introduction of novel multi-material 3D printed phantoms for enhanced anatomical accuracy.
- 2020: Launch of AI-compatible phantoms designed for training diagnostic imaging algorithms.
- 2021: Significant increase in the development of pediatric-specific tomography test phantoms to address dose reduction needs.
- 2022: Advancements in hyper-realistic tissue-mimicking materials for CT and MRI phantoms.
- 2023: Increased focus on developing phantoms for emerging imaging modalities like photon-counting CT.
- 2024: Enhanced integration of dose monitoring and artifact assessment capabilities in advanced phantoms.
In-Depth Tomography Test Phantom Market Outlook
The future outlook for the Tomography Test Phantom market is exceptionally bright, fueled by an ongoing commitment to enhancing diagnostic imaging accuracy and patient safety. Growth accelerators, including rapid technological advancements in imaging, the increasing complexity of medical conditions requiring sophisticated imaging solutions, and a global surge in healthcare expenditure, collectively paint a picture of sustained expansion. Strategic opportunities lie in catering to the growing demand for pediatric and specialized phantoms, capitalizing on the AI revolution in healthcare, and penetrating emerging markets. The market is expected to witness increased collaboration between manufacturers and healthcare institutions, leading to the development of more tailored and effective quality assurance tools.
Tomography Test Phantom Segmentation
-
1. Application
- 1.1. Hospital
- 1.2. Laboratory
- 1.3. Other
-
2. Types
- 2.1. Aldult
- 2.2. Child
Tomography Test Phantom Segmentation By Geography
-
1. North America
- 1.1. United States
- 1.2. Canada
- 1.3. Mexico
-
2. South America
- 2.1. Brazil
- 2.2. Argentina
- 2.3. Rest of South America
-
3. Europe
- 3.1. United Kingdom
- 3.2. Germany
- 3.3. France
- 3.4. Italy
- 3.5. Spain
- 3.6. Russia
- 3.7. Benelux
- 3.8. Nordics
- 3.9. Rest of Europe
-
4. Middle East & Africa
- 4.1. Turkey
- 4.2. Israel
- 4.3. GCC
- 4.4. North Africa
- 4.5. South Africa
- 4.6. Rest of Middle East & Africa
-
5. Asia Pacific
- 5.1. China
- 5.2. India
- 5.3. Japan
- 5.4. South Korea
- 5.5. ASEAN
- 5.6. Oceania
- 5.7. Rest of Asia Pacific
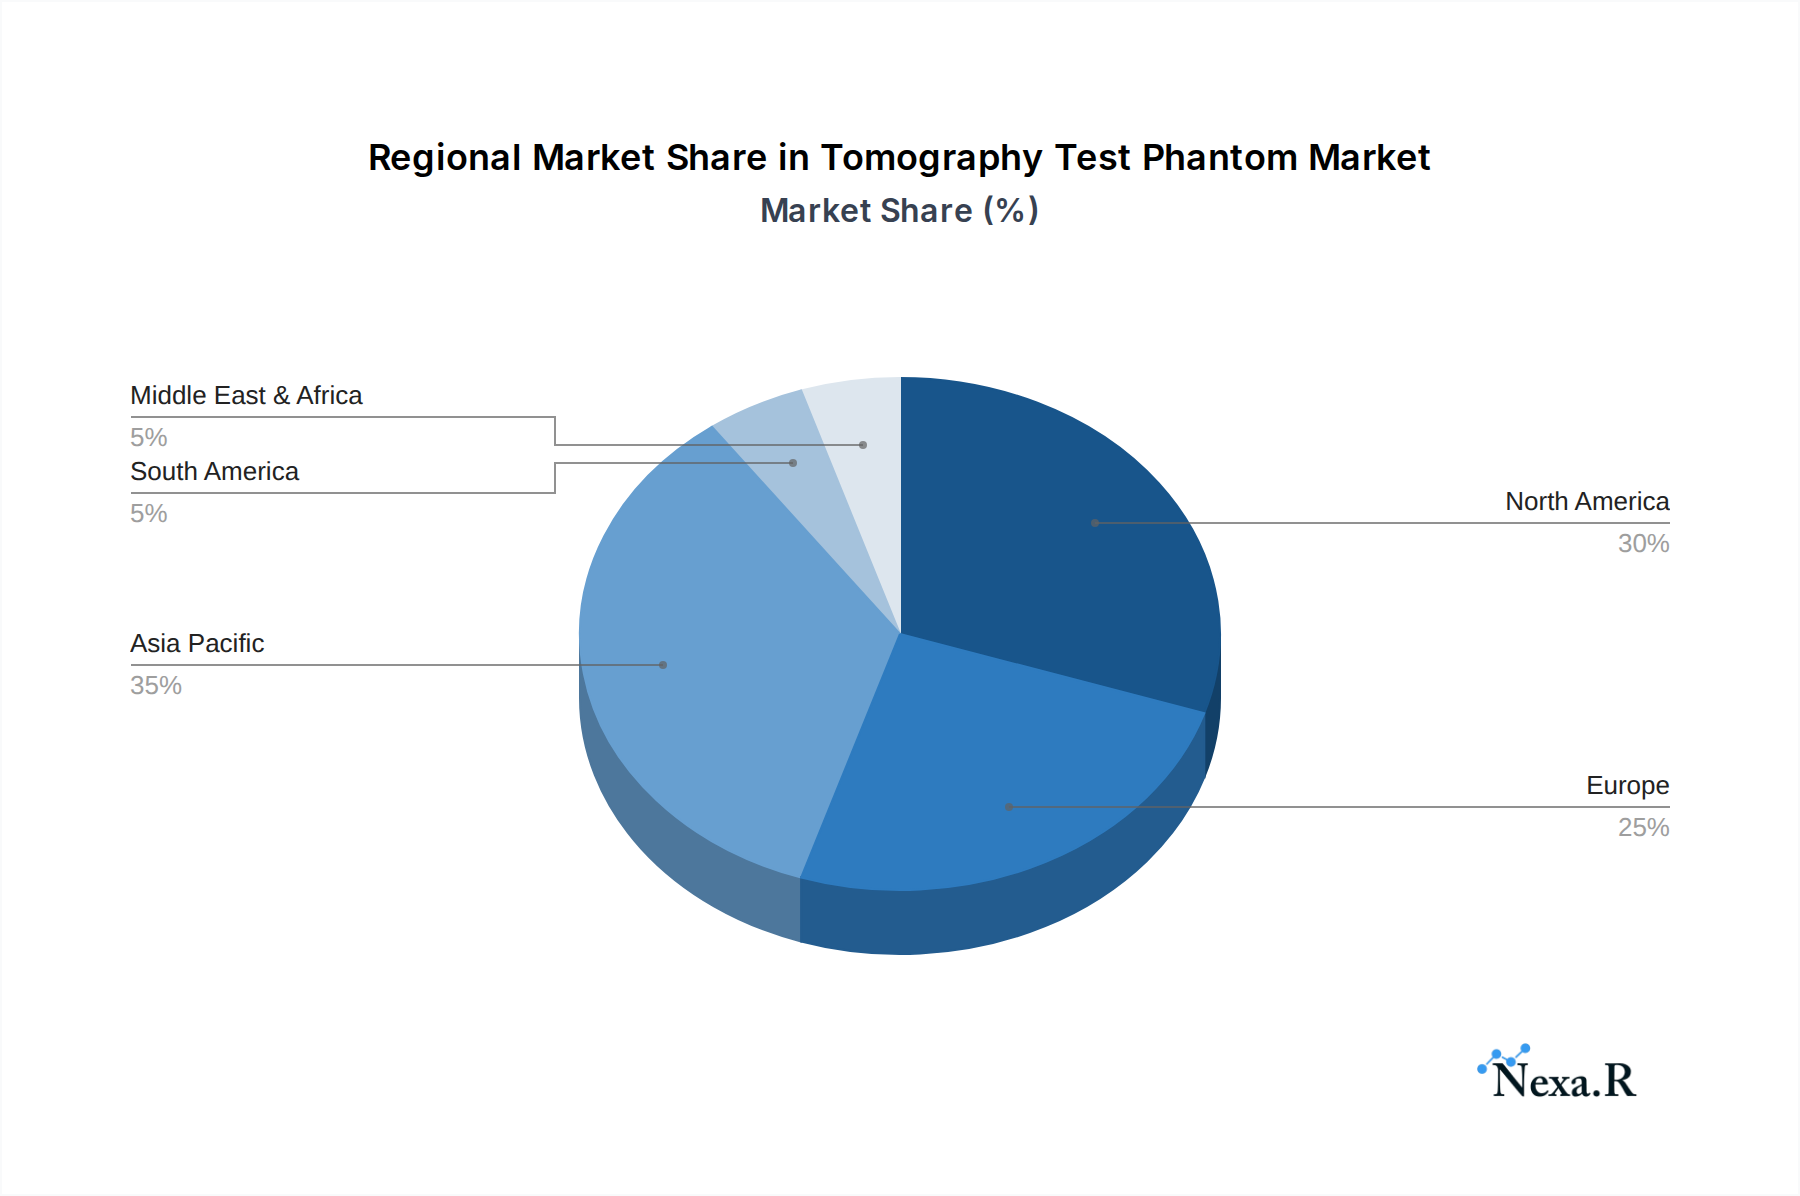
Tomography Test Phantom Regional Market Share
Geographic Coverage of Tomography Test Phantom
Tomography Test Phantom REPORT HIGHLIGHTS
| Aspects | Details |
|---|---|
| Study Period | 2020-2034 |
| Base Year | 2025 |
| Estimated Year | 2026 |
| Forecast Period | 2026-2034 |
| Historical Period | 2020-2025 |
| Growth Rate | CAGR of 6.5% from 2020-2034 |
| Segmentation |
|
Table of Contents
- 1. Introduction
- 1.1. Research Scope
- 1.2. Market Segmentation
- 1.3. Research Objective
- 1.4. Definitions and Assumptions
- 2. Executive Summary
- 2.1. Market Snapshot
- 3. Market Dynamics
- 3.1. Market Drivers
- 3.2. Market Restrains
- 3.3. Market Trends
- 3.4. Market Opportunities
- 4. Market Factor Analysis
- 4.1. Porters Five Forces
- 4.1.1. Bargaining Power of Suppliers
- 4.1.2. Bargaining Power of Buyers
- 4.1.3. Threat of New Entrants
- 4.1.4. Threat of Substitutes
- 4.1.5. Competitive Rivalry
- 4.2. PESTEL analysis
- 4.3. BCG Analysis
- 4.3.1. Stars (High Growth, High Market Share)
- 4.3.2. Cash Cows (Low Growth, High Market Share)
- 4.3.3. Question Mark (High Growth, Low Market Share)
- 4.3.4. Dogs (Low Growth, Low Market Share)
- 4.4. Ansoff Matrix Analysis
- 4.5. Supply Chain Analysis
- 4.6. Regulatory Landscape
- 4.7. Current Market Potential and Opportunity Assessment (TAM–SAM–SOM Framework)
- 4.8. NRP Analyst Note
- 4.1. Porters Five Forces
- 5. Market Analysis, Insights and Forecast 2021-2033
- 5.1. Market Analysis, Insights and Forecast - by Application
- 5.1.1. Hospital
- 5.1.2. Laboratory
- 5.1.3. Other
- 5.2. Market Analysis, Insights and Forecast - by Types
- 5.2.1. Aldult
- 5.2.2. Child
- 5.3. Market Analysis, Insights and Forecast - by Region
- 5.3.1. North America
- 5.3.2. South America
- 5.3.3. Europe
- 5.3.4. Middle East & Africa
- 5.3.5. Asia Pacific
- 5.1. Market Analysis, Insights and Forecast - by Application
- 6. Global Tomography Test Phantom Analysis, Insights and Forecast, 2021-2033
- 6.1. Market Analysis, Insights and Forecast - by Application
- 6.1.1. Hospital
- 6.1.2. Laboratory
- 6.1.3. Other
- 6.2. Market Analysis, Insights and Forecast - by Types
- 6.2.1. Aldult
- 6.2.2. Child
- 6.1. Market Analysis, Insights and Forecast - by Application
- 7. North America Tomography Test Phantom Analysis, Insights and Forecast, 2020-2032
- 7.1. Market Analysis, Insights and Forecast - by Application
- 7.1.1. Hospital
- 7.1.2. Laboratory
- 7.1.3. Other
- 7.2. Market Analysis, Insights and Forecast - by Types
- 7.2.1. Aldult
- 7.2.2. Child
- 7.1. Market Analysis, Insights and Forecast - by Application
- 8. South America Tomography Test Phantom Analysis, Insights and Forecast, 2020-2032
- 8.1. Market Analysis, Insights and Forecast - by Application
- 8.1.1. Hospital
- 8.1.2. Laboratory
- 8.1.3. Other
- 8.2. Market Analysis, Insights and Forecast - by Types
- 8.2.1. Aldult
- 8.2.2. Child
- 8.1. Market Analysis, Insights and Forecast - by Application
- 9. Europe Tomography Test Phantom Analysis, Insights and Forecast, 2020-2032
- 9.1. Market Analysis, Insights and Forecast - by Application
- 9.1.1. Hospital
- 9.1.2. Laboratory
- 9.1.3. Other
- 9.2. Market Analysis, Insights and Forecast - by Types
- 9.2.1. Aldult
- 9.2.2. Child
- 9.1. Market Analysis, Insights and Forecast - by Application
- 10. Middle East & Africa Tomography Test Phantom Analysis, Insights and Forecast, 2020-2032
- 10.1. Market Analysis, Insights and Forecast - by Application
- 10.1.1. Hospital
- 10.1.2. Laboratory
- 10.1.3. Other
- 10.2. Market Analysis, Insights and Forecast - by Types
- 10.2.1. Aldult
- 10.2.2. Child
- 10.1. Market Analysis, Insights and Forecast - by Application
- 11. Asia Pacific Tomography Test Phantom Analysis, Insights and Forecast, 2020-2032
- 11.1. Market Analysis, Insights and Forecast - by Application
- 11.1.1. Hospital
- 11.1.2. Laboratory
- 11.1.3. Other
- 11.2. Market Analysis, Insights and Forecast - by Types
- 11.2.1. Aldult
- 11.2.2. Child
- 11.1. Market Analysis, Insights and Forecast - by Application
- 12. Competitive Analysis
- 12.1. Company Profiles
- 12.1.1 3Done Australia
- 12.1.1.1. Company Overview
- 12.1.1.2. Products
- 12.1.1.3. Company Financials
- 12.1.1.4. SWOT Analysis
- 12.1.2 CIRS
- 12.1.2.1. Company Overview
- 12.1.2.2. Products
- 12.1.2.3. Company Financials
- 12.1.2.4. SWOT Analysis
- 12.1.3 Fluke Biomedical
- 12.1.3.1. Company Overview
- 12.1.3.2. Products
- 12.1.3.3. Company Financials
- 12.1.3.4. SWOT Analysis
- 12.1.4 Hongkong Medi
- 12.1.4.1. Company Overview
- 12.1.4.2. Products
- 12.1.4.3. Company Financials
- 12.1.4.4. SWOT Analysis
- 12.1.5 Modus Medical Devices
- 12.1.5.1. Company Overview
- 12.1.5.2. Products
- 12.1.5.3. Company Financials
- 12.1.5.4. SWOT Analysis
- 12.1.6 Pure Imaging Phantoms
- 12.1.6.1. Company Overview
- 12.1.6.2. Products
- 12.1.6.3. Company Financials
- 12.1.6.4. SWOT Analysis
- 12.1.7 True Phantom Solutions
- 12.1.7.1. Company Overview
- 12.1.7.2. Products
- 12.1.7.3. Company Financials
- 12.1.7.4. SWOT Analysis
- 12.1.8 Yezitronix
- 12.1.8.1. Company Overview
- 12.1.8.2. Products
- 12.1.8.3. Company Financials
- 12.1.8.4. SWOT Analysis
- 12.1.1 3Done Australia
- 12.2. Market Entropy
- 12.2.1 Company's Key Areas Served
- 12.2.2 Recent Developments
- 12.3. Company Market Share Analysis 2025
- 12.3.1 Top 5 Companies Market Share Analysis
- 12.3.2 Top 3 Companies Market Share Analysis
- 12.4. List of Potential Customers
- 13. Research Methodology
List of Figures
- Figure 1: Global Tomography Test Phantom Revenue Breakdown (undefined, %) by Region 2025 & 2033
- Figure 2: North America Tomography Test Phantom Revenue (undefined), by Application 2025 & 2033
- Figure 3: North America Tomography Test Phantom Revenue Share (%), by Application 2025 & 2033
- Figure 4: North America Tomography Test Phantom Revenue (undefined), by Types 2025 & 2033
- Figure 5: North America Tomography Test Phantom Revenue Share (%), by Types 2025 & 2033
- Figure 6: North America Tomography Test Phantom Revenue (undefined), by Country 2025 & 2033
- Figure 7: North America Tomography Test Phantom Revenue Share (%), by Country 2025 & 2033
- Figure 8: South America Tomography Test Phantom Revenue (undefined), by Application 2025 & 2033
- Figure 9: South America Tomography Test Phantom Revenue Share (%), by Application 2025 & 2033
- Figure 10: South America Tomography Test Phantom Revenue (undefined), by Types 2025 & 2033
- Figure 11: South America Tomography Test Phantom Revenue Share (%), by Types 2025 & 2033
- Figure 12: South America Tomography Test Phantom Revenue (undefined), by Country 2025 & 2033
- Figure 13: South America Tomography Test Phantom Revenue Share (%), by Country 2025 & 2033
- Figure 14: Europe Tomography Test Phantom Revenue (undefined), by Application 2025 & 2033
- Figure 15: Europe Tomography Test Phantom Revenue Share (%), by Application 2025 & 2033
- Figure 16: Europe Tomography Test Phantom Revenue (undefined), by Types 2025 & 2033
- Figure 17: Europe Tomography Test Phantom Revenue Share (%), by Types 2025 & 2033
- Figure 18: Europe Tomography Test Phantom Revenue (undefined), by Country 2025 & 2033
- Figure 19: Europe Tomography Test Phantom Revenue Share (%), by Country 2025 & 2033
- Figure 20: Middle East & Africa Tomography Test Phantom Revenue (undefined), by Application 2025 & 2033
- Figure 21: Middle East & Africa Tomography Test Phantom Revenue Share (%), by Application 2025 & 2033
- Figure 22: Middle East & Africa Tomography Test Phantom Revenue (undefined), by Types 2025 & 2033
- Figure 23: Middle East & Africa Tomography Test Phantom Revenue Share (%), by Types 2025 & 2033
- Figure 24: Middle East & Africa Tomography Test Phantom Revenue (undefined), by Country 2025 & 2033
- Figure 25: Middle East & Africa Tomography Test Phantom Revenue Share (%), by Country 2025 & 2033
- Figure 26: Asia Pacific Tomography Test Phantom Revenue (undefined), by Application 2025 & 2033
- Figure 27: Asia Pacific Tomography Test Phantom Revenue Share (%), by Application 2025 & 2033
- Figure 28: Asia Pacific Tomography Test Phantom Revenue (undefined), by Types 2025 & 2033
- Figure 29: Asia Pacific Tomography Test Phantom Revenue Share (%), by Types 2025 & 2033
- Figure 30: Asia Pacific Tomography Test Phantom Revenue (undefined), by Country 2025 & 2033
- Figure 31: Asia Pacific Tomography Test Phantom Revenue Share (%), by Country 2025 & 2033
List of Tables
- Table 1: Global Tomography Test Phantom Revenue undefined Forecast, by Application 2020 & 2033
- Table 2: Global Tomography Test Phantom Revenue undefined Forecast, by Types 2020 & 2033
- Table 3: Global Tomography Test Phantom Revenue undefined Forecast, by Region 2020 & 2033
- Table 4: Global Tomography Test Phantom Revenue undefined Forecast, by Application 2020 & 2033
- Table 5: Global Tomography Test Phantom Revenue undefined Forecast, by Types 2020 & 2033
- Table 6: Global Tomography Test Phantom Revenue undefined Forecast, by Country 2020 & 2033
- Table 7: United States Tomography Test Phantom Revenue (undefined) Forecast, by Application 2020 & 2033
- Table 8: Canada Tomography Test Phantom Revenue (undefined) Forecast, by Application 2020 & 2033
- Table 9: Mexico Tomography Test Phantom Revenue (undefined) Forecast, by Application 2020 & 2033
- Table 10: Global Tomography Test Phantom Revenue undefined Forecast, by Application 2020 & 2033
- Table 11: Global Tomography Test Phantom Revenue undefined Forecast, by Types 2020 & 2033
- Table 12: Global Tomography Test Phantom Revenue undefined Forecast, by Country 2020 & 2033
- Table 13: Brazil Tomography Test Phantom Revenue (undefined) Forecast, by Application 2020 & 2033
- Table 14: Argentina Tomography Test Phantom Revenue (undefined) Forecast, by Application 2020 & 2033
- Table 15: Rest of South America Tomography Test Phantom Revenue (undefined) Forecast, by Application 2020 & 2033
- Table 16: Global Tomography Test Phantom Revenue undefined Forecast, by Application 2020 & 2033
- Table 17: Global Tomography Test Phantom Revenue undefined Forecast, by Types 2020 & 2033
- Table 18: Global Tomography Test Phantom Revenue undefined Forecast, by Country 2020 & 2033
- Table 19: United Kingdom Tomography Test Phantom Revenue (undefined) Forecast, by Application 2020 & 2033
- Table 20: Germany Tomography Test Phantom Revenue (undefined) Forecast, by Application 2020 & 2033
- Table 21: France Tomography Test Phantom Revenue (undefined) Forecast, by Application 2020 & 2033
- Table 22: Italy Tomography Test Phantom Revenue (undefined) Forecast, by Application 2020 & 2033
- Table 23: Spain Tomography Test Phantom Revenue (undefined) Forecast, by Application 2020 & 2033
- Table 24: Russia Tomography Test Phantom Revenue (undefined) Forecast, by Application 2020 & 2033
- Table 25: Benelux Tomography Test Phantom Revenue (undefined) Forecast, by Application 2020 & 2033
- Table 26: Nordics Tomography Test Phantom Revenue (undefined) Forecast, by Application 2020 & 2033
- Table 27: Rest of Europe Tomography Test Phantom Revenue (undefined) Forecast, by Application 2020 & 2033
- Table 28: Global Tomography Test Phantom Revenue undefined Forecast, by Application 2020 & 2033
- Table 29: Global Tomography Test Phantom Revenue undefined Forecast, by Types 2020 & 2033
- Table 30: Global Tomography Test Phantom Revenue undefined Forecast, by Country 2020 & 2033
- Table 31: Turkey Tomography Test Phantom Revenue (undefined) Forecast, by Application 2020 & 2033
- Table 32: Israel Tomography Test Phantom Revenue (undefined) Forecast, by Application 2020 & 2033
- Table 33: GCC Tomography Test Phantom Revenue (undefined) Forecast, by Application 2020 & 2033
- Table 34: North Africa Tomography Test Phantom Revenue (undefined) Forecast, by Application 2020 & 2033
- Table 35: South Africa Tomography Test Phantom Revenue (undefined) Forecast, by Application 2020 & 2033
- Table 36: Rest of Middle East & Africa Tomography Test Phantom Revenue (undefined) Forecast, by Application 2020 & 2033
- Table 37: Global Tomography Test Phantom Revenue undefined Forecast, by Application 2020 & 2033
- Table 38: Global Tomography Test Phantom Revenue undefined Forecast, by Types 2020 & 2033
- Table 39: Global Tomography Test Phantom Revenue undefined Forecast, by Country 2020 & 2033
- Table 40: China Tomography Test Phantom Revenue (undefined) Forecast, by Application 2020 & 2033
- Table 41: India Tomography Test Phantom Revenue (undefined) Forecast, by Application 2020 & 2033
- Table 42: Japan Tomography Test Phantom Revenue (undefined) Forecast, by Application 2020 & 2033
- Table 43: South Korea Tomography Test Phantom Revenue (undefined) Forecast, by Application 2020 & 2033
- Table 44: ASEAN Tomography Test Phantom Revenue (undefined) Forecast, by Application 2020 & 2033
- Table 45: Oceania Tomography Test Phantom Revenue (undefined) Forecast, by Application 2020 & 2033
- Table 46: Rest of Asia Pacific Tomography Test Phantom Revenue (undefined) Forecast, by Application 2020 & 2033
Frequently Asked Questions
1. What is the projected Compound Annual Growth Rate (CAGR) of the Tomography Test Phantom?
The projected CAGR is approximately 6.5%.
2. Which companies are prominent players in the Tomography Test Phantom?
Key companies in the market include 3Done Australia, CIRS, Fluke Biomedical, Hongkong Medi, Modus Medical Devices, Pure Imaging Phantoms, True Phantom Solutions, Yezitronix.
3. What are the main segments of the Tomography Test Phantom?
The market segments include Application, Types.
4. Can you provide details about the market size?
The market size is estimated to be USD XXX N/A as of 2022.
5. What are some drivers contributing to market growth?
N/A
6. What are the notable trends driving market growth?
N/A
7. Are there any restraints impacting market growth?
N/A
8. Can you provide examples of recent developments in the market?
N/A
9. What pricing options are available for accessing the report?
Pricing options include single-user, multi-user, and enterprise licenses priced at USD 2900.00, USD 4350.00, and USD 5800.00 respectively.
10. Is the market size provided in terms of value or volume?
The market size is provided in terms of value, measured in N/A.
11. Are there any specific market keywords associated with the report?
Yes, the market keyword associated with the report is "Tomography Test Phantom," which aids in identifying and referencing the specific market segment covered.
12. How do I determine which pricing option suits my needs best?
The pricing options vary based on user requirements and access needs. Individual users may opt for single-user licenses, while businesses requiring broader access may choose multi-user or enterprise licenses for cost-effective access to the report.
13. Are there any additional resources or data provided in the Tomography Test Phantom report?
While the report offers comprehensive insights, it's advisable to review the specific contents or supplementary materials provided to ascertain if additional resources or data are available.
14. How can I stay updated on further developments or reports in the Tomography Test Phantom?
To stay informed about further developments, trends, and reports in the Tomography Test Phantom, consider subscribing to industry newsletters, following relevant companies and organizations, or regularly checking reputable industry news sources and publications.
Methodology
Step 1 - Identification of Relevant Samples Size from Population Database


Step 2 - Approaches for Defining Global Market Size (Value, Volume* & Price*)

Note*: In applicable scenarios
Step 3 - Data Sources
Primary Research
- Web Analytics
- Survey Reports
- Research Institute
- Latest Research Reports
- Opinion Leaders
Secondary Research
- Annual Reports
- White Paper
- Latest Press Release
- Industry Association
- Paid Database
- Investor Presentations

Step 4 - Data Triangulation
Involves using different sources of information in order to increase the validity of a study
These sources are likely to be stakeholders in a program - participants, other researchers, program staff, other community members, and so on.
Then we put all data in single framework & apply various statistical tools to find out the dynamic on the market.
During the analysis stage, feedback from the stakeholder groups would be compared to determine areas of agreement as well as areas of divergence