

Key Insights
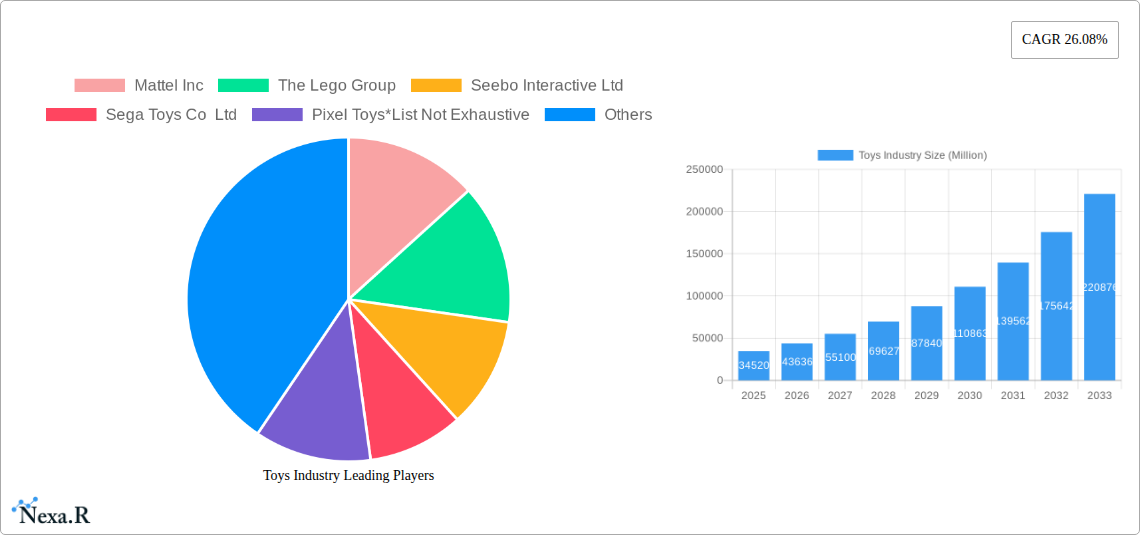
The global connected toys market, valued at $34.52 billion in 2025, is experiencing robust growth, projected to expand at a Compound Annual Growth Rate (CAGR) of 26.08% from 2025 to 2033. This surge is driven by several key factors. Increasing smartphone and tablet penetration, particularly among children, fuels demand for interactive and digitally-enhanced toys. Parents are increasingly drawn to educational and developmentally beneficial toys, and connected toys offer engaging learning experiences beyond traditional play. Technological advancements, encompassing sophisticated features like AI integration and augmented reality (AR), are continuously enhancing the appeal and functionality of these toys. Furthermore, the growing trend of gamification in education and entertainment contributes significantly to market expansion. The market segmentation reveals strong growth across different technologies, with Wi-Fi and Bluetooth leading the way, followed by emerging technologies such as NFC and RFID. Online retail channels are a significant driver, leveraging the convenience and wider reach of e-commerce. Smartphone-connected toys currently dominate the interfacing device segment, reflecting the widespread smartphone usage among children. Key players like Mattel, Lego, and Sega Toys are heavily invested in R&D and innovative product launches to capitalize on this market growth.
However, certain restraints exist. Concerns regarding data privacy and security related to children's data collected by connected toys present a significant challenge. The relatively high cost of connected toys compared to traditional toys can limit accessibility for some consumers. Furthermore, potential technological glitches and software updates can lead to user frustration and impact user experience. Despite these challenges, the overall market outlook remains strongly positive, fueled by continuous technological innovation, growing parental interest in educational toys, and the increasing digital engagement of children worldwide. Geographical expansion, particularly in rapidly developing economies of Asia-Pacific and South America, will further fuel this robust growth. Strategic partnerships between toy manufacturers and technology companies are expected to foster innovation and accelerate market penetration.
Toys Industry Market Report: 2019-2033
This comprehensive report provides an in-depth analysis of the global toys industry, encompassing market dynamics, growth trends, regional performance, and key players. With a focus on technological advancements, distribution channels, and evolving consumer preferences, this report is essential for industry professionals seeking to navigate the complexities of this dynamic sector. The report covers the period 2019-2033, with a base year of 2025. Market values are presented in Million units.
Toys Industry Market Dynamics & Structure
This section analyzes the competitive landscape, technological innovation, regulatory influences, and market trends within the toys industry. The market is characterized by a moderate level of concentration, with key players holding significant market share. However, the presence of numerous smaller players and the continuous entry of new businesses contribute to a dynamic environment. Technological innovation, driven by the integration of smart technologies and augmented reality, is a crucial growth driver. Regulatory frameworks concerning product safety and data privacy play a significant role in shaping market practices. The industry also faces competition from substitute products, such as video games and digital entertainment. End-user demographics significantly influence demand patterns, with children of different age groups and their parents representing the core target market.
- Market Concentration: The top 5 players account for approximately xx% of the global market in 2025.
- Technological Innovation: Integration of AI, AR/VR, and IoT technologies is transforming the toy landscape.
- Regulatory Landscape: Safety standards and data privacy regulations impact product development and marketing.
- M&A Activity: An estimated xx M&A deals occurred between 2019 and 2024, indicating a moderately active consolidation phase.
- Innovation Barriers: High R&D costs and the need for specialized technical expertise pose barriers to entry for new players.
Toys Industry Growth Trends & Insights
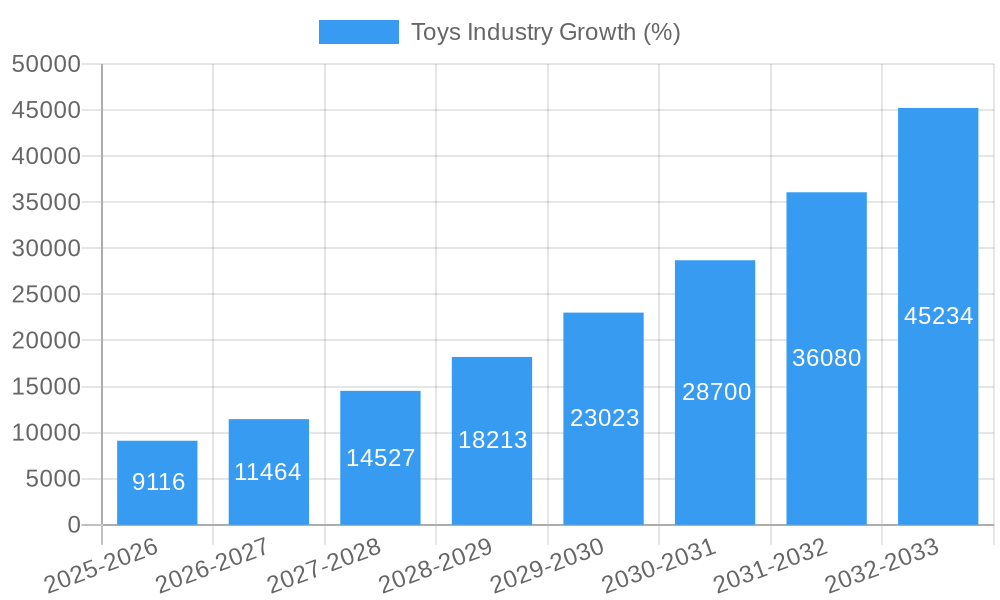
The global toys market is projected to experience robust growth during the forecast period (2025-2033). Driven by factors such as rising disposable incomes, increasing urbanization, and the growing popularity of educational and interactive toys, the market is poised for continued expansion. The adoption rate of technologically advanced toys, particularly those incorporating smart functionalities, is steadily increasing. Consumer behavior is shifting toward more experiential and educational toys. This trend is further amplified by the increasing preference for sustainable and ethically sourced products. The CAGR for the industry during the historical period (2019-2024) was xx%, and it is projected to be xx% during the forecast period (2025-2033). Market penetration of smart toys is projected to reach xx% by 2033.
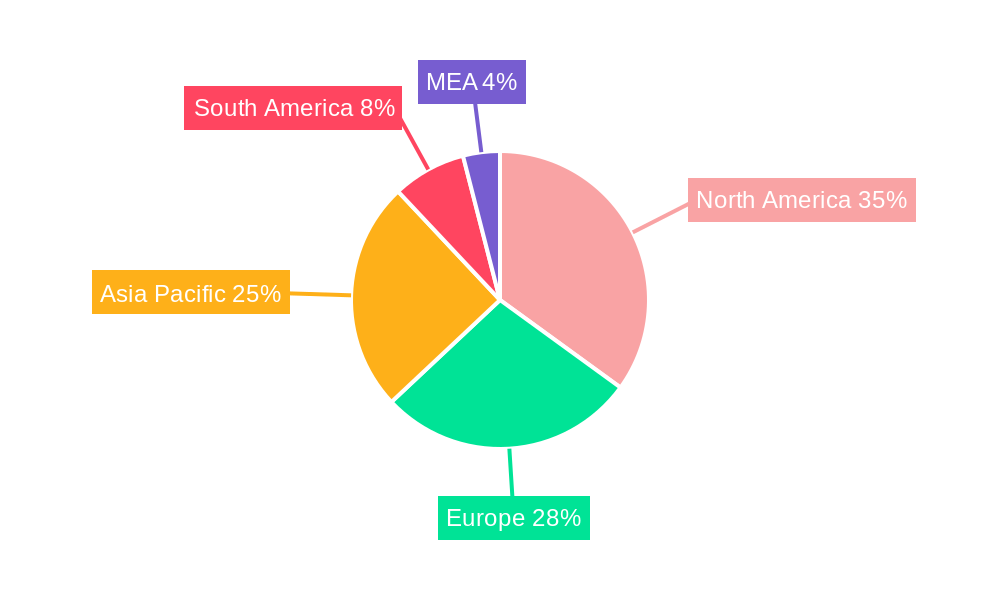
Dominant Regions, Countries, or Segments in Toys Industry
North America and Europe currently dominate the global toys market, accounting for xx% of the global revenue in 2025. However, Asia-Pacific is projected to exhibit the fastest growth rate over the forecast period due to increasing disposable incomes and a rapidly expanding middle class.
By Technology:
- Wi-Fi Connected Toys: This segment is experiencing significant growth due to the increasing penetration of high-speed internet.
- Bluetooth Connected Toys: Offers a more cost-effective connectivity solution, making it a popular choice.
- Other Technologies (NFC and RFID): These technologies are finding niche applications in interactive toys and collectibles.
By Distribution Channel:
- Online Stores: This channel is rapidly growing due to its convenience and accessibility.
- Specialty Stores and Convenience Stores: These channels still represent a significant portion of the market.
By Interfacing Devices:
- Smartphone Connected Toys: Dominates the market due to high smartphone penetration.
- Tablet-Connected Toys: A growing segment fueled by the increasing use of tablets for entertainment.
- Other Interfacing Devices (Console-connected): This segment benefits from the popularity of gaming consoles.
Toys Industry Product Landscape
The toys industry offers a vast array of products, ranging from traditional toys to sophisticated, technology-integrated items. Innovation is driven by factors such as incorporating augmented reality (AR) and virtual reality (VR) features, integrating educational elements, and focusing on sustainability. Unique selling propositions often focus on interactivity, educational value, and engagement with children's creativity. Key performance indicators include sales figures, customer satisfaction ratings, and brand reputation.
Key Drivers, Barriers & Challenges in Toys Industry
Key Drivers:
- Technological advancements: AR/VR integration, AI-powered features, and IoT connectivity are driving innovation.
- Increasing disposable income: Particularly in developing economies, fuels demand for premium toys.
- Evolving consumer preferences: Demand for educational, interactive, and sustainable toys.
Key Challenges:
- Supply chain disruptions: Global events can significantly impact the availability of raw materials and manufacturing capacity. The impact is estimated to have reduced market growth by xx% in 2022.
- Regulatory hurdles: Strict safety and quality standards increase production costs.
- Intense competition: Established players and new entrants compete fiercely for market share.
Emerging Opportunities in Toys Industry
- Untapped markets: Developing countries present significant growth potential.
- Personalized learning toys: Toys that adapt to individual learning styles.
- Sustainable and eco-friendly materials: Growing demand for toys made from recycled or sustainably sourced materials.
Growth Accelerators in the Toys Industry
Technological innovation continues to drive growth, with advancements in AI, AR/VR and smart toys leading to more engaging and interactive experiences. Strategic partnerships between toy companies and technology firms facilitate the integration of cutting-edge features. Expansion into new geographical markets with high growth potential further propels market expansion.
Key Players Shaping the Toys Industry Market
- Mattel Inc
- The Lego Group
- Seebo Interactive Ltd
- Sega Toys Co Ltd
- Pixel Toys
- Playmobil (Brandstätter Group)
- Primo Toys
- Pillar Learning
- TOSY Robotics JSC
- Leapfrog Enterprises Inc
Notable Milestones in Toys Industry Sector
- November 2022: LeapFrog launched My Pal Scout and Violet Smarty Paws, interactive plush toys.
- February 2023: Mattel launched Hot Wheels: Rift Rally, a mixed-reality racing game.
In-Depth Toys Industry Market Outlook
The toys industry is poised for sustained growth, driven by technological advancements, evolving consumer preferences, and expansion into new markets. Strategic partnerships, focus on sustainability, and the integration of educational elements in toys will be key factors in shaping the future market landscape. The market presents significant opportunities for innovative players to capitalize on growing demand for engaging and educational toys.
Toys Industry Segmentation
-
1. Interfacing Devices
- 1.1. Smartphone Connected
- 1.2. Tablet-Connected
- 1.3. Other Interfacing Devices (Console-connected)
-
2. Technology
- 2.1. Wi-Fi
- 2.2. Bluetooth
- 2.3. Other Technologies (NFC and RFID)
-
3. Distribution Channel
- 3.1. Online Stores
- 3.2. Specialty Stores and Convenience Stores
Toys Industry Segmentation By Geography
- 1. North America
- 2. Europe
- 3. Asia Pacific
- 4. Rest of the World
Toys Industry REPORT HIGHLIGHTS
| Aspects | Details |
|---|---|
| Study Period | 2019-2033 |
| Base Year | 2024 |
| Estimated Year | 2025 |
| Forecast Period | 2025-2033 |
| Historical Period | 2019-2024 |
| Growth Rate | CAGR of 26.08% from 2019-2033 |
| Segmentation |
|
Table of Contents
- 1. Introduction
- 1.1. Research Scope
- 1.2. Market Segmentation
- 1.3. Research Methodology
- 1.4. Definitions and Assumptions
- 2. Executive Summary
- 2.1. Introduction
- 3. Market Dynamics
- 3.1. Introduction
- 3.2. Market Drivers
- 3.2.1 Increasing Awareness of Technology-Led Education; Increasing Adoption of Technologies like AI
- 3.2.2 IoT
- 3.2.3 Smart Homes
- 3.2.4 Cloud
- 3.2.5 and Connected Mobile Devices; Parents are Increasingly Willing to Invest Smart Toy Increase Usage To Drive the Market Growth
- 3.3. Market Restrains
- 3.3.1. Fragmented Market with Several Local Vendors
- 3.4. Market Trends
- 3.4.1. Increasing Awareness of Technology-Led Education to Witness the Growth
- 4. Market Factor Analysis
- 4.1. Porters Five Forces
- 4.2. Supply/Value Chain
- 4.3. PESTEL analysis
- 4.4. Market Entropy
- 4.5. Patent/Trademark Analysis
- 5. Global Toys Industry Analysis, Insights and Forecast, 2019-2031
- 5.1. Market Analysis, Insights and Forecast - by Interfacing Devices
- 5.1.1. Smartphone Connected
- 5.1.2. Tablet-Connected
- 5.1.3. Other Interfacing Devices (Console-connected)
- 5.2. Market Analysis, Insights and Forecast - by Technology
- 5.2.1. Wi-Fi
- 5.2.2. Bluetooth
- 5.2.3. Other Technologies (NFC and RFID)
- 5.3. Market Analysis, Insights and Forecast - by Distribution Channel
- 5.3.1. Online Stores
- 5.3.2. Specialty Stores and Convenience Stores
- 5.4. Market Analysis, Insights and Forecast - by Region
- 5.4.1. North America
- 5.4.2. Europe
- 5.4.3. Asia Pacific
- 5.4.4. Rest of the World
- 5.1. Market Analysis, Insights and Forecast - by Interfacing Devices
- 6. North America Toys Industry Analysis, Insights and Forecast, 2019-2031
- 6.1. Market Analysis, Insights and Forecast - by Interfacing Devices
- 6.1.1. Smartphone Connected
- 6.1.2. Tablet-Connected
- 6.1.3. Other Interfacing Devices (Console-connected)
- 6.2. Market Analysis, Insights and Forecast - by Technology
- 6.2.1. Wi-Fi
- 6.2.2. Bluetooth
- 6.2.3. Other Technologies (NFC and RFID)
- 6.3. Market Analysis, Insights and Forecast - by Distribution Channel
- 6.3.1. Online Stores
- 6.3.2. Specialty Stores and Convenience Stores
- 6.1. Market Analysis, Insights and Forecast - by Interfacing Devices
- 7. Europe Toys Industry Analysis, Insights and Forecast, 2019-2031
- 7.1. Market Analysis, Insights and Forecast - by Interfacing Devices
- 7.1.1. Smartphone Connected
- 7.1.2. Tablet-Connected
- 7.1.3. Other Interfacing Devices (Console-connected)
- 7.2. Market Analysis, Insights and Forecast - by Technology
- 7.2.1. Wi-Fi
- 7.2.2. Bluetooth
- 7.2.3. Other Technologies (NFC and RFID)
- 7.3. Market Analysis, Insights and Forecast - by Distribution Channel
- 7.3.1. Online Stores
- 7.3.2. Specialty Stores and Convenience Stores
- 7.1. Market Analysis, Insights and Forecast - by Interfacing Devices
- 8. Asia Pacific Toys Industry Analysis, Insights and Forecast, 2019-2031
- 8.1. Market Analysis, Insights and Forecast - by Interfacing Devices
- 8.1.1. Smartphone Connected
- 8.1.2. Tablet-Connected
- 8.1.3. Other Interfacing Devices (Console-connected)
- 8.2. Market Analysis, Insights and Forecast - by Technology
- 8.2.1. Wi-Fi
- 8.2.2. Bluetooth
- 8.2.3. Other Technologies (NFC and RFID)
- 8.3. Market Analysis, Insights and Forecast - by Distribution Channel
- 8.3.1. Online Stores
- 8.3.2. Specialty Stores and Convenience Stores
- 8.1. Market Analysis, Insights and Forecast - by Interfacing Devices
- 9. Rest of the World Toys Industry Analysis, Insights and Forecast, 2019-2031
- 9.1. Market Analysis, Insights and Forecast - by Interfacing Devices
- 9.1.1. Smartphone Connected
- 9.1.2. Tablet-Connected
- 9.1.3. Other Interfacing Devices (Console-connected)
- 9.2. Market Analysis, Insights and Forecast - by Technology
- 9.2.1. Wi-Fi
- 9.2.2. Bluetooth
- 9.2.3. Other Technologies (NFC and RFID)
- 9.3. Market Analysis, Insights and Forecast - by Distribution Channel
- 9.3.1. Online Stores
- 9.3.2. Specialty Stores and Convenience Stores
- 9.1. Market Analysis, Insights and Forecast - by Interfacing Devices
- 10. North America Toys Industry Analysis, Insights and Forecast, 2019-2031
- 10.1. Market Analysis, Insights and Forecast - By Country/Sub-region
- 10.1.1 United States
- 10.1.2 Canada
- 10.1.3 Mexico
- 11. Europe Toys Industry Analysis, Insights and Forecast, 2019-2031
- 11.1. Market Analysis, Insights and Forecast - By Country/Sub-region
- 11.1.1 Germany
- 11.1.2 United Kingdom
- 11.1.3 France
- 11.1.4 Spain
- 11.1.5 Italy
- 11.1.6 Spain
- 11.1.7 Belgium
- 11.1.8 Netherland
- 11.1.9 Nordics
- 11.1.10 Rest of Europe
- 12. Asia Pacific Toys Industry Analysis, Insights and Forecast, 2019-2031
- 12.1. Market Analysis, Insights and Forecast - By Country/Sub-region
- 12.1.1 China
- 12.1.2 Japan
- 12.1.3 India
- 12.1.4 South Korea
- 12.1.5 Southeast Asia
- 12.1.6 Australia
- 12.1.7 Indonesia
- 12.1.8 Phillipes
- 12.1.9 Singapore
- 12.1.10 Thailandc
- 12.1.11 Rest of Asia Pacific
- 13. South America Toys Industry Analysis, Insights and Forecast, 2019-2031
- 13.1. Market Analysis, Insights and Forecast - By Country/Sub-region
- 13.1.1 Brazil
- 13.1.2 Argentina
- 13.1.3 Peru
- 13.1.4 Chile
- 13.1.5 Colombia
- 13.1.6 Ecuador
- 13.1.7 Venezuela
- 13.1.8 Rest of South America
- 14. North America Toys Industry Analysis, Insights and Forecast, 2019-2031
- 14.1. Market Analysis, Insights and Forecast - By Country/Sub-region
- 14.1.1 United States
- 14.1.2 Canada
- 14.1.3 Mexico
- 15. MEA Toys Industry Analysis, Insights and Forecast, 2019-2031
- 15.1. Market Analysis, Insights and Forecast - By Country/Sub-region
- 15.1.1 United Arab Emirates
- 15.1.2 Saudi Arabia
- 15.1.3 South Africa
- 15.1.4 Rest of Middle East and Africa
- 16. Competitive Analysis
- 16.1. Global Market Share Analysis 2024
- 16.2. Company Profiles
- 16.2.1 Mattel Inc
- 16.2.1.1. Overview
- 16.2.1.2. Products
- 16.2.1.3. SWOT Analysis
- 16.2.1.4. Recent Developments
- 16.2.1.5. Financials (Based on Availability)
- 16.2.2 The Lego Group
- 16.2.2.1. Overview
- 16.2.2.2. Products
- 16.2.2.3. SWOT Analysis
- 16.2.2.4. Recent Developments
- 16.2.2.5. Financials (Based on Availability)
- 16.2.3 Seebo Interactive Ltd
- 16.2.3.1. Overview
- 16.2.3.2. Products
- 16.2.3.3. SWOT Analysis
- 16.2.3.4. Recent Developments
- 16.2.3.5. Financials (Based on Availability)
- 16.2.4 Sega Toys Co Ltd
- 16.2.4.1. Overview
- 16.2.4.2. Products
- 16.2.4.3. SWOT Analysis
- 16.2.4.4. Recent Developments
- 16.2.4.5. Financials (Based on Availability)
- 16.2.5 Pixel Toys*List Not Exhaustive
- 16.2.5.1. Overview
- 16.2.5.2. Products
- 16.2.5.3. SWOT Analysis
- 16.2.5.4. Recent Developments
- 16.2.5.5. Financials (Based on Availability)
- 16.2.6 Playmobil (Brandstätter Group)
- 16.2.6.1. Overview
- 16.2.6.2. Products
- 16.2.6.3. SWOT Analysis
- 16.2.6.4. Recent Developments
- 16.2.6.5. Financials (Based on Availability)
- 16.2.7 Primo Toys
- 16.2.7.1. Overview
- 16.2.7.2. Products
- 16.2.7.3. SWOT Analysis
- 16.2.7.4. Recent Developments
- 16.2.7.5. Financials (Based on Availability)
- 16.2.8 Pillar Learning
- 16.2.8.1. Overview
- 16.2.8.2. Products
- 16.2.8.3. SWOT Analysis
- 16.2.8.4. Recent Developments
- 16.2.8.5. Financials (Based on Availability)
- 16.2.9 TOSY Robotics JSC
- 16.2.9.1. Overview
- 16.2.9.2. Products
- 16.2.9.3. SWOT Analysis
- 16.2.9.4. Recent Developments
- 16.2.9.5. Financials (Based on Availability)
- 16.2.10 Leapfrog Enterprises Inc
- 16.2.10.1. Overview
- 16.2.10.2. Products
- 16.2.10.3. SWOT Analysis
- 16.2.10.4. Recent Developments
- 16.2.10.5. Financials (Based on Availability)
- 16.2.1 Mattel Inc
List of Figures
- Figure 1: Global Toys Industry Revenue Breakdown (Million, %) by Region 2024 & 2032
- Figure 2: North America Toys Industry Revenue (Million), by Country 2024 & 2032
- Figure 3: North America Toys Industry Revenue Share (%), by Country 2024 & 2032
- Figure 4: Europe Toys Industry Revenue (Million), by Country 2024 & 2032
- Figure 5: Europe Toys Industry Revenue Share (%), by Country 2024 & 2032
- Figure 6: Asia Pacific Toys Industry Revenue (Million), by Country 2024 & 2032
- Figure 7: Asia Pacific Toys Industry Revenue Share (%), by Country 2024 & 2032
- Figure 8: South America Toys Industry Revenue (Million), by Country 2024 & 2032
- Figure 9: South America Toys Industry Revenue Share (%), by Country 2024 & 2032
- Figure 10: North America Toys Industry Revenue (Million), by Country 2024 & 2032
- Figure 11: North America Toys Industry Revenue Share (%), by Country 2024 & 2032
- Figure 12: MEA Toys Industry Revenue (Million), by Country 2024 & 2032
- Figure 13: MEA Toys Industry Revenue Share (%), by Country 2024 & 2032
- Figure 14: North America Toys Industry Revenue (Million), by Interfacing Devices 2024 & 2032
- Figure 15: North America Toys Industry Revenue Share (%), by Interfacing Devices 2024 & 2032
- Figure 16: North America Toys Industry Revenue (Million), by Technology 2024 & 2032
- Figure 17: North America Toys Industry Revenue Share (%), by Technology 2024 & 2032
- Figure 18: North America Toys Industry Revenue (Million), by Distribution Channel 2024 & 2032
- Figure 19: North America Toys Industry Revenue Share (%), by Distribution Channel 2024 & 2032
- Figure 20: North America Toys Industry Revenue (Million), by Country 2024 & 2032
- Figure 21: North America Toys Industry Revenue Share (%), by Country 2024 & 2032
- Figure 22: Europe Toys Industry Revenue (Million), by Interfacing Devices 2024 & 2032
- Figure 23: Europe Toys Industry Revenue Share (%), by Interfacing Devices 2024 & 2032
- Figure 24: Europe Toys Industry Revenue (Million), by Technology 2024 & 2032
- Figure 25: Europe Toys Industry Revenue Share (%), by Technology 2024 & 2032
- Figure 26: Europe Toys Industry Revenue (Million), by Distribution Channel 2024 & 2032
- Figure 27: Europe Toys Industry Revenue Share (%), by Distribution Channel 2024 & 2032
- Figure 28: Europe Toys Industry Revenue (Million), by Country 2024 & 2032
- Figure 29: Europe Toys Industry Revenue Share (%), by Country 2024 & 2032
- Figure 30: Asia Pacific Toys Industry Revenue (Million), by Interfacing Devices 2024 & 2032
- Figure 31: Asia Pacific Toys Industry Revenue Share (%), by Interfacing Devices 2024 & 2032
- Figure 32: Asia Pacific Toys Industry Revenue (Million), by Technology 2024 & 2032
- Figure 33: Asia Pacific Toys Industry Revenue Share (%), by Technology 2024 & 2032
- Figure 34: Asia Pacific Toys Industry Revenue (Million), by Distribution Channel 2024 & 2032
- Figure 35: Asia Pacific Toys Industry Revenue Share (%), by Distribution Channel 2024 & 2032
- Figure 36: Asia Pacific Toys Industry Revenue (Million), by Country 2024 & 2032
- Figure 37: Asia Pacific Toys Industry Revenue Share (%), by Country 2024 & 2032
- Figure 38: Rest of the World Toys Industry Revenue (Million), by Interfacing Devices 2024 & 2032
- Figure 39: Rest of the World Toys Industry Revenue Share (%), by Interfacing Devices 2024 & 2032
- Figure 40: Rest of the World Toys Industry Revenue (Million), by Technology 2024 & 2032
- Figure 41: Rest of the World Toys Industry Revenue Share (%), by Technology 2024 & 2032
- Figure 42: Rest of the World Toys Industry Revenue (Million), by Distribution Channel 2024 & 2032
- Figure 43: Rest of the World Toys Industry Revenue Share (%), by Distribution Channel 2024 & 2032
- Figure 44: Rest of the World Toys Industry Revenue (Million), by Country 2024 & 2032
- Figure 45: Rest of the World Toys Industry Revenue Share (%), by Country 2024 & 2032
List of Tables
- Table 1: Global Toys Industry Revenue Million Forecast, by Region 2019 & 2032
- Table 2: Global Toys Industry Revenue Million Forecast, by Interfacing Devices 2019 & 2032
- Table 3: Global Toys Industry Revenue Million Forecast, by Technology 2019 & 2032
- Table 4: Global Toys Industry Revenue Million Forecast, by Distribution Channel 2019 & 2032
- Table 5: Global Toys Industry Revenue Million Forecast, by Region 2019 & 2032
- Table 6: Global Toys Industry Revenue Million Forecast, by Country 2019 & 2032
- Table 7: United States Toys Industry Revenue (Million) Forecast, by Application 2019 & 2032
- Table 8: Canada Toys Industry Revenue (Million) Forecast, by Application 2019 & 2032
- Table 9: Mexico Toys Industry Revenue (Million) Forecast, by Application 2019 & 2032
- Table 10: Global Toys Industry Revenue Million Forecast, by Country 2019 & 2032
- Table 11: Germany Toys Industry Revenue (Million) Forecast, by Application 2019 & 2032
- Table 12: United Kingdom Toys Industry Revenue (Million) Forecast, by Application 2019 & 2032
- Table 13: France Toys Industry Revenue (Million) Forecast, by Application 2019 & 2032
- Table 14: Spain Toys Industry Revenue (Million) Forecast, by Application 2019 & 2032
- Table 15: Italy Toys Industry Revenue (Million) Forecast, by Application 2019 & 2032
- Table 16: Spain Toys Industry Revenue (Million) Forecast, by Application 2019 & 2032
- Table 17: Belgium Toys Industry Revenue (Million) Forecast, by Application 2019 & 2032
- Table 18: Netherland Toys Industry Revenue (Million) Forecast, by Application 2019 & 2032
- Table 19: Nordics Toys Industry Revenue (Million) Forecast, by Application 2019 & 2032
- Table 20: Rest of Europe Toys Industry Revenue (Million) Forecast, by Application 2019 & 2032
- Table 21: Global Toys Industry Revenue Million Forecast, by Country 2019 & 2032
- Table 22: China Toys Industry Revenue (Million) Forecast, by Application 2019 & 2032
- Table 23: Japan Toys Industry Revenue (Million) Forecast, by Application 2019 & 2032
- Table 24: India Toys Industry Revenue (Million) Forecast, by Application 2019 & 2032
- Table 25: South Korea Toys Industry Revenue (Million) Forecast, by Application 2019 & 2032
- Table 26: Southeast Asia Toys Industry Revenue (Million) Forecast, by Application 2019 & 2032
- Table 27: Australia Toys Industry Revenue (Million) Forecast, by Application 2019 & 2032
- Table 28: Indonesia Toys Industry Revenue (Million) Forecast, by Application 2019 & 2032
- Table 29: Phillipes Toys Industry Revenue (Million) Forecast, by Application 2019 & 2032
- Table 30: Singapore Toys Industry Revenue (Million) Forecast, by Application 2019 & 2032
- Table 31: Thailandc Toys Industry Revenue (Million) Forecast, by Application 2019 & 2032
- Table 32: Rest of Asia Pacific Toys Industry Revenue (Million) Forecast, by Application 2019 & 2032
- Table 33: Global Toys Industry Revenue Million Forecast, by Country 2019 & 2032
- Table 34: Brazil Toys Industry Revenue (Million) Forecast, by Application 2019 & 2032
- Table 35: Argentina Toys Industry Revenue (Million) Forecast, by Application 2019 & 2032
- Table 36: Peru Toys Industry Revenue (Million) Forecast, by Application 2019 & 2032
- Table 37: Chile Toys Industry Revenue (Million) Forecast, by Application 2019 & 2032
- Table 38: Colombia Toys Industry Revenue (Million) Forecast, by Application 2019 & 2032
- Table 39: Ecuador Toys Industry Revenue (Million) Forecast, by Application 2019 & 2032
- Table 40: Venezuela Toys Industry Revenue (Million) Forecast, by Application 2019 & 2032
- Table 41: Rest of South America Toys Industry Revenue (Million) Forecast, by Application 2019 & 2032
- Table 42: Global Toys Industry Revenue Million Forecast, by Country 2019 & 2032
- Table 43: United States Toys Industry Revenue (Million) Forecast, by Application 2019 & 2032
- Table 44: Canada Toys Industry Revenue (Million) Forecast, by Application 2019 & 2032
- Table 45: Mexico Toys Industry Revenue (Million) Forecast, by Application 2019 & 2032
- Table 46: Global Toys Industry Revenue Million Forecast, by Country 2019 & 2032
- Table 47: United Arab Emirates Toys Industry Revenue (Million) Forecast, by Application 2019 & 2032
- Table 48: Saudi Arabia Toys Industry Revenue (Million) Forecast, by Application 2019 & 2032
- Table 49: South Africa Toys Industry Revenue (Million) Forecast, by Application 2019 & 2032
- Table 50: Rest of Middle East and Africa Toys Industry Revenue (Million) Forecast, by Application 2019 & 2032
- Table 51: Global Toys Industry Revenue Million Forecast, by Interfacing Devices 2019 & 2032
- Table 52: Global Toys Industry Revenue Million Forecast, by Technology 2019 & 2032
- Table 53: Global Toys Industry Revenue Million Forecast, by Distribution Channel 2019 & 2032
- Table 54: Global Toys Industry Revenue Million Forecast, by Country 2019 & 2032
- Table 55: Global Toys Industry Revenue Million Forecast, by Interfacing Devices 2019 & 2032
- Table 56: Global Toys Industry Revenue Million Forecast, by Technology 2019 & 2032
- Table 57: Global Toys Industry Revenue Million Forecast, by Distribution Channel 2019 & 2032
- Table 58: Global Toys Industry Revenue Million Forecast, by Country 2019 & 2032
- Table 59: Global Toys Industry Revenue Million Forecast, by Interfacing Devices 2019 & 2032
- Table 60: Global Toys Industry Revenue Million Forecast, by Technology 2019 & 2032
- Table 61: Global Toys Industry Revenue Million Forecast, by Distribution Channel 2019 & 2032
- Table 62: Global Toys Industry Revenue Million Forecast, by Country 2019 & 2032
- Table 63: Global Toys Industry Revenue Million Forecast, by Interfacing Devices 2019 & 2032
- Table 64: Global Toys Industry Revenue Million Forecast, by Technology 2019 & 2032
- Table 65: Global Toys Industry Revenue Million Forecast, by Distribution Channel 2019 & 2032
- Table 66: Global Toys Industry Revenue Million Forecast, by Country 2019 & 2032
Frequently Asked Questions
1. What is the projected Compound Annual Growth Rate (CAGR) of the Toys Industry?
The projected CAGR is approximately 26.08%.
2. Which companies are prominent players in the Toys Industry?
Key companies in the market include Mattel Inc, The Lego Group, Seebo Interactive Ltd, Sega Toys Co Ltd, Pixel Toys*List Not Exhaustive, Playmobil (Brandstätter Group), Primo Toys, Pillar Learning, TOSY Robotics JSC, Leapfrog Enterprises Inc.
3. What are the main segments of the Toys Industry?
The market segments include Interfacing Devices, Technology, Distribution Channel.
4. Can you provide details about the market size?
The market size is estimated to be USD 34.52 Million as of 2022.
5. What are some drivers contributing to market growth?
Increasing Awareness of Technology-Led Education; Increasing Adoption of Technologies like AI. IoT. Smart Homes. Cloud. and Connected Mobile Devices; Parents are Increasingly Willing to Invest Smart Toy Increase Usage To Drive the Market Growth.
6. What are the notable trends driving market growth?
Increasing Awareness of Technology-Led Education to Witness the Growth.
7. Are there any restraints impacting market growth?
Fragmented Market with Several Local Vendors.
8. Can you provide examples of recent developments in the market?
February 2023: Mattel, Inc, in partnership with Velan Studios, announced the launch of Hot Wheels: Rift Rally, an exciting mixed-reality racing experience that will be available on the App Store for iOS, PlayStation 4, and PlayStation 5. This immersive experience allows players to take control of their beloved Hot Wheels vehicles using the innovative Chameleon RC car, which can digitally transform into over 140 different vehicle variations. Players can race with iconic Hot Wheels models like Twin Mill, Bone Shaker, Mach Speeder, Gotta Go, and many other fan favorites. Get ready for an adrenaline-fueled adventure like never before.
9. What pricing options are available for accessing the report?
Pricing options include single-user, multi-user, and enterprise licenses priced at USD 4750, USD 5250, and USD 8750 respectively.
10. Is the market size provided in terms of value or volume?
The market size is provided in terms of value, measured in Million.
11. Are there any specific market keywords associated with the report?
Yes, the market keyword associated with the report is "Toys Industry," which aids in identifying and referencing the specific market segment covered.
12. How do I determine which pricing option suits my needs best?
The pricing options vary based on user requirements and access needs. Individual users may opt for single-user licenses, while businesses requiring broader access may choose multi-user or enterprise licenses for cost-effective access to the report.
13. Are there any additional resources or data provided in the Toys Industry report?
While the report offers comprehensive insights, it's advisable to review the specific contents or supplementary materials provided to ascertain if additional resources or data are available.
14. How can I stay updated on further developments or reports in the Toys Industry?
To stay informed about further developments, trends, and reports in the Toys Industry, consider subscribing to industry newsletters, following relevant companies and organizations, or regularly checking reputable industry news sources and publications.
Methodology
Step 1 - Identification of Relevant Samples Size from Population Database


Step 2 - Approaches for Defining Global Market Size (Value, Volume* & Price*)

Note*: In applicable scenarios
Step 3 - Data Sources
Primary Research
- Web Analytics
- Survey Reports
- Research Institute
- Latest Research Reports
- Opinion Leaders
Secondary Research
- Annual Reports
- White Paper
- Latest Press Release
- Industry Association
- Paid Database
- Investor Presentations

Step 4 - Data Triangulation
Involves using different sources of information in order to increase the validity of a study
These sources are likely to be stakeholders in a program - participants, other researchers, program staff, other community members, and so on.
Then we put all data in single framework & apply various statistical tools to find out the dynamic on the market.
During the analysis stage, feedback from the stakeholder groups would be compared to determine areas of agreement as well as areas of divergence
