

Key Insights
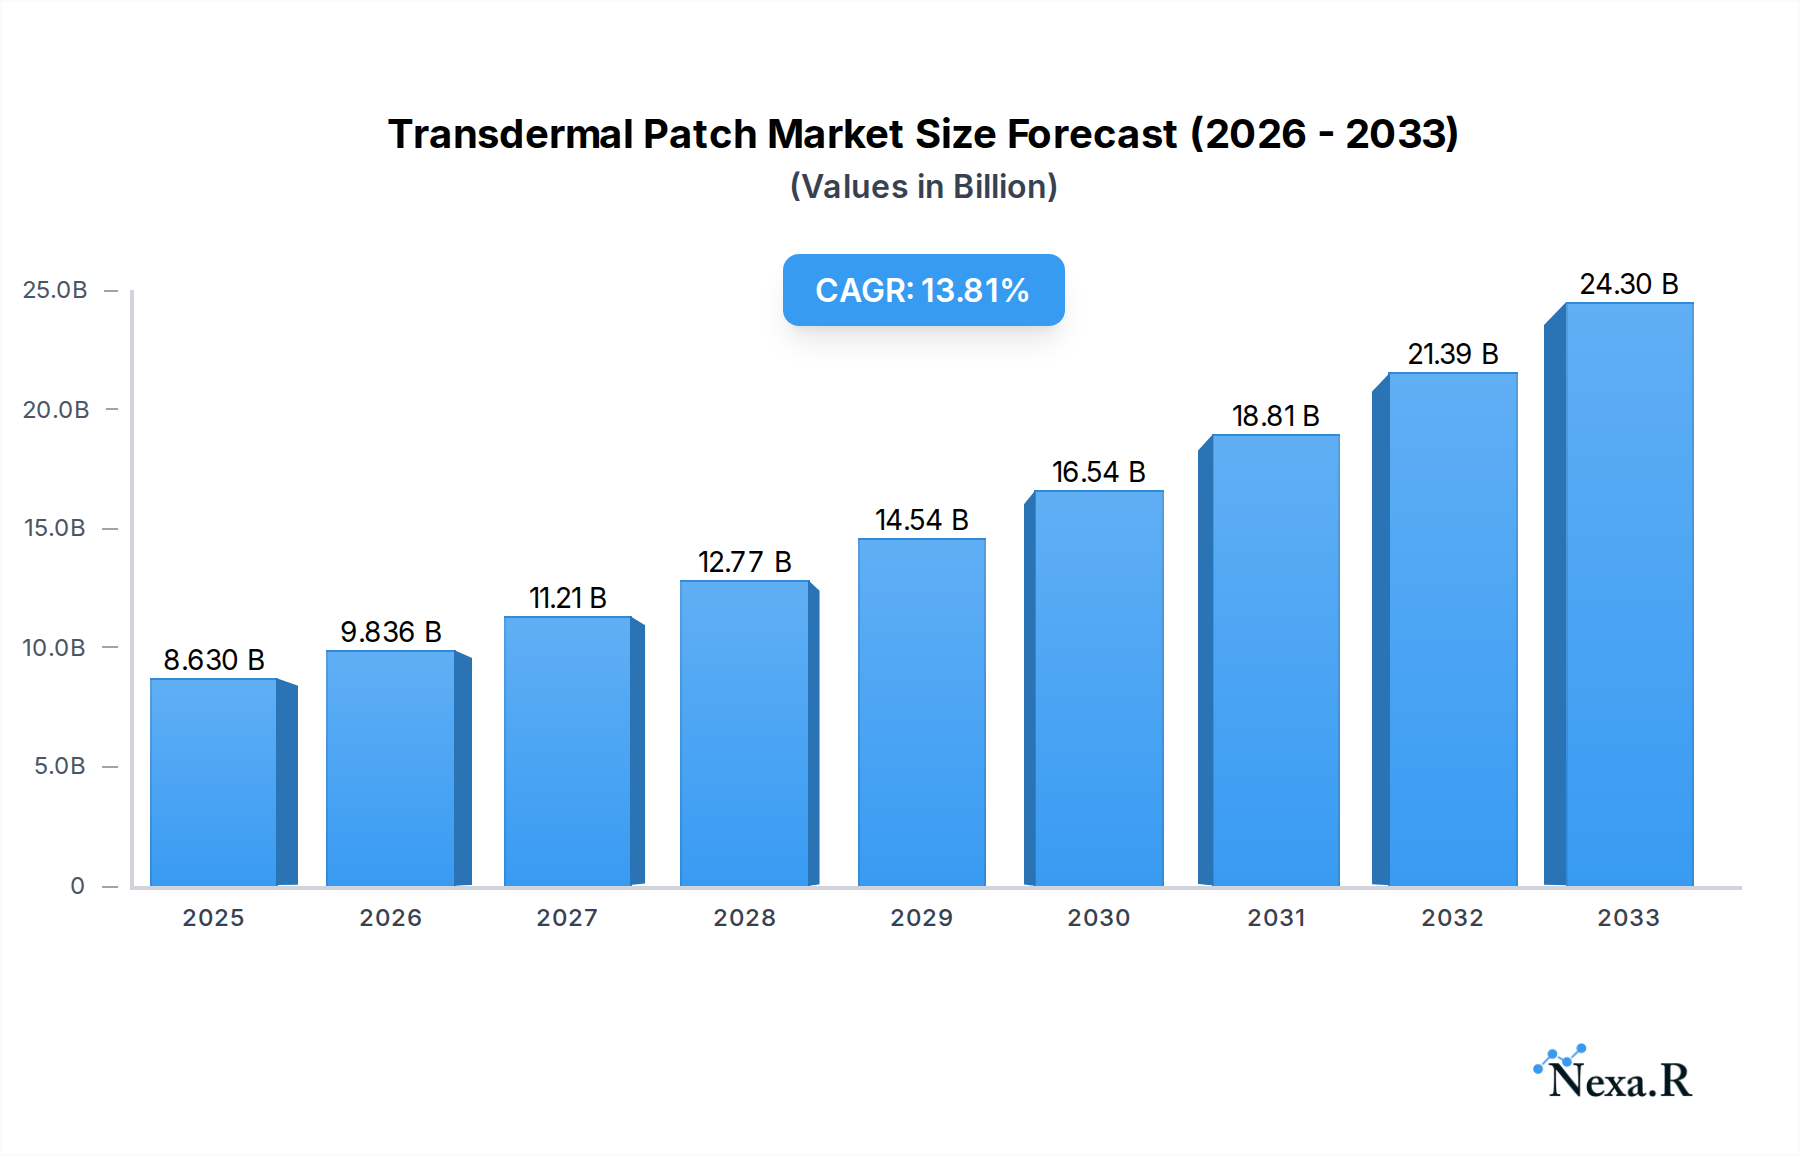
The global Transdermal Patch market is poised for significant expansion, projected to reach USD 8.63 billion in 2025. This robust growth is propelled by a Compound Annual Growth Rate (CAGR) of 13.98% over the forecast period, indicating a dynamic and rapidly evolving landscape. The increasing prevalence of chronic pain, neurological disorders, and the growing preference for non-invasive drug delivery systems are key drivers behind this surge. Furthermore, advancements in patch technology, offering improved drug efficacy, patient compliance, and targeted delivery, are fueling market penetration across both prescription (Rx) and over-the-counter (OTC) channels. The versatility of transdermal patches, catering to a wide range of therapeutic areas, from pain management with lidocaine and diclofenac to hormone replacement therapy and nicotine cessation, contributes significantly to their widespread adoption.

Transdermal Patch Market Size (In Billion)
The market's trajectory is further shaped by a confluence of influential trends. The rising demand for patient-centric healthcare solutions, emphasizing convenience and reduced systemic side effects, strongly favors transdermal patches. Innovations in drug formulation and the development of novel drug delivery mechanisms are continuously expanding the therapeutic applications of these patches. Key segments, including Methyl Salicylate-based patches for topical pain relief and more sophisticated formulations like Rivastigmine and Fentanyl transdermal patches for neurological conditions and severe pain management, respectively, are experiencing substantial growth. Despite the optimistic outlook, certain restraints, such as regulatory hurdles for new product approvals and the high cost associated with some advanced patch technologies, warrant careful consideration. However, the inherent advantages of transdermal delivery, coupled with ongoing research and development by major players like Hisamitsu Pharmaceutical, Johnson & Johnson, and Novartis, are expected to outweigh these challenges, ensuring sustained market expansion.
Transdermal Patch Company Market Share
This report offers an exhaustive analysis of the global transdermal patch market, providing critical insights for stakeholders navigating this dynamic landscape. Covering the period from 2019 to 2033, with a base year of 2025, this study delves into market dynamics, growth trends, regional dominance, product innovations, key drivers, emerging opportunities, and the competitive strategies of major players. We present a detailed examination of the transdermal drug delivery system market and its vital parent and child market segments, projecting a future market size of $18.7 billion by 2033, with a projected CAGR of 6.2% during the forecast period (2025-2033).
Transdermal Patch Market Dynamics & Structure
The transdermal patch market exhibits a moderately concentrated structure, with leading companies like Hisamitsu Pharmaceutical, Johnson & Johnson, Novartis, UCB Pharma, Mylan, and Teva Pharmaceutical holding significant market shares. Technological innovation serves as a primary driver, focusing on enhanced drug permeation, controlled release mechanisms, and patient comfort. Regulatory frameworks, particularly stringent approval processes for new drug formulations and delivery systems, influence market entry and product development. Competitive product substitutes, such as oral medications and injectable formulations, necessitate continuous innovation to maintain market relevance. End-user demographics, including an aging population and rising prevalence of chronic diseases like pain management and neurological disorders, significantly shape demand. Mergers and acquisitions (M&A) are becoming increasingly prevalent as companies seek to expand their product portfolios, gain access to new technologies, and strengthen their market presence. The estimated M&A deal volume in the historical period (2019-2024) reached approximately 15 deals, with a total valuation of $3.2 billion.
- Market Concentration: Dominated by key players with robust R&D capabilities.
- Technological Innovation: Focus on improved drug delivery efficiency and patient compliance.
- Regulatory Hurdles: Strict adherence to FDA and EMA guidelines is crucial for market access.
- Competitive Landscape: Competition from alternative drug delivery methods.
- End-User Demand: Driven by chronic disease management and pain relief needs.
- M&A Activity: Strategic consolidation to enhance market position and expand offerings.
Transdermal Patch Growth Trends & Insights
The transdermal patch market has witnessed consistent growth, evolving from a market size of $9.5 billion in 2019 to an estimated $10.9 billion in 2025. This upward trajectory is underpinned by increasing adoption rates of these convenient and effective drug delivery systems. Technological disruptions, such as advancements in microneedle technology and the development of novel permeation enhancers, are further fueling market penetration, which is projected to reach 25% by 2033. Consumer behavior shifts towards preferring non-invasive and patient-friendly administration methods are also playing a pivotal role. The market size is projected to reach $18.7 billion by 2033, exhibiting a Compound Annual Growth Rate (CAGR) of 6.2% from 2025 to 2033. This growth is driven by factors such as the increasing demand for pain management solutions, the growing prevalence of chronic diseases requiring long-term medication, and the inherent benefits of transdermal patches, including reduced dosing frequency, stable plasma concentrations, and minimized gastrointestinal side effects. The expanding applications beyond pain relief, into areas like hormone replacement therapy, nicotine cessation, and neurological treatments, further contribute to the sustained growth. Innovations in patch design, focusing on comfort, adhesion, and controlled drug release profiles, are also key to capturing a larger market share and enhancing patient compliance. The market's resilience and adaptability to evolving healthcare needs position it for continued robust expansion.
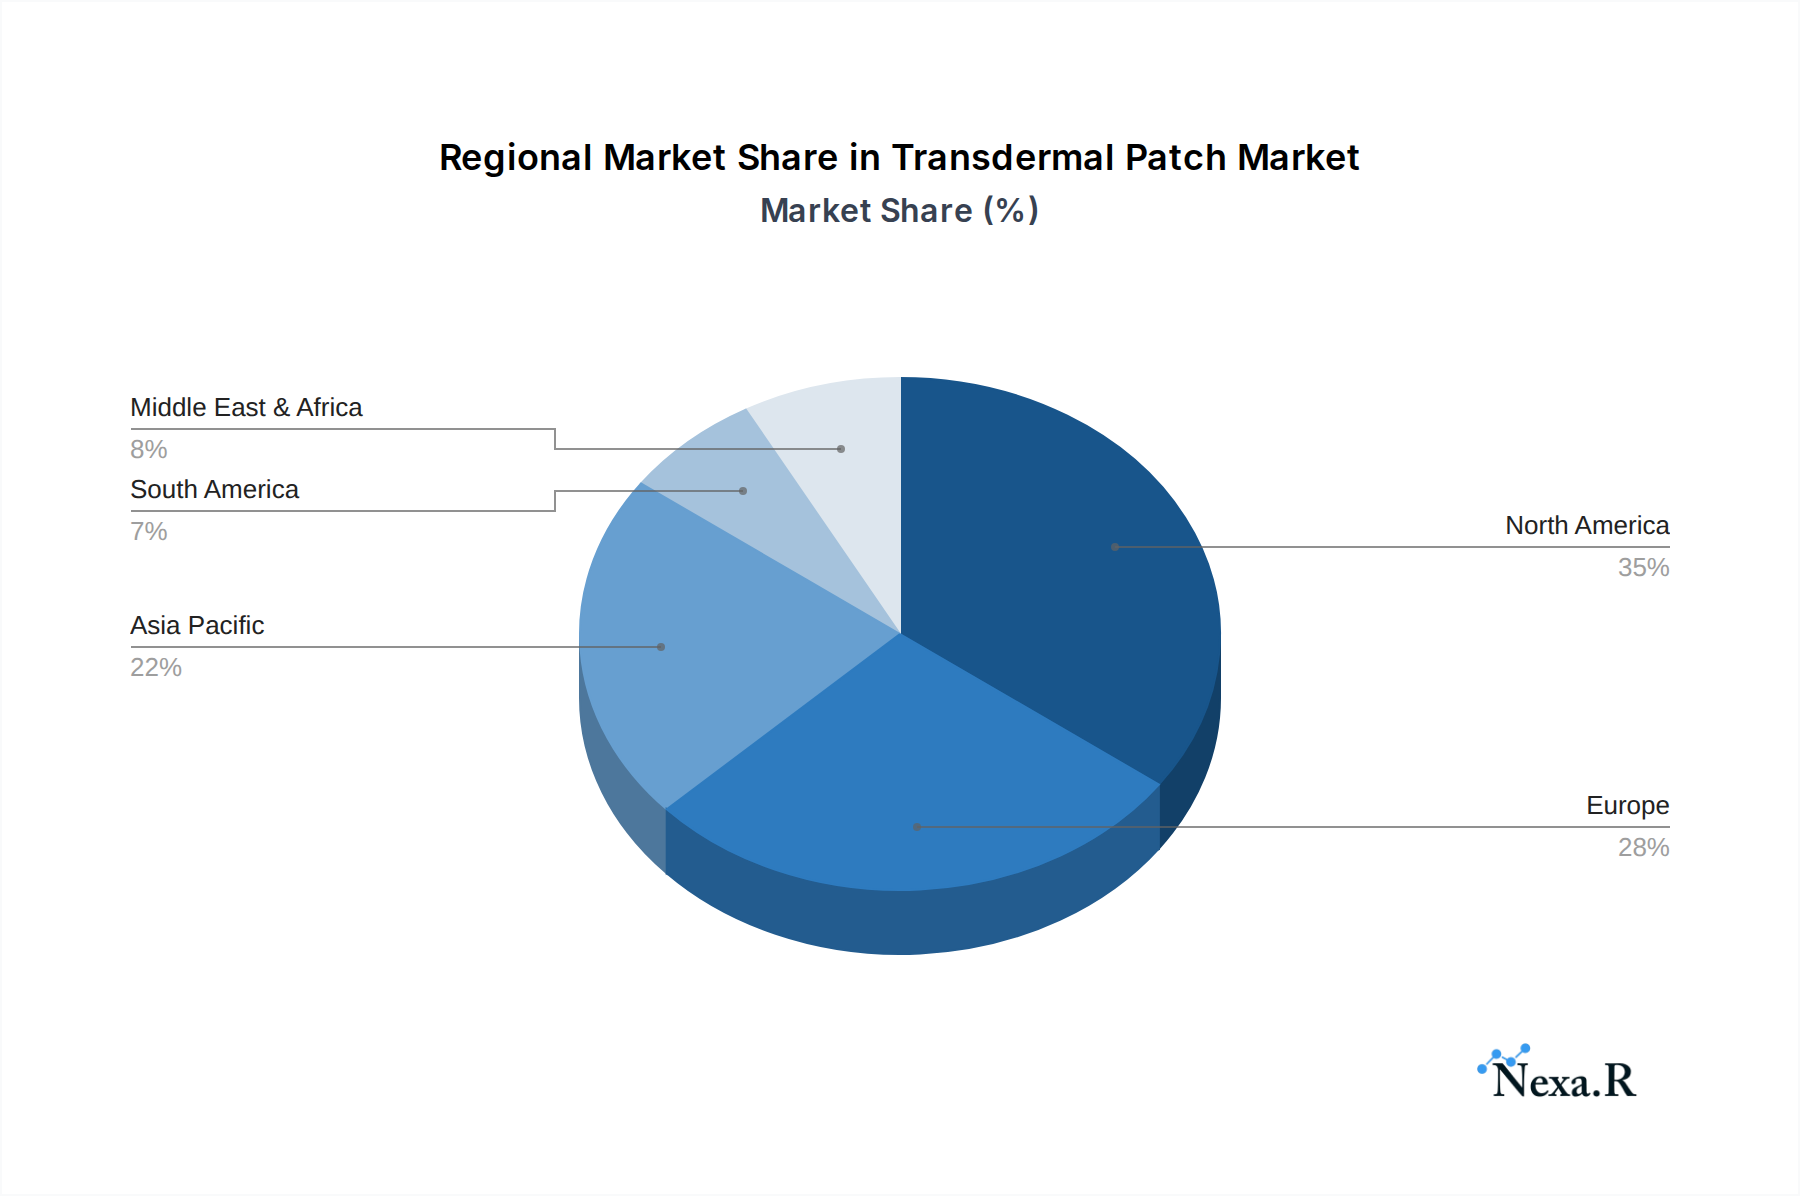
Dominant Regions, Countries, or Segments in Transdermal Patch
North America currently dominates the transdermal patch market, driven by its robust healthcare infrastructure, high disposable income, and the early adoption of advanced medical technologies. The Rx Channel segment, particularly for pain management and hormone replacement therapies, is a major contributor to this regional dominance, accounting for an estimated 65% of the total market value in North America. Countries like the United States and Canada exhibit high market penetration due to significant investment in research and development and a large patient pool requiring chronic disease management.
- Application Dominance: The Rx Channel is a significant growth driver due to the prescription of patches for serious medical conditions like chronic pain, neurological disorders (e.g., Rivastigmine Transdermal Patch for Alzheimer's), and opioid addiction management. The OTC Channel is also expanding, particularly with the increasing availability of Methyl Salicylate-based Patches and Lidocaine Patches for localized pain relief.
- Type Dominance: Fentanyl Transdermal Patches and Lidocaine Patches hold substantial market share within the pain management segment. The Nicotine Transdermal Patch continues to be a significant player in smoking cessation efforts.
- Regional Leadership: North America leads due to advanced healthcare systems and significant R&D investment. Europe follows closely, with a growing emphasis on pain management and hormone therapy. The Asia-Pacific region is expected to exhibit the highest growth rate, driven by increasing healthcare expenditure and a rising prevalence of chronic diseases.
- Country-Specific Drivers:
- United States: High prevalence of chronic pain and neurological disorders; strong pharmaceutical research and development.
- Germany: Robust healthcare reimbursement policies for advanced drug delivery systems.
- Japan: Aging population and increasing demand for effective pain management solutions.
- China: Rapidly expanding healthcare market and growing awareness of transdermal patch benefits.
Transdermal Patch Product Landscape
The transdermal patch product landscape is characterized by continuous innovation aimed at enhancing therapeutic efficacy and patient experience. Key product types include Methyl Salicylate-based Patches for topical pain relief, Rivastigmine Transdermal Patches for Alzheimer's disease, potent Fentanyl Transdermal Patches for severe chronic pain, localized Lidocaine Patches for nerve pain and post-operative discomfort, Diclofenac Patches for musculoskeletal pain, and Nicotine Transdermal Patches for smoking cessation. Emerging advancements focus on multi-layered patch designs for controlled and sustained drug release, improved adhesion for prolonged wear, and the incorporation of novel excipients to enhance skin permeation. These innovations are crucial for differentiating products in a competitive market and addressing unmet patient needs.
Key Drivers, Barriers & Challenges in Transdermal Patch
Key Drivers: The transdermal patch market is propelled by a confluence of factors including the rising global prevalence of chronic pain and neurological disorders, the increasing demand for non-invasive and patient-friendly drug delivery methods, and significant advancements in drug delivery technologies leading to improved patch efficacy and patient compliance. Favorable reimbursement policies for advanced therapies and a growing emphasis on self-medication and home-based care also contribute to market expansion.
Barriers & Challenges: Despite strong growth potential, the market faces challenges such as the high cost of research and development for novel transdermal systems, stringent regulatory approval processes that can delay market entry, and potential skin irritation or allergic reactions in some patients. Competition from established oral and injectable drug formulations, coupled with the need for effective patient education regarding proper patch application and disposal, also presents hurdles to widespread adoption. Supply chain disruptions and the need for specialized manufacturing capabilities can also impact market growth.
Emerging Opportunities in Transdermal Patch
Emerging opportunities in the transdermal patch sector lie in the development of patches for a wider range of therapeutic areas beyond pain and neurological conditions, such as oncology, dermatology, and vaccinations. The untapped potential in emerging economies, coupled with the increasing disposable income and expanding healthcare access in these regions, presents a significant growth avenue. Furthermore, advancements in microneedle patch technology offer the potential for more efficient drug delivery, reduced skin irritation, and novel applications like vaccine delivery, opening up new market segments. Personalized medicine approaches, tailoring patch formulations and dosages to individual patient needs, also represent a promising future direction.
Growth Accelerators in the Transdermal Patch Industry
Long-term growth in the transdermal patch industry is being significantly accelerated by continuous technological breakthroughs in drug permeation enhancement, controlled release mechanisms, and biodegradable patch materials. Strategic partnerships between pharmaceutical companies and technology providers are fostering innovation and expanding product pipelines. Furthermore, proactive market expansion strategies targeting underserved patient populations and therapeutic areas, alongside increasing government initiatives to promote advanced drug delivery systems, are crucial catalysts for sustained growth and increased market penetration globally.
Key Players Shaping the Transdermal Patch Market
- Hisamitsu Pharmaceutical
- Johnson & Johnson
- Novartis
- UCB Pharma
- Mylan
- Teva Pharmaceutical
- Nitto Denko
- Grünenthal
- IBSA Group
- GSK
- Luye Pharma Group
- Pfizer
- Chattem
- Dr Reddy’s Laboratories
- Bayer
- Mundipharma
- Endo International
- Beijing Tide Pharmaceutical
Notable Milestones in Transdermal Patch Sector
- 2019: Launch of novel extended-release lidocaine patch for chronic nerve pain by a major pharmaceutical player.
- 2020: FDA approval of a new transdermal patch for Alzheimer's disease, offering a less invasive treatment option.
- 2021: Significant investment in R&D for microneedle transdermal patch technology by several key companies.
- 2022: Acquisition of a specialized transdermal patch manufacturer by a leading pharmaceutical giant to expand its delivery systems portfolio.
- 2023: Introduction of a new transdermal patch formulation for opioid addiction treatment, emphasizing improved patient compliance.
- 2024 (Estimated): Emergence of early-stage clinical trials for transdermal vaccine delivery systems.
In-Depth Transdermal Patch Market Outlook
The transdermal patch market is poised for robust future growth, driven by sustained innovation in drug delivery technologies and an increasing demand for convenient, effective, and patient-centric therapeutic solutions. The ongoing expansion into new therapeutic areas, coupled with the penetration of emerging economies, presents significant untapped market potential. Strategic collaborations and investments in advanced research, particularly in areas like microneedle patches and personalized drug delivery, will be key to capitalizing on these opportunities and solidifying market leadership in the coming years.
Transdermal Patch Segmentation
-
1. Application
- 1.1. Rx Channel
- 1.2. OTC Channel
-
2. Types
- 2.1. Methyl Salicylate-based Patch
- 2.2. Rivastigmine Transdermal Patch
- 2.3. Fentanyl Transdermal Patch
- 2.4. Lidocaine Patch
- 2.5. Diclofenac Patch
- 2.6. Nicotine Transdermal Patch
- 2.7. Others
Transdermal Patch Segmentation By Geography
-
1. North America
- 1.1. United States
- 1.2. Canada
- 1.3. Mexico
-
2. South America
- 2.1. Brazil
- 2.2. Argentina
- 2.3. Rest of South America
-
3. Europe
- 3.1. United Kingdom
- 3.2. Germany
- 3.3. France
- 3.4. Italy
- 3.5. Spain
- 3.6. Russia
- 3.7. Benelux
- 3.8. Nordics
- 3.9. Rest of Europe
-
4. Middle East & Africa
- 4.1. Turkey
- 4.2. Israel
- 4.3. GCC
- 4.4. North Africa
- 4.5. South Africa
- 4.6. Rest of Middle East & Africa
-
5. Asia Pacific
- 5.1. China
- 5.2. India
- 5.3. Japan
- 5.4. South Korea
- 5.5. ASEAN
- 5.6. Oceania
- 5.7. Rest of Asia Pacific
Transdermal Patch Regional Market Share
Geographic Coverage of Transdermal Patch
Transdermal Patch REPORT HIGHLIGHTS
| Aspects | Details |
|---|---|
| Study Period | 2020-2034 |
| Base Year | 2025 |
| Estimated Year | 2026 |
| Forecast Period | 2026-2034 |
| Historical Period | 2020-2025 |
| Growth Rate | CAGR of 13.98% from 2020-2034 |
| Segmentation |
|
Table of Contents
- 1. Introduction
- 1.1. Research Scope
- 1.2. Market Segmentation
- 1.3. Research Objective
- 1.4. Definitions and Assumptions
- 2. Executive Summary
- 2.1. Market Snapshot
- 3. Market Dynamics
- 3.1. Market Drivers
- 3.2. Market Restrains
- 3.3. Market Trends
- 3.4. Market Opportunities
- 4. Market Factor Analysis
- 4.1. Porters Five Forces
- 4.1.1. Bargaining Power of Suppliers
- 4.1.2. Bargaining Power of Buyers
- 4.1.3. Threat of New Entrants
- 4.1.4. Threat of Substitutes
- 4.1.5. Competitive Rivalry
- 4.2. PESTEL analysis
- 4.3. BCG Analysis
- 4.3.1. Stars (High Growth, High Market Share)
- 4.3.2. Cash Cows (Low Growth, High Market Share)
- 4.3.3. Question Mark (High Growth, Low Market Share)
- 4.3.4. Dogs (Low Growth, Low Market Share)
- 4.4. Ansoff Matrix Analysis
- 4.5. Supply Chain Analysis
- 4.6. Regulatory Landscape
- 4.7. Current Market Potential and Opportunity Assessment (TAM–SAM–SOM Framework)
- 4.8. NRP Analyst Note
- 4.1. Porters Five Forces
- 5. Market Analysis, Insights and Forecast 2021-2033
- 5.1. Market Analysis, Insights and Forecast - by Application
- 5.1.1. Rx Channel
- 5.1.2. OTC Channel
- 5.2. Market Analysis, Insights and Forecast - by Types
- 5.2.1. Methyl Salicylate-based Patch
- 5.2.2. Rivastigmine Transdermal Patch
- 5.2.3. Fentanyl Transdermal Patch
- 5.2.4. Lidocaine Patch
- 5.2.5. Diclofenac Patch
- 5.2.6. Nicotine Transdermal Patch
- 5.2.7. Others
- 5.3. Market Analysis, Insights and Forecast - by Region
- 5.3.1. North America
- 5.3.2. South America
- 5.3.3. Europe
- 5.3.4. Middle East & Africa
- 5.3.5. Asia Pacific
- 5.1. Market Analysis, Insights and Forecast - by Application
- 6. Global Transdermal Patch Analysis, Insights and Forecast, 2021-2033
- 6.1. Market Analysis, Insights and Forecast - by Application
- 6.1.1. Rx Channel
- 6.1.2. OTC Channel
- 6.2. Market Analysis, Insights and Forecast - by Types
- 6.2.1. Methyl Salicylate-based Patch
- 6.2.2. Rivastigmine Transdermal Patch
- 6.2.3. Fentanyl Transdermal Patch
- 6.2.4. Lidocaine Patch
- 6.2.5. Diclofenac Patch
- 6.2.6. Nicotine Transdermal Patch
- 6.2.7. Others
- 6.1. Market Analysis, Insights and Forecast - by Application
- 7. North America Transdermal Patch Analysis, Insights and Forecast, 2020-2032
- 7.1. Market Analysis, Insights and Forecast - by Application
- 7.1.1. Rx Channel
- 7.1.2. OTC Channel
- 7.2. Market Analysis, Insights and Forecast - by Types
- 7.2.1. Methyl Salicylate-based Patch
- 7.2.2. Rivastigmine Transdermal Patch
- 7.2.3. Fentanyl Transdermal Patch
- 7.2.4. Lidocaine Patch
- 7.2.5. Diclofenac Patch
- 7.2.6. Nicotine Transdermal Patch
- 7.2.7. Others
- 7.1. Market Analysis, Insights and Forecast - by Application
- 8. South America Transdermal Patch Analysis, Insights and Forecast, 2020-2032
- 8.1. Market Analysis, Insights and Forecast - by Application
- 8.1.1. Rx Channel
- 8.1.2. OTC Channel
- 8.2. Market Analysis, Insights and Forecast - by Types
- 8.2.1. Methyl Salicylate-based Patch
- 8.2.2. Rivastigmine Transdermal Patch
- 8.2.3. Fentanyl Transdermal Patch
- 8.2.4. Lidocaine Patch
- 8.2.5. Diclofenac Patch
- 8.2.6. Nicotine Transdermal Patch
- 8.2.7. Others
- 8.1. Market Analysis, Insights and Forecast - by Application
- 9. Europe Transdermal Patch Analysis, Insights and Forecast, 2020-2032
- 9.1. Market Analysis, Insights and Forecast - by Application
- 9.1.1. Rx Channel
- 9.1.2. OTC Channel
- 9.2. Market Analysis, Insights and Forecast - by Types
- 9.2.1. Methyl Salicylate-based Patch
- 9.2.2. Rivastigmine Transdermal Patch
- 9.2.3. Fentanyl Transdermal Patch
- 9.2.4. Lidocaine Patch
- 9.2.5. Diclofenac Patch
- 9.2.6. Nicotine Transdermal Patch
- 9.2.7. Others
- 9.1. Market Analysis, Insights and Forecast - by Application
- 10. Middle East & Africa Transdermal Patch Analysis, Insights and Forecast, 2020-2032
- 10.1. Market Analysis, Insights and Forecast - by Application
- 10.1.1. Rx Channel
- 10.1.2. OTC Channel
- 10.2. Market Analysis, Insights and Forecast - by Types
- 10.2.1. Methyl Salicylate-based Patch
- 10.2.2. Rivastigmine Transdermal Patch
- 10.2.3. Fentanyl Transdermal Patch
- 10.2.4. Lidocaine Patch
- 10.2.5. Diclofenac Patch
- 10.2.6. Nicotine Transdermal Patch
- 10.2.7. Others
- 10.1. Market Analysis, Insights and Forecast - by Application
- 11. Asia Pacific Transdermal Patch Analysis, Insights and Forecast, 2020-2032
- 11.1. Market Analysis, Insights and Forecast - by Application
- 11.1.1. Rx Channel
- 11.1.2. OTC Channel
- 11.2. Market Analysis, Insights and Forecast - by Types
- 11.2.1. Methyl Salicylate-based Patch
- 11.2.2. Rivastigmine Transdermal Patch
- 11.2.3. Fentanyl Transdermal Patch
- 11.2.4. Lidocaine Patch
- 11.2.5. Diclofenac Patch
- 11.2.6. Nicotine Transdermal Patch
- 11.2.7. Others
- 11.1. Market Analysis, Insights and Forecast - by Application
- 12. Competitive Analysis
- 12.1. Company Profiles
- 12.1.1 Hisamitsu Pharmaceutical
- 12.1.1.1. Company Overview
- 12.1.1.2. Products
- 12.1.1.3. Company Financials
- 12.1.1.4. SWOT Analysis
- 12.1.2 Johnson & Johnson
- 12.1.2.1. Company Overview
- 12.1.2.2. Products
- 12.1.2.3. Company Financials
- 12.1.2.4. SWOT Analysis
- 12.1.3 Novartis
- 12.1.3.1. Company Overview
- 12.1.3.2. Products
- 12.1.3.3. Company Financials
- 12.1.3.4. SWOT Analysis
- 12.1.4 UCB Pharma
- 12.1.4.1. Company Overview
- 12.1.4.2. Products
- 12.1.4.3. Company Financials
- 12.1.4.4. SWOT Analysis
- 12.1.5 Mylan
- 12.1.5.1. Company Overview
- 12.1.5.2. Products
- 12.1.5.3. Company Financials
- 12.1.5.4. SWOT Analysis
- 12.1.6 Teva Pharmaceutical
- 12.1.6.1. Company Overview
- 12.1.6.2. Products
- 12.1.6.3. Company Financials
- 12.1.6.4. SWOT Analysis
- 12.1.7 Nitto Denko
- 12.1.7.1. Company Overview
- 12.1.7.2. Products
- 12.1.7.3. Company Financials
- 12.1.7.4. SWOT Analysis
- 12.1.8 Grünenthal
- 12.1.8.1. Company Overview
- 12.1.8.2. Products
- 12.1.8.3. Company Financials
- 12.1.8.4. SWOT Analysis
- 12.1.9 IBSA Group
- 12.1.9.1. Company Overview
- 12.1.9.2. Products
- 12.1.9.3. Company Financials
- 12.1.9.4. SWOT Analysis
- 12.1.10 GSK
- 12.1.10.1. Company Overview
- 12.1.10.2. Products
- 12.1.10.3. Company Financials
- 12.1.10.4. SWOT Analysis
- 12.1.11 Luye Pharma Group
- 12.1.11.1. Company Overview
- 12.1.11.2. Products
- 12.1.11.3. Company Financials
- 12.1.11.4. SWOT Analysis
- 12.1.12 Pfizer
- 12.1.12.1. Company Overview
- 12.1.12.2. Products
- 12.1.12.3. Company Financials
- 12.1.12.4. SWOT Analysis
- 12.1.13 Chattem
- 12.1.13.1. Company Overview
- 12.1.13.2. Products
- 12.1.13.3. Company Financials
- 12.1.13.4. SWOT Analysis
- 12.1.14 Dr Reddy’s Laboratories
- 12.1.14.1. Company Overview
- 12.1.14.2. Products
- 12.1.14.3. Company Financials
- 12.1.14.4. SWOT Analysis
- 12.1.15 Bayer
- 12.1.15.1. Company Overview
- 12.1.15.2. Products
- 12.1.15.3. Company Financials
- 12.1.15.4. SWOT Analysis
- 12.1.16 Mundipharma
- 12.1.16.1. Company Overview
- 12.1.16.2. Products
- 12.1.16.3. Company Financials
- 12.1.16.4. SWOT Analysis
- 12.1.17 Endo International
- 12.1.17.1. Company Overview
- 12.1.17.2. Products
- 12.1.17.3. Company Financials
- 12.1.17.4. SWOT Analysis
- 12.1.18 Beijing Tide Pharmaceutical
- 12.1.18.1. Company Overview
- 12.1.18.2. Products
- 12.1.18.3. Company Financials
- 12.1.18.4. SWOT Analysis
- 12.1.1 Hisamitsu Pharmaceutical
- 12.2. Market Entropy
- 12.2.1 Company's Key Areas Served
- 12.2.2 Recent Developments
- 12.3. Company Market Share Analysis 2025
- 12.3.1 Top 5 Companies Market Share Analysis
- 12.3.2 Top 3 Companies Market Share Analysis
- 12.4. List of Potential Customers
- 13. Research Methodology
List of Figures
- Figure 1: Global Transdermal Patch Revenue Breakdown (billion, %) by Region 2025 & 2033
- Figure 2: Global Transdermal Patch Volume Breakdown (K, %) by Region 2025 & 2033
- Figure 3: North America Transdermal Patch Revenue (billion), by Application 2025 & 2033
- Figure 4: North America Transdermal Patch Volume (K), by Application 2025 & 2033
- Figure 5: North America Transdermal Patch Revenue Share (%), by Application 2025 & 2033
- Figure 6: North America Transdermal Patch Volume Share (%), by Application 2025 & 2033
- Figure 7: North America Transdermal Patch Revenue (billion), by Types 2025 & 2033
- Figure 8: North America Transdermal Patch Volume (K), by Types 2025 & 2033
- Figure 9: North America Transdermal Patch Revenue Share (%), by Types 2025 & 2033
- Figure 10: North America Transdermal Patch Volume Share (%), by Types 2025 & 2033
- Figure 11: North America Transdermal Patch Revenue (billion), by Country 2025 & 2033
- Figure 12: North America Transdermal Patch Volume (K), by Country 2025 & 2033
- Figure 13: North America Transdermal Patch Revenue Share (%), by Country 2025 & 2033
- Figure 14: North America Transdermal Patch Volume Share (%), by Country 2025 & 2033
- Figure 15: South America Transdermal Patch Revenue (billion), by Application 2025 & 2033
- Figure 16: South America Transdermal Patch Volume (K), by Application 2025 & 2033
- Figure 17: South America Transdermal Patch Revenue Share (%), by Application 2025 & 2033
- Figure 18: South America Transdermal Patch Volume Share (%), by Application 2025 & 2033
- Figure 19: South America Transdermal Patch Revenue (billion), by Types 2025 & 2033
- Figure 20: South America Transdermal Patch Volume (K), by Types 2025 & 2033
- Figure 21: South America Transdermal Patch Revenue Share (%), by Types 2025 & 2033
- Figure 22: South America Transdermal Patch Volume Share (%), by Types 2025 & 2033
- Figure 23: South America Transdermal Patch Revenue (billion), by Country 2025 & 2033
- Figure 24: South America Transdermal Patch Volume (K), by Country 2025 & 2033
- Figure 25: South America Transdermal Patch Revenue Share (%), by Country 2025 & 2033
- Figure 26: South America Transdermal Patch Volume Share (%), by Country 2025 & 2033
- Figure 27: Europe Transdermal Patch Revenue (billion), by Application 2025 & 2033
- Figure 28: Europe Transdermal Patch Volume (K), by Application 2025 & 2033
- Figure 29: Europe Transdermal Patch Revenue Share (%), by Application 2025 & 2033
- Figure 30: Europe Transdermal Patch Volume Share (%), by Application 2025 & 2033
- Figure 31: Europe Transdermal Patch Revenue (billion), by Types 2025 & 2033
- Figure 32: Europe Transdermal Patch Volume (K), by Types 2025 & 2033
- Figure 33: Europe Transdermal Patch Revenue Share (%), by Types 2025 & 2033
- Figure 34: Europe Transdermal Patch Volume Share (%), by Types 2025 & 2033
- Figure 35: Europe Transdermal Patch Revenue (billion), by Country 2025 & 2033
- Figure 36: Europe Transdermal Patch Volume (K), by Country 2025 & 2033
- Figure 37: Europe Transdermal Patch Revenue Share (%), by Country 2025 & 2033
- Figure 38: Europe Transdermal Patch Volume Share (%), by Country 2025 & 2033
- Figure 39: Middle East & Africa Transdermal Patch Revenue (billion), by Application 2025 & 2033
- Figure 40: Middle East & Africa Transdermal Patch Volume (K), by Application 2025 & 2033
- Figure 41: Middle East & Africa Transdermal Patch Revenue Share (%), by Application 2025 & 2033
- Figure 42: Middle East & Africa Transdermal Patch Volume Share (%), by Application 2025 & 2033
- Figure 43: Middle East & Africa Transdermal Patch Revenue (billion), by Types 2025 & 2033
- Figure 44: Middle East & Africa Transdermal Patch Volume (K), by Types 2025 & 2033
- Figure 45: Middle East & Africa Transdermal Patch Revenue Share (%), by Types 2025 & 2033
- Figure 46: Middle East & Africa Transdermal Patch Volume Share (%), by Types 2025 & 2033
- Figure 47: Middle East & Africa Transdermal Patch Revenue (billion), by Country 2025 & 2033
- Figure 48: Middle East & Africa Transdermal Patch Volume (K), by Country 2025 & 2033
- Figure 49: Middle East & Africa Transdermal Patch Revenue Share (%), by Country 2025 & 2033
- Figure 50: Middle East & Africa Transdermal Patch Volume Share (%), by Country 2025 & 2033
- Figure 51: Asia Pacific Transdermal Patch Revenue (billion), by Application 2025 & 2033
- Figure 52: Asia Pacific Transdermal Patch Volume (K), by Application 2025 & 2033
- Figure 53: Asia Pacific Transdermal Patch Revenue Share (%), by Application 2025 & 2033
- Figure 54: Asia Pacific Transdermal Patch Volume Share (%), by Application 2025 & 2033
- Figure 55: Asia Pacific Transdermal Patch Revenue (billion), by Types 2025 & 2033
- Figure 56: Asia Pacific Transdermal Patch Volume (K), by Types 2025 & 2033
- Figure 57: Asia Pacific Transdermal Patch Revenue Share (%), by Types 2025 & 2033
- Figure 58: Asia Pacific Transdermal Patch Volume Share (%), by Types 2025 & 2033
- Figure 59: Asia Pacific Transdermal Patch Revenue (billion), by Country 2025 & 2033
- Figure 60: Asia Pacific Transdermal Patch Volume (K), by Country 2025 & 2033
- Figure 61: Asia Pacific Transdermal Patch Revenue Share (%), by Country 2025 & 2033
- Figure 62: Asia Pacific Transdermal Patch Volume Share (%), by Country 2025 & 2033
List of Tables
- Table 1: Global Transdermal Patch Revenue billion Forecast, by Application 2020 & 2033
- Table 2: Global Transdermal Patch Volume K Forecast, by Application 2020 & 2033
- Table 3: Global Transdermal Patch Revenue billion Forecast, by Types 2020 & 2033
- Table 4: Global Transdermal Patch Volume K Forecast, by Types 2020 & 2033
- Table 5: Global Transdermal Patch Revenue billion Forecast, by Region 2020 & 2033
- Table 6: Global Transdermal Patch Volume K Forecast, by Region 2020 & 2033
- Table 7: Global Transdermal Patch Revenue billion Forecast, by Application 2020 & 2033
- Table 8: Global Transdermal Patch Volume K Forecast, by Application 2020 & 2033
- Table 9: Global Transdermal Patch Revenue billion Forecast, by Types 2020 & 2033
- Table 10: Global Transdermal Patch Volume K Forecast, by Types 2020 & 2033
- Table 11: Global Transdermal Patch Revenue billion Forecast, by Country 2020 & 2033
- Table 12: Global Transdermal Patch Volume K Forecast, by Country 2020 & 2033
- Table 13: United States Transdermal Patch Revenue (billion) Forecast, by Application 2020 & 2033
- Table 14: United States Transdermal Patch Volume (K) Forecast, by Application 2020 & 2033
- Table 15: Canada Transdermal Patch Revenue (billion) Forecast, by Application 2020 & 2033
- Table 16: Canada Transdermal Patch Volume (K) Forecast, by Application 2020 & 2033
- Table 17: Mexico Transdermal Patch Revenue (billion) Forecast, by Application 2020 & 2033
- Table 18: Mexico Transdermal Patch Volume (K) Forecast, by Application 2020 & 2033
- Table 19: Global Transdermal Patch Revenue billion Forecast, by Application 2020 & 2033
- Table 20: Global Transdermal Patch Volume K Forecast, by Application 2020 & 2033
- Table 21: Global Transdermal Patch Revenue billion Forecast, by Types 2020 & 2033
- Table 22: Global Transdermal Patch Volume K Forecast, by Types 2020 & 2033
- Table 23: Global Transdermal Patch Revenue billion Forecast, by Country 2020 & 2033
- Table 24: Global Transdermal Patch Volume K Forecast, by Country 2020 & 2033
- Table 25: Brazil Transdermal Patch Revenue (billion) Forecast, by Application 2020 & 2033
- Table 26: Brazil Transdermal Patch Volume (K) Forecast, by Application 2020 & 2033
- Table 27: Argentina Transdermal Patch Revenue (billion) Forecast, by Application 2020 & 2033
- Table 28: Argentina Transdermal Patch Volume (K) Forecast, by Application 2020 & 2033
- Table 29: Rest of South America Transdermal Patch Revenue (billion) Forecast, by Application 2020 & 2033
- Table 30: Rest of South America Transdermal Patch Volume (K) Forecast, by Application 2020 & 2033
- Table 31: Global Transdermal Patch Revenue billion Forecast, by Application 2020 & 2033
- Table 32: Global Transdermal Patch Volume K Forecast, by Application 2020 & 2033
- Table 33: Global Transdermal Patch Revenue billion Forecast, by Types 2020 & 2033
- Table 34: Global Transdermal Patch Volume K Forecast, by Types 2020 & 2033
- Table 35: Global Transdermal Patch Revenue billion Forecast, by Country 2020 & 2033
- Table 36: Global Transdermal Patch Volume K Forecast, by Country 2020 & 2033
- Table 37: United Kingdom Transdermal Patch Revenue (billion) Forecast, by Application 2020 & 2033
- Table 38: United Kingdom Transdermal Patch Volume (K) Forecast, by Application 2020 & 2033
- Table 39: Germany Transdermal Patch Revenue (billion) Forecast, by Application 2020 & 2033
- Table 40: Germany Transdermal Patch Volume (K) Forecast, by Application 2020 & 2033
- Table 41: France Transdermal Patch Revenue (billion) Forecast, by Application 2020 & 2033
- Table 42: France Transdermal Patch Volume (K) Forecast, by Application 2020 & 2033
- Table 43: Italy Transdermal Patch Revenue (billion) Forecast, by Application 2020 & 2033
- Table 44: Italy Transdermal Patch Volume (K) Forecast, by Application 2020 & 2033
- Table 45: Spain Transdermal Patch Revenue (billion) Forecast, by Application 2020 & 2033
- Table 46: Spain Transdermal Patch Volume (K) Forecast, by Application 2020 & 2033
- Table 47: Russia Transdermal Patch Revenue (billion) Forecast, by Application 2020 & 2033
- Table 48: Russia Transdermal Patch Volume (K) Forecast, by Application 2020 & 2033
- Table 49: Benelux Transdermal Patch Revenue (billion) Forecast, by Application 2020 & 2033
- Table 50: Benelux Transdermal Patch Volume (K) Forecast, by Application 2020 & 2033
- Table 51: Nordics Transdermal Patch Revenue (billion) Forecast, by Application 2020 & 2033
- Table 52: Nordics Transdermal Patch Volume (K) Forecast, by Application 2020 & 2033
- Table 53: Rest of Europe Transdermal Patch Revenue (billion) Forecast, by Application 2020 & 2033
- Table 54: Rest of Europe Transdermal Patch Volume (K) Forecast, by Application 2020 & 2033
- Table 55: Global Transdermal Patch Revenue billion Forecast, by Application 2020 & 2033
- Table 56: Global Transdermal Patch Volume K Forecast, by Application 2020 & 2033
- Table 57: Global Transdermal Patch Revenue billion Forecast, by Types 2020 & 2033
- Table 58: Global Transdermal Patch Volume K Forecast, by Types 2020 & 2033
- Table 59: Global Transdermal Patch Revenue billion Forecast, by Country 2020 & 2033
- Table 60: Global Transdermal Patch Volume K Forecast, by Country 2020 & 2033
- Table 61: Turkey Transdermal Patch Revenue (billion) Forecast, by Application 2020 & 2033
- Table 62: Turkey Transdermal Patch Volume (K) Forecast, by Application 2020 & 2033
- Table 63: Israel Transdermal Patch Revenue (billion) Forecast, by Application 2020 & 2033
- Table 64: Israel Transdermal Patch Volume (K) Forecast, by Application 2020 & 2033
- Table 65: GCC Transdermal Patch Revenue (billion) Forecast, by Application 2020 & 2033
- Table 66: GCC Transdermal Patch Volume (K) Forecast, by Application 2020 & 2033
- Table 67: North Africa Transdermal Patch Revenue (billion) Forecast, by Application 2020 & 2033
- Table 68: North Africa Transdermal Patch Volume (K) Forecast, by Application 2020 & 2033
- Table 69: South Africa Transdermal Patch Revenue (billion) Forecast, by Application 2020 & 2033
- Table 70: South Africa Transdermal Patch Volume (K) Forecast, by Application 2020 & 2033
- Table 71: Rest of Middle East & Africa Transdermal Patch Revenue (billion) Forecast, by Application 2020 & 2033
- Table 72: Rest of Middle East & Africa Transdermal Patch Volume (K) Forecast, by Application 2020 & 2033
- Table 73: Global Transdermal Patch Revenue billion Forecast, by Application 2020 & 2033
- Table 74: Global Transdermal Patch Volume K Forecast, by Application 2020 & 2033
- Table 75: Global Transdermal Patch Revenue billion Forecast, by Types 2020 & 2033
- Table 76: Global Transdermal Patch Volume K Forecast, by Types 2020 & 2033
- Table 77: Global Transdermal Patch Revenue billion Forecast, by Country 2020 & 2033
- Table 78: Global Transdermal Patch Volume K Forecast, by Country 2020 & 2033
- Table 79: China Transdermal Patch Revenue (billion) Forecast, by Application 2020 & 2033
- Table 80: China Transdermal Patch Volume (K) Forecast, by Application 2020 & 2033
- Table 81: India Transdermal Patch Revenue (billion) Forecast, by Application 2020 & 2033
- Table 82: India Transdermal Patch Volume (K) Forecast, by Application 2020 & 2033
- Table 83: Japan Transdermal Patch Revenue (billion) Forecast, by Application 2020 & 2033
- Table 84: Japan Transdermal Patch Volume (K) Forecast, by Application 2020 & 2033
- Table 85: South Korea Transdermal Patch Revenue (billion) Forecast, by Application 2020 & 2033
- Table 86: South Korea Transdermal Patch Volume (K) Forecast, by Application 2020 & 2033
- Table 87: ASEAN Transdermal Patch Revenue (billion) Forecast, by Application 2020 & 2033
- Table 88: ASEAN Transdermal Patch Volume (K) Forecast, by Application 2020 & 2033
- Table 89: Oceania Transdermal Patch Revenue (billion) Forecast, by Application 2020 & 2033
- Table 90: Oceania Transdermal Patch Volume (K) Forecast, by Application 2020 & 2033
- Table 91: Rest of Asia Pacific Transdermal Patch Revenue (billion) Forecast, by Application 2020 & 2033
- Table 92: Rest of Asia Pacific Transdermal Patch Volume (K) Forecast, by Application 2020 & 2033
Frequently Asked Questions
1. What is the projected Compound Annual Growth Rate (CAGR) of the Transdermal Patch?
The projected CAGR is approximately 13.98%.
2. Which companies are prominent players in the Transdermal Patch?
Key companies in the market include Hisamitsu Pharmaceutical, Johnson & Johnson, Novartis, UCB Pharma, Mylan, Teva Pharmaceutical, Nitto Denko, Grünenthal, IBSA Group, GSK, Luye Pharma Group, Pfizer, Chattem, Dr Reddy’s Laboratories, Bayer, Mundipharma, Endo International, Beijing Tide Pharmaceutical.
3. What are the main segments of the Transdermal Patch?
The market segments include Application, Types.
4. Can you provide details about the market size?
The market size is estimated to be USD 8.63 billion as of 2022.
5. What are some drivers contributing to market growth?
N/A
6. What are the notable trends driving market growth?
N/A
7. Are there any restraints impacting market growth?
N/A
8. Can you provide examples of recent developments in the market?
N/A
9. What pricing options are available for accessing the report?
Pricing options include single-user, multi-user, and enterprise licenses priced at USD 3350.00, USD 5025.00, and USD 6700.00 respectively.
10. Is the market size provided in terms of value or volume?
The market size is provided in terms of value, measured in billion and volume, measured in K.
11. Are there any specific market keywords associated with the report?
Yes, the market keyword associated with the report is "Transdermal Patch," which aids in identifying and referencing the specific market segment covered.
12. How do I determine which pricing option suits my needs best?
The pricing options vary based on user requirements and access needs. Individual users may opt for single-user licenses, while businesses requiring broader access may choose multi-user or enterprise licenses for cost-effective access to the report.
13. Are there any additional resources or data provided in the Transdermal Patch report?
While the report offers comprehensive insights, it's advisable to review the specific contents or supplementary materials provided to ascertain if additional resources or data are available.
14. How can I stay updated on further developments or reports in the Transdermal Patch?
To stay informed about further developments, trends, and reports in the Transdermal Patch, consider subscribing to industry newsletters, following relevant companies and organizations, or regularly checking reputable industry news sources and publications.
Methodology
Step 1 - Identification of Relevant Samples Size from Population Database


Step 2 - Approaches for Defining Global Market Size (Value, Volume* & Price*)

Note*: In applicable scenarios
Step 3 - Data Sources
Primary Research
- Web Analytics
- Survey Reports
- Research Institute
- Latest Research Reports
- Opinion Leaders
Secondary Research
- Annual Reports
- White Paper
- Latest Press Release
- Industry Association
- Paid Database
- Investor Presentations

Step 4 - Data Triangulation
Involves using different sources of information in order to increase the validity of a study
These sources are likely to be stakeholders in a program - participants, other researchers, program staff, other community members, and so on.
Then we put all data in single framework & apply various statistical tools to find out the dynamic on the market.
During the analysis stage, feedback from the stakeholder groups would be compared to determine areas of agreement as well as areas of divergence