

Key Insights
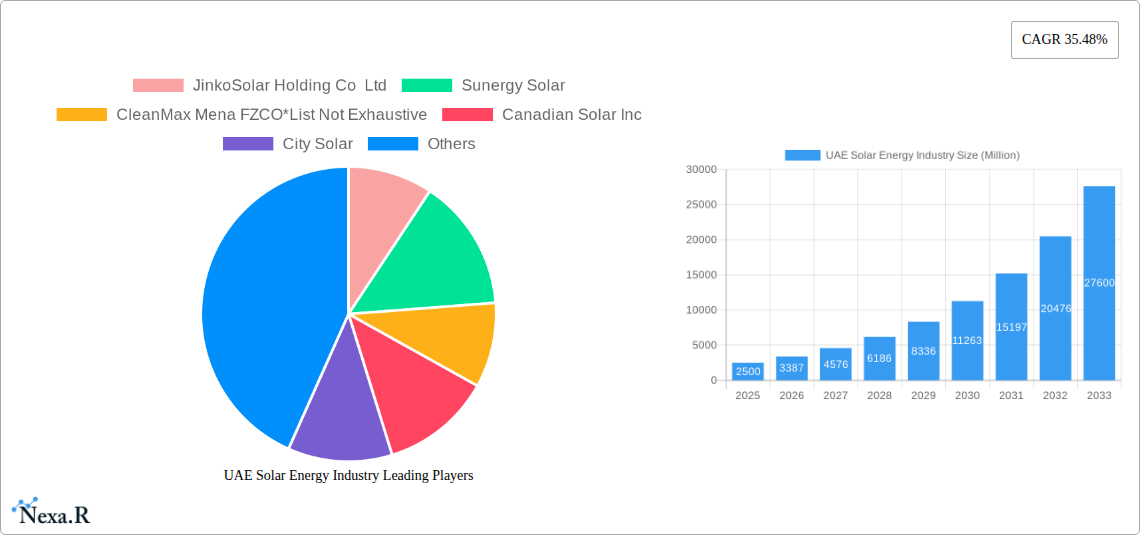
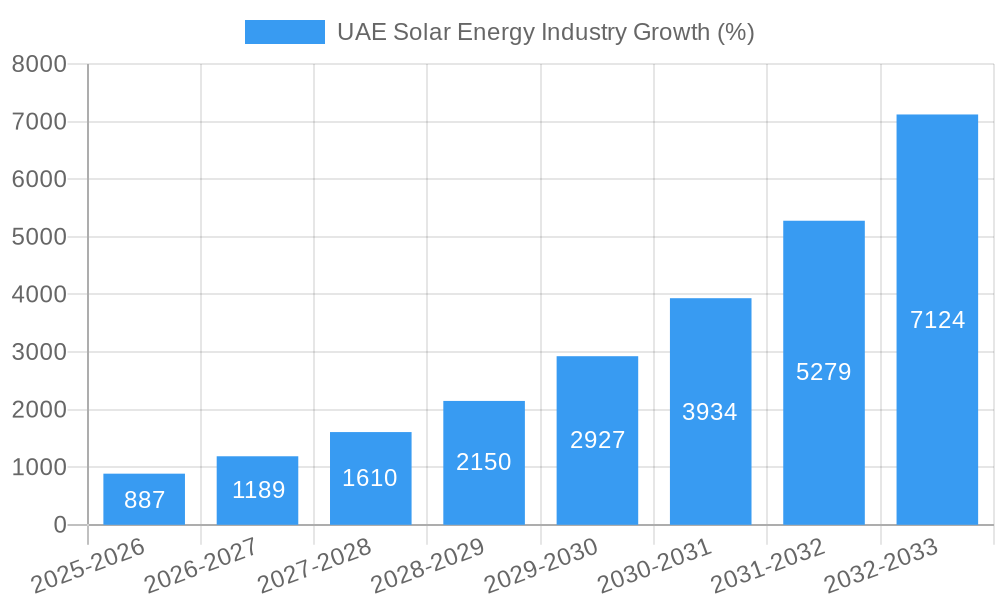
The UAE solar energy market is experiencing robust growth, driven by the nation's ambitious renewable energy targets and supportive government policies. A 35.48% CAGR from 2019-2033 indicates a significant expansion, transforming the energy landscape. The market, segmented by technology (photovoltaic and concentrated solar power) and deployment (utility, commercial & industrial, and residential), shows strong potential across all segments. The utility-scale sector is likely the largest contributor, given the UAE's focus on large-scale solar farms to meet its energy demands. However, the residential and commercial & industrial sectors are also anticipated to demonstrate significant growth, fueled by decreasing solar panel costs and increasing consumer awareness of environmental sustainability. Key players like JinkoSolar, Sunergy, Canadian Solar, and Masdar are actively shaping the market, attracting further investments and driving technological innovation. The government's commitment to diversifying its energy sources and reducing its carbon footprint is a major catalyst, while potential challenges could include land availability for large-scale projects and ensuring grid integration capabilities. The forecast period of 2025-2033 is expected to witness substantial investments in solar energy infrastructure, further bolstering the market's growth trajectory.
The UAE's strategic location and abundant sunlight make it ideally suited for solar energy harnessing. The market's success hinges on continued government support through favorable regulations, financial incentives, and sustained investment in research and development. Challenges, such as integrating intermittent solar power effectively into the national grid and managing the associated energy storage needs, will require innovative solutions. Despite these challenges, the overall outlook remains positive, with the UAE poised to become a regional leader in solar energy adoption, attracting significant foreign investment and fostering technological advancements. The long-term growth projection for the sector reflects a confident outlook, with continued expansion driven by technological improvements, decreasing costs, and the increasing need for sustainable energy solutions.
UAE Solar Energy Industry: Market Report 2019-2033
This comprehensive report provides an in-depth analysis of the UAE solar energy market, offering invaluable insights for industry professionals, investors, and policymakers. Covering the period 2019-2033, with a focus on 2025, this report unravels market dynamics, growth trends, and future opportunities within the UAE's rapidly expanding renewable energy sector. The report utilizes both parent (Solar Energy) and child markets (Photovoltaic, Concentrated Solar Power) for enhanced targeting and search engine optimization.
UAE Solar Energy Industry Market Dynamics & Structure
This section analyzes the structure and dynamics of the UAE solar energy market, encompassing market concentration, technological innovation, regulatory frameworks, competitive substitutes, end-user demographics, and M&A activities. The historical period (2019-2024) and base year (2025) provide a strong foundation for forecasting market trends through 2033.
- Market Concentration: The UAE solar market exhibits a moderately concentrated structure, with key players like Masdar holding significant market share. However, the presence of numerous smaller players indicates a competitive landscape. We estimate the top 5 players hold approximately xx% of the market in 2025.
- Technological Innovation: Photovoltaic (PV) technology dominates, with Concentrated Solar Power (CSP) representing a smaller but growing segment. Innovation focuses on improving efficiency, reducing costs, and enhancing grid integration. Barriers to innovation include high initial investment costs and regulatory complexities.
- Regulatory Framework: The UAE government's strong support for renewable energy, including attractive feed-in tariffs and supportive policies, significantly boosts market growth. However, regulatory clarity on grid connection and permitting remains crucial.
- Competitive Substitutes: While fossil fuels remain prevalent, the declining cost of solar energy presents a strong competitive advantage, driving substitution.
- End-User Demographics: The utility sector is the largest consumer, followed by commercial & industrial and residential sectors, with growth anticipated across all segments.
- M&A Trends: The UAE has witnessed a moderate number of M&A deals in the solar energy sector in recent years, with xx deals recorded between 2019 and 2024, primarily focused on consolidating market share and accessing technology. We project xx deals in the forecast period (2025-2033).
UAE Solar Energy Industry Growth Trends & Insights
This section provides a detailed analysis of the UAE solar energy market's growth trajectory, leveraging extensive data analysis to provide a comprehensive view of market size evolution, adoption rates, technological disruptions, and shifting consumer behavior. The analysis incorporates key performance indicators such as CAGR and market penetration to reveal deeper insights. Market size in 2025 is estimated at xx Million, with a projected CAGR of xx% during the forecast period (2025-2033), resulting in a market size of xx Million by 2033. The rising adoption of solar energy is primarily driven by decreasing costs, supportive government policies, and increasing environmental awareness among consumers.
Dominant Regions, Countries, or Segments in UAE Solar Energy Industry
This section identifies the leading regions, countries, or segments within the UAE solar energy market, driving overall growth. The analysis delves into the dominance factors for each segment, considering market share, growth potential, economic policies, and infrastructure development.
- Technology: Photovoltaic (PV) technology is the dominant segment, accounting for xx% of the market in 2025, due to its lower cost and established technology. CSP holds xx% market share, expected to increase gradually.
- Deployment: The utility-scale segment is the largest, driven by government initiatives to increase renewable energy capacity. The commercial and industrial segment is experiencing significant growth, fueled by cost savings and corporate sustainability goals. The residential segment is relatively smaller but demonstrates promising growth potential.
- Key Drivers: The UAE's ambitious renewable energy targets, government subsidies, decreasing solar energy costs, and increasing energy demand are key drivers for growth. Abu Dhabi's Masdar City and Dubai's Mohammed bin Rashid Al Maktoum Solar Park are key drivers for the sector.
UAE Solar Energy Industry Product Landscape
The UAE solar energy market showcases diverse product offerings, with continuous innovations in PV module technology (e.g., improved efficiency, bifacial modules) and CSP systems. These advancements enhance performance metrics and offer compelling unique selling propositions, driving market competitiveness. The focus is on high-efficiency, cost-effective solutions optimized for the region’s climate.
Key Drivers, Barriers & Challenges in UAE Solar Energy Industry
Key Drivers:
- Decreasing solar energy costs
- Supportive government policies and renewable energy targets
- Increasing energy demand
- Growing environmental awareness
Key Challenges:
- Land availability for large-scale solar projects
- Grid infrastructure limitations
- Dependence on imported solar components (xx% in 2025)
- Potential for regulatory changes
Emerging Opportunities in UAE Solar Energy Industry
Emerging opportunities include:
- Growth of the residential solar market
- Integration of solar energy with energy storage solutions
- Development of solar-powered microgrids
- Exploration of agrivoltaics (combining solar power with agriculture).
Growth Accelerators in the UAE Solar Energy Industry
Long-term growth is fueled by technological advancements like Perovskite solar cells, strategic partnerships between international and domestic players (e.g., ADNOC's partnership with Emerge), and expanding market penetration into previously underserved segments.
Key Players Shaping the UAE Solar Energy Industry Market
- JinkoSolar Holding Co Ltd
- Sunergy Solar
- CleanMax Mena FZCO
- Canadian Solar Inc
- City Solar
- Masdar (Abu Dhabi Future Energy Company)
- MAYSUN SOLAR FZCO
- Enerwhere
- ACWA Power
Notable Milestones in UAE Solar Energy Industry Sector
- January 2023: Suntech delivered 680MW solar modules for the Al Dhafra PV2 Solar Power Plant, furthering construction of the world's largest single-site solar power plant.
- May 2023: ADNOC Distribution partnered with Emerge (EDF & Masdar joint venture) to develop on-site solar power across its service station network, commencing in Dubai.
In-Depth UAE Solar Energy Industry Market Outlook
The UAE solar energy market is poised for substantial growth, driven by sustained government support, technological advancements, and increasing private sector investment. Strategic opportunities lie in expanding into the residential sector, integrating storage solutions, and developing innovative applications like agrivoltaics. The market's strong growth trajectory is expected to continue throughout the forecast period (2025-2033), driven by these factors.
UAE Solar Energy Industry Segmentation
-
1. Technology
- 1.1. Photovoltaic
- 1.2. Concentrated Solar Power (CSP)
-
2. Deployment
- 2.1. Utility
- 2.2. Commercial and Industrial
- 2.3. Residential
UAE Solar Energy Industry Segmentation By Geography
-
1. North America
- 1.1. United States
- 1.2. Canada
- 1.3. Mexico
-
2. South America
- 2.1. Brazil
- 2.2. Argentina
- 2.3. Rest of South America
-
3. Europe
- 3.1. United Kingdom
- 3.2. Germany
- 3.3. France
- 3.4. Italy
- 3.5. Spain
- 3.6. Russia
- 3.7. Benelux
- 3.8. Nordics
- 3.9. Rest of Europe
-
4. Middle East & Africa
- 4.1. Turkey
- 4.2. Israel
- 4.3. GCC
- 4.4. North Africa
- 4.5. South Africa
- 4.6. Rest of Middle East & Africa
-
5. Asia Pacific
- 5.1. China
- 5.2. India
- 5.3. Japan
- 5.4. South Korea
- 5.5. ASEAN
- 5.6. Oceania
- 5.7. Rest of Asia Pacific
UAE Solar Energy Industry REPORT HIGHLIGHTS
| Aspects | Details |
|---|---|
| Study Period | 2019-2033 |
| Base Year | 2024 |
| Estimated Year | 2025 |
| Forecast Period | 2025-2033 |
| Historical Period | 2019-2024 |
| Growth Rate | CAGR of 35.48% from 2019-2033 |
| Segmentation |
|
Table of Contents
- 1. Introduction
- 1.1. Research Scope
- 1.2. Market Segmentation
- 1.3. Research Methodology
- 1.4. Definitions and Assumptions
- 2. Executive Summary
- 2.1. Introduction
- 3. Market Dynamics
- 3.1. Introduction
- 3.2. Market Drivers
- 3.2.1. 4.; Rising Government Policies to Support Solar PV Installation4.; Rising Installation of Renewable Energy to Reduce Dependency on Fossil Fuels
- 3.3. Market Restrains
- 3.3.1 4.; Rising Adoption of Alternative Clean Energy Sources such as Wind
- 3.3.2 Geothermal
- 3.3.3 Bioenergy
- 3.3.4 and Others
- 3.4. Market Trends
- 3.4.1. Solar Photovoltaic to Dominate the Market
- 4. Market Factor Analysis
- 4.1. Porters Five Forces
- 4.2. Supply/Value Chain
- 4.3. PESTEL analysis
- 4.4. Market Entropy
- 4.5. Patent/Trademark Analysis
- 5. Global UAE Solar Energy Industry Analysis, Insights and Forecast, 2019-2031
- 5.1. Market Analysis, Insights and Forecast - by Technology
- 5.1.1. Photovoltaic
- 5.1.2. Concentrated Solar Power (CSP)
- 5.2. Market Analysis, Insights and Forecast - by Deployment
- 5.2.1. Utility
- 5.2.2. Commercial and Industrial
- 5.2.3. Residential
- 5.3. Market Analysis, Insights and Forecast - by Region
- 5.3.1. North America
- 5.3.2. South America
- 5.3.3. Europe
- 5.3.4. Middle East & Africa
- 5.3.5. Asia Pacific
- 5.1. Market Analysis, Insights and Forecast - by Technology
- 6. North America UAE Solar Energy Industry Analysis, Insights and Forecast, 2019-2031
- 6.1. Market Analysis, Insights and Forecast - by Technology
- 6.1.1. Photovoltaic
- 6.1.2. Concentrated Solar Power (CSP)
- 6.2. Market Analysis, Insights and Forecast - by Deployment
- 6.2.1. Utility
- 6.2.2. Commercial and Industrial
- 6.2.3. Residential
- 6.1. Market Analysis, Insights and Forecast - by Technology
- 7. South America UAE Solar Energy Industry Analysis, Insights and Forecast, 2019-2031
- 7.1. Market Analysis, Insights and Forecast - by Technology
- 7.1.1. Photovoltaic
- 7.1.2. Concentrated Solar Power (CSP)
- 7.2. Market Analysis, Insights and Forecast - by Deployment
- 7.2.1. Utility
- 7.2.2. Commercial and Industrial
- 7.2.3. Residential
- 7.1. Market Analysis, Insights and Forecast - by Technology
- 8. Europe UAE Solar Energy Industry Analysis, Insights and Forecast, 2019-2031
- 8.1. Market Analysis, Insights and Forecast - by Technology
- 8.1.1. Photovoltaic
- 8.1.2. Concentrated Solar Power (CSP)
- 8.2. Market Analysis, Insights and Forecast - by Deployment
- 8.2.1. Utility
- 8.2.2. Commercial and Industrial
- 8.2.3. Residential
- 8.1. Market Analysis, Insights and Forecast - by Technology
- 9. Middle East & Africa UAE Solar Energy Industry Analysis, Insights and Forecast, 2019-2031
- 9.1. Market Analysis, Insights and Forecast - by Technology
- 9.1.1. Photovoltaic
- 9.1.2. Concentrated Solar Power (CSP)
- 9.2. Market Analysis, Insights and Forecast - by Deployment
- 9.2.1. Utility
- 9.2.2. Commercial and Industrial
- 9.2.3. Residential
- 9.1. Market Analysis, Insights and Forecast - by Technology
- 10. Asia Pacific UAE Solar Energy Industry Analysis, Insights and Forecast, 2019-2031
- 10.1. Market Analysis, Insights and Forecast - by Technology
- 10.1.1. Photovoltaic
- 10.1.2. Concentrated Solar Power (CSP)
- 10.2. Market Analysis, Insights and Forecast - by Deployment
- 10.2.1. Utility
- 10.2.2. Commercial and Industrial
- 10.2.3. Residential
- 10.1. Market Analysis, Insights and Forecast - by Technology
- 11. Competitive Analysis
- 11.1. Global Market Share Analysis 2024
- 11.2. Company Profiles
- 11.2.1 JinkoSolar Holding Co Ltd
- 11.2.1.1. Overview
- 11.2.1.2. Products
- 11.2.1.3. SWOT Analysis
- 11.2.1.4. Recent Developments
- 11.2.1.5. Financials (Based on Availability)
- 11.2.2 Sunergy Solar
- 11.2.2.1. Overview
- 11.2.2.2. Products
- 11.2.2.3. SWOT Analysis
- 11.2.2.4. Recent Developments
- 11.2.2.5. Financials (Based on Availability)
- 11.2.3 CleanMax Mena FZCO*List Not Exhaustive
- 11.2.3.1. Overview
- 11.2.3.2. Products
- 11.2.3.3. SWOT Analysis
- 11.2.3.4. Recent Developments
- 11.2.3.5. Financials (Based on Availability)
- 11.2.4 Canadian Solar Inc
- 11.2.4.1. Overview
- 11.2.4.2. Products
- 11.2.4.3. SWOT Analysis
- 11.2.4.4. Recent Developments
- 11.2.4.5. Financials (Based on Availability)
- 11.2.5 City Solar
- 11.2.5.1. Overview
- 11.2.5.2. Products
- 11.2.5.3. SWOT Analysis
- 11.2.5.4. Recent Developments
- 11.2.5.5. Financials (Based on Availability)
- 11.2.6 Masdar (Abu Dhabi Future Energy Company)
- 11.2.6.1. Overview
- 11.2.6.2. Products
- 11.2.6.3. SWOT Analysis
- 11.2.6.4. Recent Developments
- 11.2.6.5. Financials (Based on Availability)
- 11.2.7 MAYSUN SOLAR FZCO
- 11.2.7.1. Overview
- 11.2.7.2. Products
- 11.2.7.3. SWOT Analysis
- 11.2.7.4. Recent Developments
- 11.2.7.5. Financials (Based on Availability)
- 11.2.8 Enerwhere
- 11.2.8.1. Overview
- 11.2.8.2. Products
- 11.2.8.3. SWOT Analysis
- 11.2.8.4. Recent Developments
- 11.2.8.5. Financials (Based on Availability)
- 11.2.9 ACWA Power
- 11.2.9.1. Overview
- 11.2.9.2. Products
- 11.2.9.3. SWOT Analysis
- 11.2.9.4. Recent Developments
- 11.2.9.5. Financials (Based on Availability)
- 11.2.1 JinkoSolar Holding Co Ltd
List of Figures
- Figure 1: Global UAE Solar Energy Industry Revenue Breakdown (Million, %) by Region 2024 & 2032
- Figure 2: Global UAE Solar Energy Industry Volume Breakdown (gigawatt, %) by Region 2024 & 2032
- Figure 3: UAE UAE Solar Energy Industry Revenue (Million), by Country 2024 & 2032
- Figure 4: UAE UAE Solar Energy Industry Volume (gigawatt), by Country 2024 & 2032
- Figure 5: UAE UAE Solar Energy Industry Revenue Share (%), by Country 2024 & 2032
- Figure 6: UAE UAE Solar Energy Industry Volume Share (%), by Country 2024 & 2032
- Figure 7: North America UAE Solar Energy Industry Revenue (Million), by Technology 2024 & 2032
- Figure 8: North America UAE Solar Energy Industry Volume (gigawatt), by Technology 2024 & 2032
- Figure 9: North America UAE Solar Energy Industry Revenue Share (%), by Technology 2024 & 2032
- Figure 10: North America UAE Solar Energy Industry Volume Share (%), by Technology 2024 & 2032
- Figure 11: North America UAE Solar Energy Industry Revenue (Million), by Deployment 2024 & 2032
- Figure 12: North America UAE Solar Energy Industry Volume (gigawatt), by Deployment 2024 & 2032
- Figure 13: North America UAE Solar Energy Industry Revenue Share (%), by Deployment 2024 & 2032
- Figure 14: North America UAE Solar Energy Industry Volume Share (%), by Deployment 2024 & 2032
- Figure 15: North America UAE Solar Energy Industry Revenue (Million), by Country 2024 & 2032
- Figure 16: North America UAE Solar Energy Industry Volume (gigawatt), by Country 2024 & 2032
- Figure 17: North America UAE Solar Energy Industry Revenue Share (%), by Country 2024 & 2032
- Figure 18: North America UAE Solar Energy Industry Volume Share (%), by Country 2024 & 2032
- Figure 19: South America UAE Solar Energy Industry Revenue (Million), by Technology 2024 & 2032
- Figure 20: South America UAE Solar Energy Industry Volume (gigawatt), by Technology 2024 & 2032
- Figure 21: South America UAE Solar Energy Industry Revenue Share (%), by Technology 2024 & 2032
- Figure 22: South America UAE Solar Energy Industry Volume Share (%), by Technology 2024 & 2032
- Figure 23: South America UAE Solar Energy Industry Revenue (Million), by Deployment 2024 & 2032
- Figure 24: South America UAE Solar Energy Industry Volume (gigawatt), by Deployment 2024 & 2032
- Figure 25: South America UAE Solar Energy Industry Revenue Share (%), by Deployment 2024 & 2032
- Figure 26: South America UAE Solar Energy Industry Volume Share (%), by Deployment 2024 & 2032
- Figure 27: South America UAE Solar Energy Industry Revenue (Million), by Country 2024 & 2032
- Figure 28: South America UAE Solar Energy Industry Volume (gigawatt), by Country 2024 & 2032
- Figure 29: South America UAE Solar Energy Industry Revenue Share (%), by Country 2024 & 2032
- Figure 30: South America UAE Solar Energy Industry Volume Share (%), by Country 2024 & 2032
- Figure 31: Europe UAE Solar Energy Industry Revenue (Million), by Technology 2024 & 2032
- Figure 32: Europe UAE Solar Energy Industry Volume (gigawatt), by Technology 2024 & 2032
- Figure 33: Europe UAE Solar Energy Industry Revenue Share (%), by Technology 2024 & 2032
- Figure 34: Europe UAE Solar Energy Industry Volume Share (%), by Technology 2024 & 2032
- Figure 35: Europe UAE Solar Energy Industry Revenue (Million), by Deployment 2024 & 2032
- Figure 36: Europe UAE Solar Energy Industry Volume (gigawatt), by Deployment 2024 & 2032
- Figure 37: Europe UAE Solar Energy Industry Revenue Share (%), by Deployment 2024 & 2032
- Figure 38: Europe UAE Solar Energy Industry Volume Share (%), by Deployment 2024 & 2032
- Figure 39: Europe UAE Solar Energy Industry Revenue (Million), by Country 2024 & 2032
- Figure 40: Europe UAE Solar Energy Industry Volume (gigawatt), by Country 2024 & 2032
- Figure 41: Europe UAE Solar Energy Industry Revenue Share (%), by Country 2024 & 2032
- Figure 42: Europe UAE Solar Energy Industry Volume Share (%), by Country 2024 & 2032
- Figure 43: Middle East & Africa UAE Solar Energy Industry Revenue (Million), by Technology 2024 & 2032
- Figure 44: Middle East & Africa UAE Solar Energy Industry Volume (gigawatt), by Technology 2024 & 2032
- Figure 45: Middle East & Africa UAE Solar Energy Industry Revenue Share (%), by Technology 2024 & 2032
- Figure 46: Middle East & Africa UAE Solar Energy Industry Volume Share (%), by Technology 2024 & 2032
- Figure 47: Middle East & Africa UAE Solar Energy Industry Revenue (Million), by Deployment 2024 & 2032
- Figure 48: Middle East & Africa UAE Solar Energy Industry Volume (gigawatt), by Deployment 2024 & 2032
- Figure 49: Middle East & Africa UAE Solar Energy Industry Revenue Share (%), by Deployment 2024 & 2032
- Figure 50: Middle East & Africa UAE Solar Energy Industry Volume Share (%), by Deployment 2024 & 2032
- Figure 51: Middle East & Africa UAE Solar Energy Industry Revenue (Million), by Country 2024 & 2032
- Figure 52: Middle East & Africa UAE Solar Energy Industry Volume (gigawatt), by Country 2024 & 2032
- Figure 53: Middle East & Africa UAE Solar Energy Industry Revenue Share (%), by Country 2024 & 2032
- Figure 54: Middle East & Africa UAE Solar Energy Industry Volume Share (%), by Country 2024 & 2032
- Figure 55: Asia Pacific UAE Solar Energy Industry Revenue (Million), by Technology 2024 & 2032
- Figure 56: Asia Pacific UAE Solar Energy Industry Volume (gigawatt), by Technology 2024 & 2032
- Figure 57: Asia Pacific UAE Solar Energy Industry Revenue Share (%), by Technology 2024 & 2032
- Figure 58: Asia Pacific UAE Solar Energy Industry Volume Share (%), by Technology 2024 & 2032
- Figure 59: Asia Pacific UAE Solar Energy Industry Revenue (Million), by Deployment 2024 & 2032
- Figure 60: Asia Pacific UAE Solar Energy Industry Volume (gigawatt), by Deployment 2024 & 2032
- Figure 61: Asia Pacific UAE Solar Energy Industry Revenue Share (%), by Deployment 2024 & 2032
- Figure 62: Asia Pacific UAE Solar Energy Industry Volume Share (%), by Deployment 2024 & 2032
- Figure 63: Asia Pacific UAE Solar Energy Industry Revenue (Million), by Country 2024 & 2032
- Figure 64: Asia Pacific UAE Solar Energy Industry Volume (gigawatt), by Country 2024 & 2032
- Figure 65: Asia Pacific UAE Solar Energy Industry Revenue Share (%), by Country 2024 & 2032
- Figure 66: Asia Pacific UAE Solar Energy Industry Volume Share (%), by Country 2024 & 2032
List of Tables
- Table 1: Global UAE Solar Energy Industry Revenue Million Forecast, by Region 2019 & 2032
- Table 2: Global UAE Solar Energy Industry Volume gigawatt Forecast, by Region 2019 & 2032
- Table 3: Global UAE Solar Energy Industry Revenue Million Forecast, by Technology 2019 & 2032
- Table 4: Global UAE Solar Energy Industry Volume gigawatt Forecast, by Technology 2019 & 2032
- Table 5: Global UAE Solar Energy Industry Revenue Million Forecast, by Deployment 2019 & 2032
- Table 6: Global UAE Solar Energy Industry Volume gigawatt Forecast, by Deployment 2019 & 2032
- Table 7: Global UAE Solar Energy Industry Revenue Million Forecast, by Region 2019 & 2032
- Table 8: Global UAE Solar Energy Industry Volume gigawatt Forecast, by Region 2019 & 2032
- Table 9: Global UAE Solar Energy Industry Revenue Million Forecast, by Country 2019 & 2032
- Table 10: Global UAE Solar Energy Industry Volume gigawatt Forecast, by Country 2019 & 2032
- Table 11: Global UAE Solar Energy Industry Revenue Million Forecast, by Technology 2019 & 2032
- Table 12: Global UAE Solar Energy Industry Volume gigawatt Forecast, by Technology 2019 & 2032
- Table 13: Global UAE Solar Energy Industry Revenue Million Forecast, by Deployment 2019 & 2032
- Table 14: Global UAE Solar Energy Industry Volume gigawatt Forecast, by Deployment 2019 & 2032
- Table 15: Global UAE Solar Energy Industry Revenue Million Forecast, by Country 2019 & 2032
- Table 16: Global UAE Solar Energy Industry Volume gigawatt Forecast, by Country 2019 & 2032
- Table 17: United States UAE Solar Energy Industry Revenue (Million) Forecast, by Application 2019 & 2032
- Table 18: United States UAE Solar Energy Industry Volume (gigawatt) Forecast, by Application 2019 & 2032
- Table 19: Canada UAE Solar Energy Industry Revenue (Million) Forecast, by Application 2019 & 2032
- Table 20: Canada UAE Solar Energy Industry Volume (gigawatt) Forecast, by Application 2019 & 2032
- Table 21: Mexico UAE Solar Energy Industry Revenue (Million) Forecast, by Application 2019 & 2032
- Table 22: Mexico UAE Solar Energy Industry Volume (gigawatt) Forecast, by Application 2019 & 2032
- Table 23: Global UAE Solar Energy Industry Revenue Million Forecast, by Technology 2019 & 2032
- Table 24: Global UAE Solar Energy Industry Volume gigawatt Forecast, by Technology 2019 & 2032
- Table 25: Global UAE Solar Energy Industry Revenue Million Forecast, by Deployment 2019 & 2032
- Table 26: Global UAE Solar Energy Industry Volume gigawatt Forecast, by Deployment 2019 & 2032
- Table 27: Global UAE Solar Energy Industry Revenue Million Forecast, by Country 2019 & 2032
- Table 28: Global UAE Solar Energy Industry Volume gigawatt Forecast, by Country 2019 & 2032
- Table 29: Brazil UAE Solar Energy Industry Revenue (Million) Forecast, by Application 2019 & 2032
- Table 30: Brazil UAE Solar Energy Industry Volume (gigawatt) Forecast, by Application 2019 & 2032
- Table 31: Argentina UAE Solar Energy Industry Revenue (Million) Forecast, by Application 2019 & 2032
- Table 32: Argentina UAE Solar Energy Industry Volume (gigawatt) Forecast, by Application 2019 & 2032
- Table 33: Rest of South America UAE Solar Energy Industry Revenue (Million) Forecast, by Application 2019 & 2032
- Table 34: Rest of South America UAE Solar Energy Industry Volume (gigawatt) Forecast, by Application 2019 & 2032
- Table 35: Global UAE Solar Energy Industry Revenue Million Forecast, by Technology 2019 & 2032
- Table 36: Global UAE Solar Energy Industry Volume gigawatt Forecast, by Technology 2019 & 2032
- Table 37: Global UAE Solar Energy Industry Revenue Million Forecast, by Deployment 2019 & 2032
- Table 38: Global UAE Solar Energy Industry Volume gigawatt Forecast, by Deployment 2019 & 2032
- Table 39: Global UAE Solar Energy Industry Revenue Million Forecast, by Country 2019 & 2032
- Table 40: Global UAE Solar Energy Industry Volume gigawatt Forecast, by Country 2019 & 2032
- Table 41: United Kingdom UAE Solar Energy Industry Revenue (Million) Forecast, by Application 2019 & 2032
- Table 42: United Kingdom UAE Solar Energy Industry Volume (gigawatt) Forecast, by Application 2019 & 2032
- Table 43: Germany UAE Solar Energy Industry Revenue (Million) Forecast, by Application 2019 & 2032
- Table 44: Germany UAE Solar Energy Industry Volume (gigawatt) Forecast, by Application 2019 & 2032
- Table 45: France UAE Solar Energy Industry Revenue (Million) Forecast, by Application 2019 & 2032
- Table 46: France UAE Solar Energy Industry Volume (gigawatt) Forecast, by Application 2019 & 2032
- Table 47: Italy UAE Solar Energy Industry Revenue (Million) Forecast, by Application 2019 & 2032
- Table 48: Italy UAE Solar Energy Industry Volume (gigawatt) Forecast, by Application 2019 & 2032
- Table 49: Spain UAE Solar Energy Industry Revenue (Million) Forecast, by Application 2019 & 2032
- Table 50: Spain UAE Solar Energy Industry Volume (gigawatt) Forecast, by Application 2019 & 2032
- Table 51: Russia UAE Solar Energy Industry Revenue (Million) Forecast, by Application 2019 & 2032
- Table 52: Russia UAE Solar Energy Industry Volume (gigawatt) Forecast, by Application 2019 & 2032
- Table 53: Benelux UAE Solar Energy Industry Revenue (Million) Forecast, by Application 2019 & 2032
- Table 54: Benelux UAE Solar Energy Industry Volume (gigawatt) Forecast, by Application 2019 & 2032
- Table 55: Nordics UAE Solar Energy Industry Revenue (Million) Forecast, by Application 2019 & 2032
- Table 56: Nordics UAE Solar Energy Industry Volume (gigawatt) Forecast, by Application 2019 & 2032
- Table 57: Rest of Europe UAE Solar Energy Industry Revenue (Million) Forecast, by Application 2019 & 2032
- Table 58: Rest of Europe UAE Solar Energy Industry Volume (gigawatt) Forecast, by Application 2019 & 2032
- Table 59: Global UAE Solar Energy Industry Revenue Million Forecast, by Technology 2019 & 2032
- Table 60: Global UAE Solar Energy Industry Volume gigawatt Forecast, by Technology 2019 & 2032
- Table 61: Global UAE Solar Energy Industry Revenue Million Forecast, by Deployment 2019 & 2032
- Table 62: Global UAE Solar Energy Industry Volume gigawatt Forecast, by Deployment 2019 & 2032
- Table 63: Global UAE Solar Energy Industry Revenue Million Forecast, by Country 2019 & 2032
- Table 64: Global UAE Solar Energy Industry Volume gigawatt Forecast, by Country 2019 & 2032
- Table 65: Turkey UAE Solar Energy Industry Revenue (Million) Forecast, by Application 2019 & 2032
- Table 66: Turkey UAE Solar Energy Industry Volume (gigawatt) Forecast, by Application 2019 & 2032
- Table 67: Israel UAE Solar Energy Industry Revenue (Million) Forecast, by Application 2019 & 2032
- Table 68: Israel UAE Solar Energy Industry Volume (gigawatt) Forecast, by Application 2019 & 2032
- Table 69: GCC UAE Solar Energy Industry Revenue (Million) Forecast, by Application 2019 & 2032
- Table 70: GCC UAE Solar Energy Industry Volume (gigawatt) Forecast, by Application 2019 & 2032
- Table 71: North Africa UAE Solar Energy Industry Revenue (Million) Forecast, by Application 2019 & 2032
- Table 72: North Africa UAE Solar Energy Industry Volume (gigawatt) Forecast, by Application 2019 & 2032
- Table 73: South Africa UAE Solar Energy Industry Revenue (Million) Forecast, by Application 2019 & 2032
- Table 74: South Africa UAE Solar Energy Industry Volume (gigawatt) Forecast, by Application 2019 & 2032
- Table 75: Rest of Middle East & Africa UAE Solar Energy Industry Revenue (Million) Forecast, by Application 2019 & 2032
- Table 76: Rest of Middle East & Africa UAE Solar Energy Industry Volume (gigawatt) Forecast, by Application 2019 & 2032
- Table 77: Global UAE Solar Energy Industry Revenue Million Forecast, by Technology 2019 & 2032
- Table 78: Global UAE Solar Energy Industry Volume gigawatt Forecast, by Technology 2019 & 2032
- Table 79: Global UAE Solar Energy Industry Revenue Million Forecast, by Deployment 2019 & 2032
- Table 80: Global UAE Solar Energy Industry Volume gigawatt Forecast, by Deployment 2019 & 2032
- Table 81: Global UAE Solar Energy Industry Revenue Million Forecast, by Country 2019 & 2032
- Table 82: Global UAE Solar Energy Industry Volume gigawatt Forecast, by Country 2019 & 2032
- Table 83: China UAE Solar Energy Industry Revenue (Million) Forecast, by Application 2019 & 2032
- Table 84: China UAE Solar Energy Industry Volume (gigawatt) Forecast, by Application 2019 & 2032
- Table 85: India UAE Solar Energy Industry Revenue (Million) Forecast, by Application 2019 & 2032
- Table 86: India UAE Solar Energy Industry Volume (gigawatt) Forecast, by Application 2019 & 2032
- Table 87: Japan UAE Solar Energy Industry Revenue (Million) Forecast, by Application 2019 & 2032
- Table 88: Japan UAE Solar Energy Industry Volume (gigawatt) Forecast, by Application 2019 & 2032
- Table 89: South Korea UAE Solar Energy Industry Revenue (Million) Forecast, by Application 2019 & 2032
- Table 90: South Korea UAE Solar Energy Industry Volume (gigawatt) Forecast, by Application 2019 & 2032
- Table 91: ASEAN UAE Solar Energy Industry Revenue (Million) Forecast, by Application 2019 & 2032
- Table 92: ASEAN UAE Solar Energy Industry Volume (gigawatt) Forecast, by Application 2019 & 2032
- Table 93: Oceania UAE Solar Energy Industry Revenue (Million) Forecast, by Application 2019 & 2032
- Table 94: Oceania UAE Solar Energy Industry Volume (gigawatt) Forecast, by Application 2019 & 2032
- Table 95: Rest of Asia Pacific UAE Solar Energy Industry Revenue (Million) Forecast, by Application 2019 & 2032
- Table 96: Rest of Asia Pacific UAE Solar Energy Industry Volume (gigawatt) Forecast, by Application 2019 & 2032
Frequently Asked Questions
1. What is the projected Compound Annual Growth Rate (CAGR) of the UAE Solar Energy Industry?
The projected CAGR is approximately 35.48%.
2. Which companies are prominent players in the UAE Solar Energy Industry?
Key companies in the market include JinkoSolar Holding Co Ltd, Sunergy Solar, CleanMax Mena FZCO*List Not Exhaustive, Canadian Solar Inc, City Solar, Masdar (Abu Dhabi Future Energy Company), MAYSUN SOLAR FZCO, Enerwhere, ACWA Power.
3. What are the main segments of the UAE Solar Energy Industry?
The market segments include Technology, Deployment.
4. Can you provide details about the market size?
The market size is estimated to be USD XX Million as of 2022.
5. What are some drivers contributing to market growth?
4.; Rising Government Policies to Support Solar PV Installation4.; Rising Installation of Renewable Energy to Reduce Dependency on Fossil Fuels.
6. What are the notable trends driving market growth?
Solar Photovoltaic to Dominate the Market.
7. Are there any restraints impacting market growth?
4.; Rising Adoption of Alternative Clean Energy Sources such as Wind. Geothermal. Bioenergy. and Others.
8. Can you provide examples of recent developments in the market?
May 2023: ADNOC Distribution announced a key partnership with Emerge, a joint venture between EDF and Masdar, to develop on-site solar power across its service station network. The project will commence in Dubai in 2023 to generate clean energy.
9. What pricing options are available for accessing the report?
Pricing options include single-user, multi-user, and enterprise licenses priced at USD 3800, USD 4500, and USD 5800 respectively.
10. Is the market size provided in terms of value or volume?
The market size is provided in terms of value, measured in Million and volume, measured in gigawatt.
11. Are there any specific market keywords associated with the report?
Yes, the market keyword associated with the report is "UAE Solar Energy Industry," which aids in identifying and referencing the specific market segment covered.
12. How do I determine which pricing option suits my needs best?
The pricing options vary based on user requirements and access needs. Individual users may opt for single-user licenses, while businesses requiring broader access may choose multi-user or enterprise licenses for cost-effective access to the report.
13. Are there any additional resources or data provided in the UAE Solar Energy Industry report?
While the report offers comprehensive insights, it's advisable to review the specific contents or supplementary materials provided to ascertain if additional resources or data are available.
14. How can I stay updated on further developments or reports in the UAE Solar Energy Industry?
To stay informed about further developments, trends, and reports in the UAE Solar Energy Industry, consider subscribing to industry newsletters, following relevant companies and organizations, or regularly checking reputable industry news sources and publications.
Methodology
Step 1 - Identification of Relevant Samples Size from Population Database


Step 2 - Approaches for Defining Global Market Size (Value, Volume* & Price*)

Note*: In applicable scenarios
Step 3 - Data Sources
Primary Research
- Web Analytics
- Survey Reports
- Research Institute
- Latest Research Reports
- Opinion Leaders
Secondary Research
- Annual Reports
- White Paper
- Latest Press Release
- Industry Association
- Paid Database
- Investor Presentations

Step 4 - Data Triangulation
Involves using different sources of information in order to increase the validity of a study
These sources are likely to be stakeholders in a program - participants, other researchers, program staff, other community members, and so on.
Then we put all data in single framework & apply various statistical tools to find out the dynamic on the market.
During the analysis stage, feedback from the stakeholder groups would be compared to determine areas of agreement as well as areas of divergence
