

Key Insights
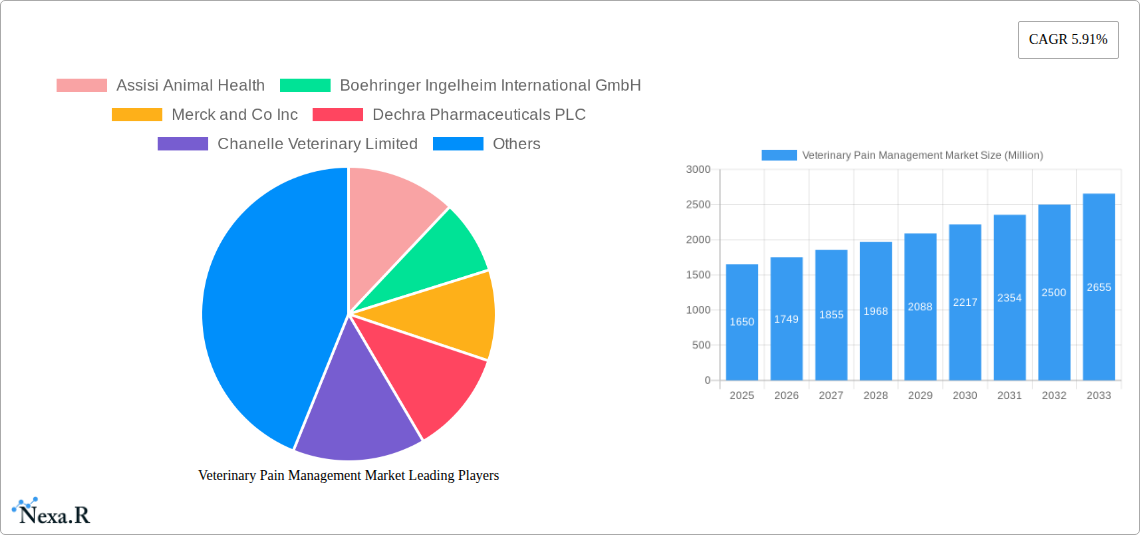
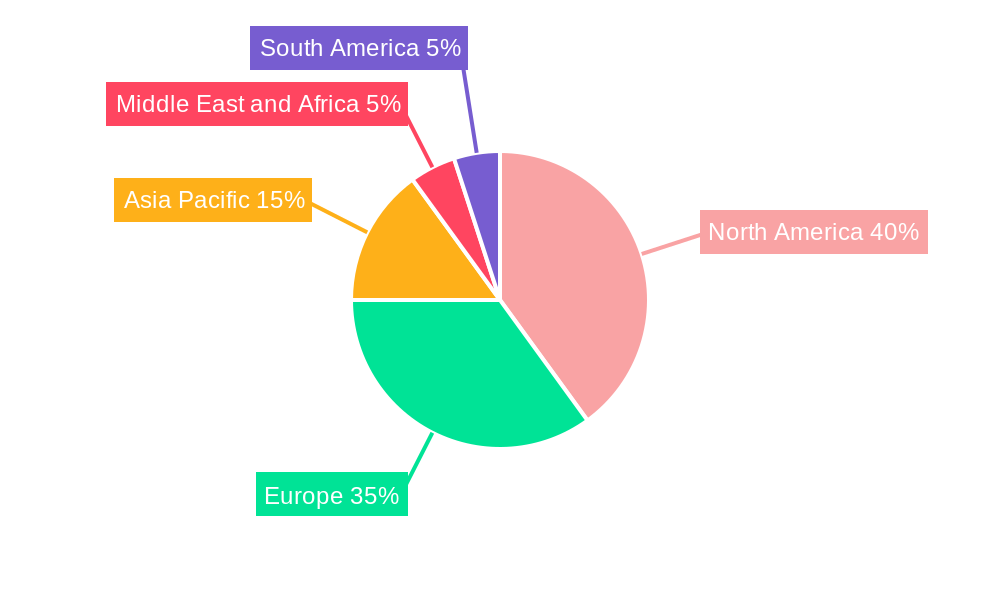
The global veterinary pain management market, valued at $1.65 billion in 2025, is projected to experience robust growth, driven by increasing pet ownership, rising awareness of animal welfare, and advancements in pain management techniques. The market's Compound Annual Growth Rate (CAGR) of 5.91% from 2019 to 2024 indicates a steady expansion, expected to continue through 2033. Key growth drivers include the increasing prevalence of osteoarthritis and joint pain in aging companion animals, a growing demand for effective postoperative pain management, and the expanding use of pain management in livestock to improve productivity and welfare. The market is segmented by animal type (companion animals, livestock), application (osteoarthritis, postoperative pain, cancer, other), product type (drugs, devices), and end-user (hospitals, clinics, retail outlets). The increasing availability of advanced analgesics and the development of novel drug delivery systems contribute to market expansion. However, high costs associated with advanced therapies and potential side effects of certain pain medications present challenges to market growth. Regionally, North America and Europe currently hold significant market shares due to established veterinary infrastructure and high pet ownership rates, but the Asia-Pacific region is expected to demonstrate significant growth in the coming years, fueled by rising pet ownership and increasing veterinary care expenditure. Competition is intense, with major players like Zoetis, Elanco, Boehringer Ingelheim, and Merck & Co. actively engaged in developing and marketing innovative pain management solutions.
The future of the veterinary pain management market looks promising, with continuous innovation in drug development and device technology expected to further fuel market growth. The increasing emphasis on providing optimal pain relief for animals across various species and applications will drive demand. The market will likely see further consolidation, with mergers and acquisitions among existing players reshaping the competitive landscape. Strategic partnerships between pharmaceutical companies and veterinary clinics are also anticipated, enhancing market penetration and improving access to advanced pain management solutions for veterinarians and animal owners. Regulatory approvals for new products and the expansion of veterinary pain management services in developing economies will significantly impact the overall market trajectory during the forecast period (2025-2033).
Veterinary Pain Management Market: A Comprehensive Report (2019-2033)
This comprehensive report provides a detailed analysis of the Veterinary Pain Management Market, encompassing market dynamics, growth trends, regional segmentation, product landscape, key players, and future outlook. The study covers the period from 2019 to 2033, with a focus on the forecast period from 2025 to 2033. The base year for the report is 2025, and all values are presented in million units. This report is designed for veterinary professionals, pharmaceutical companies, investors, and market researchers seeking insights into this growing market. Parent markets include the broader animal health and pharmaceuticals sectors, while child markets include specific animal types (companion animals, livestock) and applications (post-operative pain, osteoarthritis).
Veterinary Pain Management Market Market Dynamics & Structure
The veterinary pain management market is characterized by moderate concentration, with a few major players holding significant market share, while numerous smaller companies compete in niche segments. Technological innovation, particularly in non-opioid analgesics and minimally invasive procedures, is a key driver. Stringent regulatory frameworks, varying across countries, impact market entry and product approval. The market experiences competitive pressure from alternative therapies and pain management techniques. End-user demographics, largely driven by increasing pet ownership and the aging pet population, are significant factors. Mergers and acquisitions (M&A) activity within the industry has been relatively steady, contributing to market consolidation.
- Market Concentration: Moderately concentrated, with top 5 players holding xx% market share in 2025.
- Technological Innovation: Driven by development of non-opioid analgesics, advanced imaging techniques, and minimally invasive surgical procedures. Innovation barriers include high R&D costs and rigorous regulatory approvals.
- Regulatory Frameworks: Vary significantly across countries, impacting market entry and pricing strategies. FDA and EMA approvals are crucial for global market penetration.
- Competitive Substitutes: Alternative therapies such as acupuncture, physiotherapy, and herbal remedies pose competitive pressure.
- End-User Demographics: Growing pet ownership and an aging pet population drive market growth, particularly in the companion animal segment.
- M&A Trends: Steady M&A activity, with an estimated xx number of deals in the last five years, leading to consolidation and increased market share for larger companies.
Veterinary Pain Management Market Growth Trends & Insights
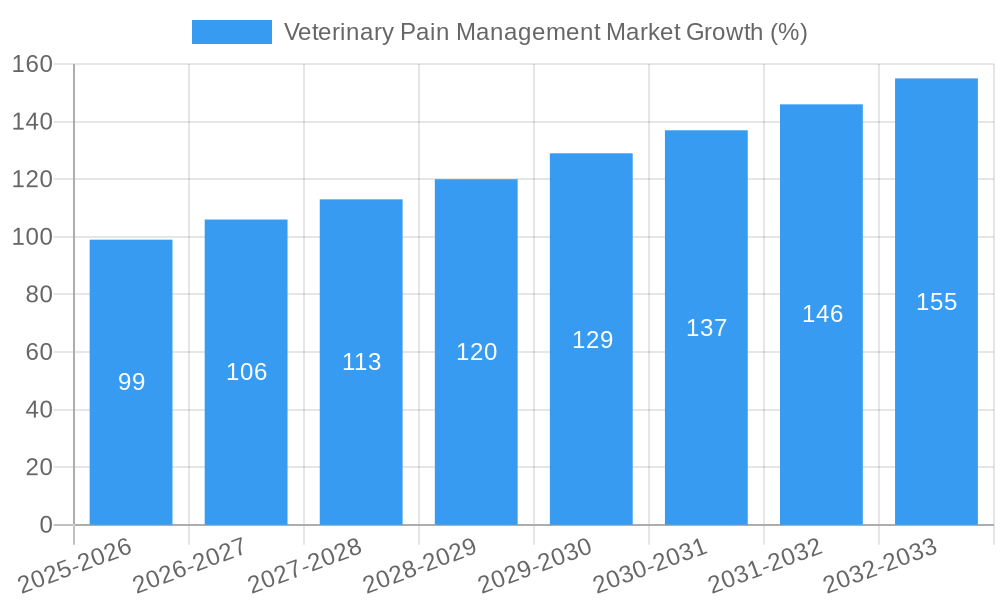
The veterinary pain management market is experiencing robust growth, driven by several factors including increasing pet ownership, rising awareness of animal welfare, and technological advancements in pain management therapies. Market size is projected to reach xx million units by 2033, exhibiting a CAGR of xx% during the forecast period. This growth is significantly driven by higher adoption rates of advanced pain management solutions in both companion animals and livestock. Technological disruptions, such as the introduction of novel drug formulations and sophisticated diagnostic tools, are accelerating market expansion. Changing consumer behavior, characterized by increased willingness to invest in advanced pain management for pets, also supports market growth.
(Note: The above paragraph uses the placeholder "XXX" in place of the specific data and analysis that would be included in the full report.)
Dominant Regions, Countries, or Segments in Veterinary Pain Management Market
North America currently dominates the veterinary pain management market, driven by high pet ownership rates, advanced healthcare infrastructure, and strong regulatory support. Within this region, the United States holds the largest market share, followed by Canada. Europe is the second-largest market, with Germany and the UK leading the way. Significant growth potential exists in the Asia-Pacific region, fueled by expanding pet ownership and increasing disposable incomes.
Leading Segments:
- Application: Osteoarthritis and joint pain represent the largest segment due to the high prevalence of these conditions in companion animals.
- Animal Type: Companion animals (dogs and cats) dominate the market due to higher pet ownership and willingness to spend on pet healthcare.
- Product: Drugs currently hold the largest market share, but devices are expected to witness strong growth in the coming years.
- End User: Hospitals and clinics are the dominant end-user segment, followed by retail outlets.
Key Drivers:
- High Pet Ownership Rates: Particularly in North America and Europe.
- Increased Awareness of Animal Welfare: Driving demand for advanced pain management solutions.
- Technological Advancements: Development of novel drug formulations and advanced diagnostic tools.
- Favorable Regulatory Environment: Facilitating market entry and product approvals.
Veterinary Pain Management Market Product Landscape
The veterinary pain management market offers a diverse product portfolio, including various drug formulations (NSAIDs, opioids, gabapentinoids) and medical devices (lasers, therapeutic ultrasound). Innovations focus on developing safer, more effective, and targeted pain management options. Unique selling propositions include improved efficacy, reduced side effects, and convenient administration routes. Technological advancements in drug delivery systems and diagnostic imaging contribute to improved patient outcomes.
Key Drivers, Barriers & Challenges in Veterinary Pain Management Market
Key Drivers:
- Rising pet ownership and increasing pet humanization.
- Growing awareness of animal welfare and pain management.
- Technological innovations in pain management therapies.
- Increasing investment in veterinary research and development.
Key Challenges and Restraints:
- High cost of advanced pain management therapies, limiting access for some pet owners.
- Stringent regulatory approvals for new drug formulations and devices.
- Limited availability of trained veterinary professionals specializing in pain management.
- Competition from alternative and complementary therapies.
Emerging Opportunities in Veterinary Pain Management Market
- Expanding into emerging markets with rising pet ownership (e.g., Asia-Pacific).
- Developing personalized pain management approaches based on individual animal needs.
- Leveraging telemedicine and remote monitoring for improved pain management outcomes.
- Exploring novel drug targets and innovative drug delivery systems.
Growth Accelerators in the Veterinary Pain Management Market Industry
Technological advancements, particularly in non-opioid pain management drugs and minimally invasive surgical techniques, will be a major growth catalyst. Strategic partnerships between pharmaceutical companies and veterinary clinics will further accelerate market growth by improving access to advanced pain management therapies. Expanding into underserved regions and promoting better awareness of the importance of animal pain management will also contribute to long-term growth.
Key Players Shaping the Veterinary Pain Management Market Market
- Assisi Animal Health
- Boehringer Ingelheim International GmbH
- Merck and Co Inc
- Dechra Pharmaceuticals PLC
- Chanelle Veterinary Limited
- Vetoquinol SA
- Norbrook
- Eltech K-Laser SRL
- Ceva Sante Animale
- Elanco Animal Health Incorporated
- Zoetis Inc
Notable Milestones in Veterinary Pain Management Market Sector
- September 2022: Zoetis launched Solensia to manage feline osteoarthritis pain in the United States, expanding treatment options for a significant pet population.
- April 2022: FDA approval of medetomidine and vatinoxan hydrochlorides injection as a sedative and analgesic for dogs undergoing clinical examinations and minor surgical procedures broadened available options for veterinary practitioners.
In-Depth Veterinary Pain Management Market Market Outlook
The veterinary pain management market is poised for continued growth, driven by innovation, increasing pet ownership, and a greater understanding of animal welfare. Strategic opportunities lie in developing targeted therapies for specific conditions, expanding into emerging markets, and leveraging technological advancements to improve pain management outcomes. The market is expected to witness further consolidation through M&A activity, leading to increased competition and the introduction of innovative products.
Veterinary Pain Management Market Segmentation
-
1. Product
-
1.1. Drugs
- 1.1.1. NSAIDs
- 1.1.2. Anesthetics
- 1.1.3. Opioids
- 1.1.4. Other Drugs
-
1.2. Devices
- 1.2.1. Laser Therapy
- 1.2.2. Electromagnetic Therapy
-
1.1. Drugs
-
2. Application
- 2.1. Osteoarthritis and Joint Pain
- 2.2. Postoperative Pain
- 2.3. Cancer
- 2.4. Other Applications
-
3. Animal Type
- 3.1. Companion
- 3.2. Livestock
-
4. End User
- 4.1. Hospitals and Clinics
- 4.2. Retail Outlet and Others
Veterinary Pain Management Market Segmentation By Geography
-
1. North America
- 1.1. United States
- 1.2. Canada
- 1.3. Mexico
-
2. Europe
- 2.1. Germany
- 2.2. United Kingdom
- 2.3. France
- 2.4. Italy
- 2.5. Spain
- 2.6. Rest of Europe
-
3. Asia Pacific
- 3.1. China
- 3.2. Japan
- 3.3. India
- 3.4. Australia
- 3.5. South Korea
- 3.6. Rest of Asia Pacific
-
4. Middle East and Africa
- 4.1. GCC
- 4.2. South Africa
- 4.3. Rest of Middle East and Africa
-
5. South America
- 5.1. Brazil
- 5.2. Argentina
- 5.3. Rest of South America
Veterinary Pain Management Market REPORT HIGHLIGHTS
| Aspects | Details |
|---|---|
| Study Period | 2019-2033 |
| Base Year | 2024 |
| Estimated Year | 2025 |
| Forecast Period | 2025-2033 |
| Historical Period | 2019-2024 |
| Growth Rate | CAGR of 5.91% from 2019-2033 |
| Segmentation |
|
Table of Contents
- 1. Introduction
- 1.1. Research Scope
- 1.2. Market Segmentation
- 1.3. Research Methodology
- 1.4. Definitions and Assumptions
- 2. Executive Summary
- 2.1. Introduction
- 3. Market Dynamics
- 3.1. Introduction
- 3.2. Market Drivers
- 3.2.1. Growth in Prevalence of Painful and Inflammatory Diseases in Animals; Rise in Need for Easily Accessible and Affordable Treatment Options; Increase in Awareness about Animal Health and Welfare
- 3.3. Market Restrains
- 3.3.1. Side Effects Associated With Treatment and High Cost of Certain Products
- 3.4. Market Trends
- 3.4.1. Laser Therapy is Expected to Witness Considerable Growth Over the Forecast Period
- 4. Market Factor Analysis
- 4.1. Porters Five Forces
- 4.2. Supply/Value Chain
- 4.3. PESTEL analysis
- 4.4. Market Entropy
- 4.5. Patent/Trademark Analysis
- 5. Global Veterinary Pain Management Market Analysis, Insights and Forecast, 2019-2031
- 5.1. Market Analysis, Insights and Forecast - by Product
- 5.1.1. Drugs
- 5.1.1.1. NSAIDs
- 5.1.1.2. Anesthetics
- 5.1.1.3. Opioids
- 5.1.1.4. Other Drugs
- 5.1.2. Devices
- 5.1.2.1. Laser Therapy
- 5.1.2.2. Electromagnetic Therapy
- 5.1.1. Drugs
- 5.2. Market Analysis, Insights and Forecast - by Application
- 5.2.1. Osteoarthritis and Joint Pain
- 5.2.2. Postoperative Pain
- 5.2.3. Cancer
- 5.2.4. Other Applications
- 5.3. Market Analysis, Insights and Forecast - by Animal Type
- 5.3.1. Companion
- 5.3.2. Livestock
- 5.4. Market Analysis, Insights and Forecast - by End User
- 5.4.1. Hospitals and Clinics
- 5.4.2. Retail Outlet and Others
- 5.5. Market Analysis, Insights and Forecast - by Region
- 5.5.1. North America
- 5.5.2. Europe
- 5.5.3. Asia Pacific
- 5.5.4. Middle East and Africa
- 5.5.5. South America
- 5.1. Market Analysis, Insights and Forecast - by Product
- 6. North America Veterinary Pain Management Market Analysis, Insights and Forecast, 2019-2031
- 6.1. Market Analysis, Insights and Forecast - by Product
- 6.1.1. Drugs
- 6.1.1.1. NSAIDs
- 6.1.1.2. Anesthetics
- 6.1.1.3. Opioids
- 6.1.1.4. Other Drugs
- 6.1.2. Devices
- 6.1.2.1. Laser Therapy
- 6.1.2.2. Electromagnetic Therapy
- 6.1.1. Drugs
- 6.2. Market Analysis, Insights and Forecast - by Application
- 6.2.1. Osteoarthritis and Joint Pain
- 6.2.2. Postoperative Pain
- 6.2.3. Cancer
- 6.2.4. Other Applications
- 6.3. Market Analysis, Insights and Forecast - by Animal Type
- 6.3.1. Companion
- 6.3.2. Livestock
- 6.4. Market Analysis, Insights and Forecast - by End User
- 6.4.1. Hospitals and Clinics
- 6.4.2. Retail Outlet and Others
- 6.1. Market Analysis, Insights and Forecast - by Product
- 7. Europe Veterinary Pain Management Market Analysis, Insights and Forecast, 2019-2031
- 7.1. Market Analysis, Insights and Forecast - by Product
- 7.1.1. Drugs
- 7.1.1.1. NSAIDs
- 7.1.1.2. Anesthetics
- 7.1.1.3. Opioids
- 7.1.1.4. Other Drugs
- 7.1.2. Devices
- 7.1.2.1. Laser Therapy
- 7.1.2.2. Electromagnetic Therapy
- 7.1.1. Drugs
- 7.2. Market Analysis, Insights and Forecast - by Application
- 7.2.1. Osteoarthritis and Joint Pain
- 7.2.2. Postoperative Pain
- 7.2.3. Cancer
- 7.2.4. Other Applications
- 7.3. Market Analysis, Insights and Forecast - by Animal Type
- 7.3.1. Companion
- 7.3.2. Livestock
- 7.4. Market Analysis, Insights and Forecast - by End User
- 7.4.1. Hospitals and Clinics
- 7.4.2. Retail Outlet and Others
- 7.1. Market Analysis, Insights and Forecast - by Product
- 8. Asia Pacific Veterinary Pain Management Market Analysis, Insights and Forecast, 2019-2031
- 8.1. Market Analysis, Insights and Forecast - by Product
- 8.1.1. Drugs
- 8.1.1.1. NSAIDs
- 8.1.1.2. Anesthetics
- 8.1.1.3. Opioids
- 8.1.1.4. Other Drugs
- 8.1.2. Devices
- 8.1.2.1. Laser Therapy
- 8.1.2.2. Electromagnetic Therapy
- 8.1.1. Drugs
- 8.2. Market Analysis, Insights and Forecast - by Application
- 8.2.1. Osteoarthritis and Joint Pain
- 8.2.2. Postoperative Pain
- 8.2.3. Cancer
- 8.2.4. Other Applications
- 8.3. Market Analysis, Insights and Forecast - by Animal Type
- 8.3.1. Companion
- 8.3.2. Livestock
- 8.4. Market Analysis, Insights and Forecast - by End User
- 8.4.1. Hospitals and Clinics
- 8.4.2. Retail Outlet and Others
- 8.1. Market Analysis, Insights and Forecast - by Product
- 9. Middle East and Africa Veterinary Pain Management Market Analysis, Insights and Forecast, 2019-2031
- 9.1. Market Analysis, Insights and Forecast - by Product
- 9.1.1. Drugs
- 9.1.1.1. NSAIDs
- 9.1.1.2. Anesthetics
- 9.1.1.3. Opioids
- 9.1.1.4. Other Drugs
- 9.1.2. Devices
- 9.1.2.1. Laser Therapy
- 9.1.2.2. Electromagnetic Therapy
- 9.1.1. Drugs
- 9.2. Market Analysis, Insights and Forecast - by Application
- 9.2.1. Osteoarthritis and Joint Pain
- 9.2.2. Postoperative Pain
- 9.2.3. Cancer
- 9.2.4. Other Applications
- 9.3. Market Analysis, Insights and Forecast - by Animal Type
- 9.3.1. Companion
- 9.3.2. Livestock
- 9.4. Market Analysis, Insights and Forecast - by End User
- 9.4.1. Hospitals and Clinics
- 9.4.2. Retail Outlet and Others
- 9.1. Market Analysis, Insights and Forecast - by Product
- 10. South America Veterinary Pain Management Market Analysis, Insights and Forecast, 2019-2031
- 10.1. Market Analysis, Insights and Forecast - by Product
- 10.1.1. Drugs
- 10.1.1.1. NSAIDs
- 10.1.1.2. Anesthetics
- 10.1.1.3. Opioids
- 10.1.1.4. Other Drugs
- 10.1.2. Devices
- 10.1.2.1. Laser Therapy
- 10.1.2.2. Electromagnetic Therapy
- 10.1.1. Drugs
- 10.2. Market Analysis, Insights and Forecast - by Application
- 10.2.1. Osteoarthritis and Joint Pain
- 10.2.2. Postoperative Pain
- 10.2.3. Cancer
- 10.2.4. Other Applications
- 10.3. Market Analysis, Insights and Forecast - by Animal Type
- 10.3.1. Companion
- 10.3.2. Livestock
- 10.4. Market Analysis, Insights and Forecast - by End User
- 10.4.1. Hospitals and Clinics
- 10.4.2. Retail Outlet and Others
- 10.1. Market Analysis, Insights and Forecast - by Product
- 11. North America Veterinary Pain Management Market Analysis, Insights and Forecast, 2019-2031
- 11.1. Market Analysis, Insights and Forecast - By Country/Sub-region
- 11.1.1. undefined
- 12. Europe Veterinary Pain Management Market Analysis, Insights and Forecast, 2019-2031
- 12.1. Market Analysis, Insights and Forecast - By Country/Sub-region
- 12.1.1. undefined
- 13. Asia Pacific Veterinary Pain Management Market Analysis, Insights and Forecast, 2019-2031
- 13.1. Market Analysis, Insights and Forecast - By Country/Sub-region
- 13.1.1. undefined
- 14. Middle East and Africa Veterinary Pain Management Market Analysis, Insights and Forecast, 2019-2031
- 14.1. Market Analysis, Insights and Forecast - By Country/Sub-region
- 14.1.1. undefined
- 15. South America Veterinary Pain Management Market Analysis, Insights and Forecast, 2019-2031
- 15.1. Market Analysis, Insights and Forecast - By Country/Sub-region
- 15.1.1. undefined
- 16. Competitive Analysis
- 16.1. Global Market Share Analysis 2024
- 16.2. Company Profiles
- 16.2.1 Assisi Animal Health
- 16.2.1.1. Overview
- 16.2.1.2. Products
- 16.2.1.3. SWOT Analysis
- 16.2.1.4. Recent Developments
- 16.2.1.5. Financials (Based on Availability)
- 16.2.2 Boehringer Ingelheim International GmbH
- 16.2.2.1. Overview
- 16.2.2.2. Products
- 16.2.2.3. SWOT Analysis
- 16.2.2.4. Recent Developments
- 16.2.2.5. Financials (Based on Availability)
- 16.2.3 Merck and Co Inc
- 16.2.3.1. Overview
- 16.2.3.2. Products
- 16.2.3.3. SWOT Analysis
- 16.2.3.4. Recent Developments
- 16.2.3.5. Financials (Based on Availability)
- 16.2.4 Dechra Pharmaceuticals PLC
- 16.2.4.1. Overview
- 16.2.4.2. Products
- 16.2.4.3. SWOT Analysis
- 16.2.4.4. Recent Developments
- 16.2.4.5. Financials (Based on Availability)
- 16.2.5 Chanelle Veterinary Limited
- 16.2.5.1. Overview
- 16.2.5.2. Products
- 16.2.5.3. SWOT Analysis
- 16.2.5.4. Recent Developments
- 16.2.5.5. Financials (Based on Availability)
- 16.2.6 VetoquinolSA
- 16.2.6.1. Overview
- 16.2.6.2. Products
- 16.2.6.3. SWOT Analysis
- 16.2.6.4. Recent Developments
- 16.2.6.5. Financials (Based on Availability)
- 16.2.7 Norbrook
- 16.2.7.1. Overview
- 16.2.7.2. Products
- 16.2.7.3. SWOT Analysis
- 16.2.7.4. Recent Developments
- 16.2.7.5. Financials (Based on Availability)
- 16.2.8 Eltech K-Laser SRL
- 16.2.8.1. Overview
- 16.2.8.2. Products
- 16.2.8.3. SWOT Analysis
- 16.2.8.4. Recent Developments
- 16.2.8.5. Financials (Based on Availability)
- 16.2.9 Ceva Sante Animale
- 16.2.9.1. Overview
- 16.2.9.2. Products
- 16.2.9.3. SWOT Analysis
- 16.2.9.4. Recent Developments
- 16.2.9.5. Financials (Based on Availability)
- 16.2.10 Elanco Animal Health Incorporated
- 16.2.10.1. Overview
- 16.2.10.2. Products
- 16.2.10.3. SWOT Analysis
- 16.2.10.4. Recent Developments
- 16.2.10.5. Financials (Based on Availability)
- 16.2.11 Zoetis Inc
- 16.2.11.1. Overview
- 16.2.11.2. Products
- 16.2.11.3. SWOT Analysis
- 16.2.11.4. Recent Developments
- 16.2.11.5. Financials (Based on Availability)
- 16.2.1 Assisi Animal Health
List of Figures
- Figure 1: Global Veterinary Pain Management Market Revenue Breakdown (Million, %) by Region 2024 & 2032
- Figure 2: Global Veterinary Pain Management Market Volume Breakdown (K Unit, %) by Region 2024 & 2032
- Figure 3: North America Veterinary Pain Management Market Revenue (Million), by Country 2024 & 2032
- Figure 4: North America Veterinary Pain Management Market Volume (K Unit), by Country 2024 & 2032
- Figure 5: North America Veterinary Pain Management Market Revenue Share (%), by Country 2024 & 2032
- Figure 6: North America Veterinary Pain Management Market Volume Share (%), by Country 2024 & 2032
- Figure 7: Europe Veterinary Pain Management Market Revenue (Million), by Country 2024 & 2032
- Figure 8: Europe Veterinary Pain Management Market Volume (K Unit), by Country 2024 & 2032
- Figure 9: Europe Veterinary Pain Management Market Revenue Share (%), by Country 2024 & 2032
- Figure 10: Europe Veterinary Pain Management Market Volume Share (%), by Country 2024 & 2032
- Figure 11: Asia Pacific Veterinary Pain Management Market Revenue (Million), by Country 2024 & 2032
- Figure 12: Asia Pacific Veterinary Pain Management Market Volume (K Unit), by Country 2024 & 2032
- Figure 13: Asia Pacific Veterinary Pain Management Market Revenue Share (%), by Country 2024 & 2032
- Figure 14: Asia Pacific Veterinary Pain Management Market Volume Share (%), by Country 2024 & 2032
- Figure 15: Middle East and Africa Veterinary Pain Management Market Revenue (Million), by Country 2024 & 2032
- Figure 16: Middle East and Africa Veterinary Pain Management Market Volume (K Unit), by Country 2024 & 2032
- Figure 17: Middle East and Africa Veterinary Pain Management Market Revenue Share (%), by Country 2024 & 2032
- Figure 18: Middle East and Africa Veterinary Pain Management Market Volume Share (%), by Country 2024 & 2032
- Figure 19: South America Veterinary Pain Management Market Revenue (Million), by Country 2024 & 2032
- Figure 20: South America Veterinary Pain Management Market Volume (K Unit), by Country 2024 & 2032
- Figure 21: South America Veterinary Pain Management Market Revenue Share (%), by Country 2024 & 2032
- Figure 22: South America Veterinary Pain Management Market Volume Share (%), by Country 2024 & 2032
- Figure 23: North America Veterinary Pain Management Market Revenue (Million), by Product 2024 & 2032
- Figure 24: North America Veterinary Pain Management Market Volume (K Unit), by Product 2024 & 2032
- Figure 25: North America Veterinary Pain Management Market Revenue Share (%), by Product 2024 & 2032
- Figure 26: North America Veterinary Pain Management Market Volume Share (%), by Product 2024 & 2032
- Figure 27: North America Veterinary Pain Management Market Revenue (Million), by Application 2024 & 2032
- Figure 28: North America Veterinary Pain Management Market Volume (K Unit), by Application 2024 & 2032
- Figure 29: North America Veterinary Pain Management Market Revenue Share (%), by Application 2024 & 2032
- Figure 30: North America Veterinary Pain Management Market Volume Share (%), by Application 2024 & 2032
- Figure 31: North America Veterinary Pain Management Market Revenue (Million), by Animal Type 2024 & 2032
- Figure 32: North America Veterinary Pain Management Market Volume (K Unit), by Animal Type 2024 & 2032
- Figure 33: North America Veterinary Pain Management Market Revenue Share (%), by Animal Type 2024 & 2032
- Figure 34: North America Veterinary Pain Management Market Volume Share (%), by Animal Type 2024 & 2032
- Figure 35: North America Veterinary Pain Management Market Revenue (Million), by End User 2024 & 2032
- Figure 36: North America Veterinary Pain Management Market Volume (K Unit), by End User 2024 & 2032
- Figure 37: North America Veterinary Pain Management Market Revenue Share (%), by End User 2024 & 2032
- Figure 38: North America Veterinary Pain Management Market Volume Share (%), by End User 2024 & 2032
- Figure 39: North America Veterinary Pain Management Market Revenue (Million), by Country 2024 & 2032
- Figure 40: North America Veterinary Pain Management Market Volume (K Unit), by Country 2024 & 2032
- Figure 41: North America Veterinary Pain Management Market Revenue Share (%), by Country 2024 & 2032
- Figure 42: North America Veterinary Pain Management Market Volume Share (%), by Country 2024 & 2032
- Figure 43: Europe Veterinary Pain Management Market Revenue (Million), by Product 2024 & 2032
- Figure 44: Europe Veterinary Pain Management Market Volume (K Unit), by Product 2024 & 2032
- Figure 45: Europe Veterinary Pain Management Market Revenue Share (%), by Product 2024 & 2032
- Figure 46: Europe Veterinary Pain Management Market Volume Share (%), by Product 2024 & 2032
- Figure 47: Europe Veterinary Pain Management Market Revenue (Million), by Application 2024 & 2032
- Figure 48: Europe Veterinary Pain Management Market Volume (K Unit), by Application 2024 & 2032
- Figure 49: Europe Veterinary Pain Management Market Revenue Share (%), by Application 2024 & 2032
- Figure 50: Europe Veterinary Pain Management Market Volume Share (%), by Application 2024 & 2032
- Figure 51: Europe Veterinary Pain Management Market Revenue (Million), by Animal Type 2024 & 2032
- Figure 52: Europe Veterinary Pain Management Market Volume (K Unit), by Animal Type 2024 & 2032
- Figure 53: Europe Veterinary Pain Management Market Revenue Share (%), by Animal Type 2024 & 2032
- Figure 54: Europe Veterinary Pain Management Market Volume Share (%), by Animal Type 2024 & 2032
- Figure 55: Europe Veterinary Pain Management Market Revenue (Million), by End User 2024 & 2032
- Figure 56: Europe Veterinary Pain Management Market Volume (K Unit), by End User 2024 & 2032
- Figure 57: Europe Veterinary Pain Management Market Revenue Share (%), by End User 2024 & 2032
- Figure 58: Europe Veterinary Pain Management Market Volume Share (%), by End User 2024 & 2032
- Figure 59: Europe Veterinary Pain Management Market Revenue (Million), by Country 2024 & 2032
- Figure 60: Europe Veterinary Pain Management Market Volume (K Unit), by Country 2024 & 2032
- Figure 61: Europe Veterinary Pain Management Market Revenue Share (%), by Country 2024 & 2032
- Figure 62: Europe Veterinary Pain Management Market Volume Share (%), by Country 2024 & 2032
- Figure 63: Asia Pacific Veterinary Pain Management Market Revenue (Million), by Product 2024 & 2032
- Figure 64: Asia Pacific Veterinary Pain Management Market Volume (K Unit), by Product 2024 & 2032
- Figure 65: Asia Pacific Veterinary Pain Management Market Revenue Share (%), by Product 2024 & 2032
- Figure 66: Asia Pacific Veterinary Pain Management Market Volume Share (%), by Product 2024 & 2032
- Figure 67: Asia Pacific Veterinary Pain Management Market Revenue (Million), by Application 2024 & 2032
- Figure 68: Asia Pacific Veterinary Pain Management Market Volume (K Unit), by Application 2024 & 2032
- Figure 69: Asia Pacific Veterinary Pain Management Market Revenue Share (%), by Application 2024 & 2032
- Figure 70: Asia Pacific Veterinary Pain Management Market Volume Share (%), by Application 2024 & 2032
- Figure 71: Asia Pacific Veterinary Pain Management Market Revenue (Million), by Animal Type 2024 & 2032
- Figure 72: Asia Pacific Veterinary Pain Management Market Volume (K Unit), by Animal Type 2024 & 2032
- Figure 73: Asia Pacific Veterinary Pain Management Market Revenue Share (%), by Animal Type 2024 & 2032
- Figure 74: Asia Pacific Veterinary Pain Management Market Volume Share (%), by Animal Type 2024 & 2032
- Figure 75: Asia Pacific Veterinary Pain Management Market Revenue (Million), by End User 2024 & 2032
- Figure 76: Asia Pacific Veterinary Pain Management Market Volume (K Unit), by End User 2024 & 2032
- Figure 77: Asia Pacific Veterinary Pain Management Market Revenue Share (%), by End User 2024 & 2032
- Figure 78: Asia Pacific Veterinary Pain Management Market Volume Share (%), by End User 2024 & 2032
- Figure 79: Asia Pacific Veterinary Pain Management Market Revenue (Million), by Country 2024 & 2032
- Figure 80: Asia Pacific Veterinary Pain Management Market Volume (K Unit), by Country 2024 & 2032
- Figure 81: Asia Pacific Veterinary Pain Management Market Revenue Share (%), by Country 2024 & 2032
- Figure 82: Asia Pacific Veterinary Pain Management Market Volume Share (%), by Country 2024 & 2032
- Figure 83: Middle East and Africa Veterinary Pain Management Market Revenue (Million), by Product 2024 & 2032
- Figure 84: Middle East and Africa Veterinary Pain Management Market Volume (K Unit), by Product 2024 & 2032
- Figure 85: Middle East and Africa Veterinary Pain Management Market Revenue Share (%), by Product 2024 & 2032
- Figure 86: Middle East and Africa Veterinary Pain Management Market Volume Share (%), by Product 2024 & 2032
- Figure 87: Middle East and Africa Veterinary Pain Management Market Revenue (Million), by Application 2024 & 2032
- Figure 88: Middle East and Africa Veterinary Pain Management Market Volume (K Unit), by Application 2024 & 2032
- Figure 89: Middle East and Africa Veterinary Pain Management Market Revenue Share (%), by Application 2024 & 2032
- Figure 90: Middle East and Africa Veterinary Pain Management Market Volume Share (%), by Application 2024 & 2032
- Figure 91: Middle East and Africa Veterinary Pain Management Market Revenue (Million), by Animal Type 2024 & 2032
- Figure 92: Middle East and Africa Veterinary Pain Management Market Volume (K Unit), by Animal Type 2024 & 2032
- Figure 93: Middle East and Africa Veterinary Pain Management Market Revenue Share (%), by Animal Type 2024 & 2032
- Figure 94: Middle East and Africa Veterinary Pain Management Market Volume Share (%), by Animal Type 2024 & 2032
- Figure 95: Middle East and Africa Veterinary Pain Management Market Revenue (Million), by End User 2024 & 2032
- Figure 96: Middle East and Africa Veterinary Pain Management Market Volume (K Unit), by End User 2024 & 2032
- Figure 97: Middle East and Africa Veterinary Pain Management Market Revenue Share (%), by End User 2024 & 2032
- Figure 98: Middle East and Africa Veterinary Pain Management Market Volume Share (%), by End User 2024 & 2032
- Figure 99: Middle East and Africa Veterinary Pain Management Market Revenue (Million), by Country 2024 & 2032
- Figure 100: Middle East and Africa Veterinary Pain Management Market Volume (K Unit), by Country 2024 & 2032
- Figure 101: Middle East and Africa Veterinary Pain Management Market Revenue Share (%), by Country 2024 & 2032
- Figure 102: Middle East and Africa Veterinary Pain Management Market Volume Share (%), by Country 2024 & 2032
- Figure 103: South America Veterinary Pain Management Market Revenue (Million), by Product 2024 & 2032
- Figure 104: South America Veterinary Pain Management Market Volume (K Unit), by Product 2024 & 2032
- Figure 105: South America Veterinary Pain Management Market Revenue Share (%), by Product 2024 & 2032
- Figure 106: South America Veterinary Pain Management Market Volume Share (%), by Product 2024 & 2032
- Figure 107: South America Veterinary Pain Management Market Revenue (Million), by Application 2024 & 2032
- Figure 108: South America Veterinary Pain Management Market Volume (K Unit), by Application 2024 & 2032
- Figure 109: South America Veterinary Pain Management Market Revenue Share (%), by Application 2024 & 2032
- Figure 110: South America Veterinary Pain Management Market Volume Share (%), by Application 2024 & 2032
- Figure 111: South America Veterinary Pain Management Market Revenue (Million), by Animal Type 2024 & 2032
- Figure 112: South America Veterinary Pain Management Market Volume (K Unit), by Animal Type 2024 & 2032
- Figure 113: South America Veterinary Pain Management Market Revenue Share (%), by Animal Type 2024 & 2032
- Figure 114: South America Veterinary Pain Management Market Volume Share (%), by Animal Type 2024 & 2032
- Figure 115: South America Veterinary Pain Management Market Revenue (Million), by End User 2024 & 2032
- Figure 116: South America Veterinary Pain Management Market Volume (K Unit), by End User 2024 & 2032
- Figure 117: South America Veterinary Pain Management Market Revenue Share (%), by End User 2024 & 2032
- Figure 118: South America Veterinary Pain Management Market Volume Share (%), by End User 2024 & 2032
- Figure 119: South America Veterinary Pain Management Market Revenue (Million), by Country 2024 & 2032
- Figure 120: South America Veterinary Pain Management Market Volume (K Unit), by Country 2024 & 2032
- Figure 121: South America Veterinary Pain Management Market Revenue Share (%), by Country 2024 & 2032
- Figure 122: South America Veterinary Pain Management Market Volume Share (%), by Country 2024 & 2032
List of Tables
- Table 1: Global Veterinary Pain Management Market Revenue Million Forecast, by Region 2019 & 2032
- Table 2: Global Veterinary Pain Management Market Volume K Unit Forecast, by Region 2019 & 2032
- Table 3: Global Veterinary Pain Management Market Revenue Million Forecast, by Product 2019 & 2032
- Table 4: Global Veterinary Pain Management Market Volume K Unit Forecast, by Product 2019 & 2032
- Table 5: Global Veterinary Pain Management Market Revenue Million Forecast, by Application 2019 & 2032
- Table 6: Global Veterinary Pain Management Market Volume K Unit Forecast, by Application 2019 & 2032
- Table 7: Global Veterinary Pain Management Market Revenue Million Forecast, by Animal Type 2019 & 2032
- Table 8: Global Veterinary Pain Management Market Volume K Unit Forecast, by Animal Type 2019 & 2032
- Table 9: Global Veterinary Pain Management Market Revenue Million Forecast, by End User 2019 & 2032
- Table 10: Global Veterinary Pain Management Market Volume K Unit Forecast, by End User 2019 & 2032
- Table 11: Global Veterinary Pain Management Market Revenue Million Forecast, by Region 2019 & 2032
- Table 12: Global Veterinary Pain Management Market Volume K Unit Forecast, by Region 2019 & 2032
- Table 13: Global Veterinary Pain Management Market Revenue Million Forecast, by Country 2019 & 2032
- Table 14: Global Veterinary Pain Management Market Volume K Unit Forecast, by Country 2019 & 2032
- Table 15: Global Veterinary Pain Management Market Revenue Million Forecast, by Country 2019 & 2032
- Table 16: Global Veterinary Pain Management Market Volume K Unit Forecast, by Country 2019 & 2032
- Table 17: Global Veterinary Pain Management Market Revenue Million Forecast, by Country 2019 & 2032
- Table 18: Global Veterinary Pain Management Market Volume K Unit Forecast, by Country 2019 & 2032
- Table 19: Global Veterinary Pain Management Market Revenue Million Forecast, by Country 2019 & 2032
- Table 20: Global Veterinary Pain Management Market Volume K Unit Forecast, by Country 2019 & 2032
- Table 21: Global Veterinary Pain Management Market Revenue Million Forecast, by Country 2019 & 2032
- Table 22: Global Veterinary Pain Management Market Volume K Unit Forecast, by Country 2019 & 2032
- Table 23: Global Veterinary Pain Management Market Revenue Million Forecast, by Product 2019 & 2032
- Table 24: Global Veterinary Pain Management Market Volume K Unit Forecast, by Product 2019 & 2032
- Table 25: Global Veterinary Pain Management Market Revenue Million Forecast, by Application 2019 & 2032
- Table 26: Global Veterinary Pain Management Market Volume K Unit Forecast, by Application 2019 & 2032
- Table 27: Global Veterinary Pain Management Market Revenue Million Forecast, by Animal Type 2019 & 2032
- Table 28: Global Veterinary Pain Management Market Volume K Unit Forecast, by Animal Type 2019 & 2032
- Table 29: Global Veterinary Pain Management Market Revenue Million Forecast, by End User 2019 & 2032
- Table 30: Global Veterinary Pain Management Market Volume K Unit Forecast, by End User 2019 & 2032
- Table 31: Global Veterinary Pain Management Market Revenue Million Forecast, by Country 2019 & 2032
- Table 32: Global Veterinary Pain Management Market Volume K Unit Forecast, by Country 2019 & 2032
- Table 33: United States Veterinary Pain Management Market Revenue (Million) Forecast, by Application 2019 & 2032
- Table 34: United States Veterinary Pain Management Market Volume (K Unit) Forecast, by Application 2019 & 2032
- Table 35: Canada Veterinary Pain Management Market Revenue (Million) Forecast, by Application 2019 & 2032
- Table 36: Canada Veterinary Pain Management Market Volume (K Unit) Forecast, by Application 2019 & 2032
- Table 37: Mexico Veterinary Pain Management Market Revenue (Million) Forecast, by Application 2019 & 2032
- Table 38: Mexico Veterinary Pain Management Market Volume (K Unit) Forecast, by Application 2019 & 2032
- Table 39: Global Veterinary Pain Management Market Revenue Million Forecast, by Product 2019 & 2032
- Table 40: Global Veterinary Pain Management Market Volume K Unit Forecast, by Product 2019 & 2032
- Table 41: Global Veterinary Pain Management Market Revenue Million Forecast, by Application 2019 & 2032
- Table 42: Global Veterinary Pain Management Market Volume K Unit Forecast, by Application 2019 & 2032
- Table 43: Global Veterinary Pain Management Market Revenue Million Forecast, by Animal Type 2019 & 2032
- Table 44: Global Veterinary Pain Management Market Volume K Unit Forecast, by Animal Type 2019 & 2032
- Table 45: Global Veterinary Pain Management Market Revenue Million Forecast, by End User 2019 & 2032
- Table 46: Global Veterinary Pain Management Market Volume K Unit Forecast, by End User 2019 & 2032
- Table 47: Global Veterinary Pain Management Market Revenue Million Forecast, by Country 2019 & 2032
- Table 48: Global Veterinary Pain Management Market Volume K Unit Forecast, by Country 2019 & 2032
- Table 49: Germany Veterinary Pain Management Market Revenue (Million) Forecast, by Application 2019 & 2032
- Table 50: Germany Veterinary Pain Management Market Volume (K Unit) Forecast, by Application 2019 & 2032
- Table 51: United Kingdom Veterinary Pain Management Market Revenue (Million) Forecast, by Application 2019 & 2032
- Table 52: United Kingdom Veterinary Pain Management Market Volume (K Unit) Forecast, by Application 2019 & 2032
- Table 53: France Veterinary Pain Management Market Revenue (Million) Forecast, by Application 2019 & 2032
- Table 54: France Veterinary Pain Management Market Volume (K Unit) Forecast, by Application 2019 & 2032
- Table 55: Italy Veterinary Pain Management Market Revenue (Million) Forecast, by Application 2019 & 2032
- Table 56: Italy Veterinary Pain Management Market Volume (K Unit) Forecast, by Application 2019 & 2032
- Table 57: Spain Veterinary Pain Management Market Revenue (Million) Forecast, by Application 2019 & 2032
- Table 58: Spain Veterinary Pain Management Market Volume (K Unit) Forecast, by Application 2019 & 2032
- Table 59: Rest of Europe Veterinary Pain Management Market Revenue (Million) Forecast, by Application 2019 & 2032
- Table 60: Rest of Europe Veterinary Pain Management Market Volume (K Unit) Forecast, by Application 2019 & 2032
- Table 61: Global Veterinary Pain Management Market Revenue Million Forecast, by Product 2019 & 2032
- Table 62: Global Veterinary Pain Management Market Volume K Unit Forecast, by Product 2019 & 2032
- Table 63: Global Veterinary Pain Management Market Revenue Million Forecast, by Application 2019 & 2032
- Table 64: Global Veterinary Pain Management Market Volume K Unit Forecast, by Application 2019 & 2032
- Table 65: Global Veterinary Pain Management Market Revenue Million Forecast, by Animal Type 2019 & 2032
- Table 66: Global Veterinary Pain Management Market Volume K Unit Forecast, by Animal Type 2019 & 2032
- Table 67: Global Veterinary Pain Management Market Revenue Million Forecast, by End User 2019 & 2032
- Table 68: Global Veterinary Pain Management Market Volume K Unit Forecast, by End User 2019 & 2032
- Table 69: Global Veterinary Pain Management Market Revenue Million Forecast, by Country 2019 & 2032
- Table 70: Global Veterinary Pain Management Market Volume K Unit Forecast, by Country 2019 & 2032
- Table 71: China Veterinary Pain Management Market Revenue (Million) Forecast, by Application 2019 & 2032
- Table 72: China Veterinary Pain Management Market Volume (K Unit) Forecast, by Application 2019 & 2032
- Table 73: Japan Veterinary Pain Management Market Revenue (Million) Forecast, by Application 2019 & 2032
- Table 74: Japan Veterinary Pain Management Market Volume (K Unit) Forecast, by Application 2019 & 2032
- Table 75: India Veterinary Pain Management Market Revenue (Million) Forecast, by Application 2019 & 2032
- Table 76: India Veterinary Pain Management Market Volume (K Unit) Forecast, by Application 2019 & 2032
- Table 77: Australia Veterinary Pain Management Market Revenue (Million) Forecast, by Application 2019 & 2032
- Table 78: Australia Veterinary Pain Management Market Volume (K Unit) Forecast, by Application 2019 & 2032
- Table 79: South Korea Veterinary Pain Management Market Revenue (Million) Forecast, by Application 2019 & 2032
- Table 80: South Korea Veterinary Pain Management Market Volume (K Unit) Forecast, by Application 2019 & 2032
- Table 81: Rest of Asia Pacific Veterinary Pain Management Market Revenue (Million) Forecast, by Application 2019 & 2032
- Table 82: Rest of Asia Pacific Veterinary Pain Management Market Volume (K Unit) Forecast, by Application 2019 & 2032
- Table 83: Global Veterinary Pain Management Market Revenue Million Forecast, by Product 2019 & 2032
- Table 84: Global Veterinary Pain Management Market Volume K Unit Forecast, by Product 2019 & 2032
- Table 85: Global Veterinary Pain Management Market Revenue Million Forecast, by Application 2019 & 2032
- Table 86: Global Veterinary Pain Management Market Volume K Unit Forecast, by Application 2019 & 2032
- Table 87: Global Veterinary Pain Management Market Revenue Million Forecast, by Animal Type 2019 & 2032
- Table 88: Global Veterinary Pain Management Market Volume K Unit Forecast, by Animal Type 2019 & 2032
- Table 89: Global Veterinary Pain Management Market Revenue Million Forecast, by End User 2019 & 2032
- Table 90: Global Veterinary Pain Management Market Volume K Unit Forecast, by End User 2019 & 2032
- Table 91: Global Veterinary Pain Management Market Revenue Million Forecast, by Country 2019 & 2032
- Table 92: Global Veterinary Pain Management Market Volume K Unit Forecast, by Country 2019 & 2032
- Table 93: GCC Veterinary Pain Management Market Revenue (Million) Forecast, by Application 2019 & 2032
- Table 94: GCC Veterinary Pain Management Market Volume (K Unit) Forecast, by Application 2019 & 2032
- Table 95: South Africa Veterinary Pain Management Market Revenue (Million) Forecast, by Application 2019 & 2032
- Table 96: South Africa Veterinary Pain Management Market Volume (K Unit) Forecast, by Application 2019 & 2032
- Table 97: Rest of Middle East and Africa Veterinary Pain Management Market Revenue (Million) Forecast, by Application 2019 & 2032
- Table 98: Rest of Middle East and Africa Veterinary Pain Management Market Volume (K Unit) Forecast, by Application 2019 & 2032
- Table 99: Global Veterinary Pain Management Market Revenue Million Forecast, by Product 2019 & 2032
- Table 100: Global Veterinary Pain Management Market Volume K Unit Forecast, by Product 2019 & 2032
- Table 101: Global Veterinary Pain Management Market Revenue Million Forecast, by Application 2019 & 2032
- Table 102: Global Veterinary Pain Management Market Volume K Unit Forecast, by Application 2019 & 2032
- Table 103: Global Veterinary Pain Management Market Revenue Million Forecast, by Animal Type 2019 & 2032
- Table 104: Global Veterinary Pain Management Market Volume K Unit Forecast, by Animal Type 2019 & 2032
- Table 105: Global Veterinary Pain Management Market Revenue Million Forecast, by End User 2019 & 2032
- Table 106: Global Veterinary Pain Management Market Volume K Unit Forecast, by End User 2019 & 2032
- Table 107: Global Veterinary Pain Management Market Revenue Million Forecast, by Country 2019 & 2032
- Table 108: Global Veterinary Pain Management Market Volume K Unit Forecast, by Country 2019 & 2032
- Table 109: Brazil Veterinary Pain Management Market Revenue (Million) Forecast, by Application 2019 & 2032
- Table 110: Brazil Veterinary Pain Management Market Volume (K Unit) Forecast, by Application 2019 & 2032
- Table 111: Argentina Veterinary Pain Management Market Revenue (Million) Forecast, by Application 2019 & 2032
- Table 112: Argentina Veterinary Pain Management Market Volume (K Unit) Forecast, by Application 2019 & 2032
- Table 113: Rest of South America Veterinary Pain Management Market Revenue (Million) Forecast, by Application 2019 & 2032
- Table 114: Rest of South America Veterinary Pain Management Market Volume (K Unit) Forecast, by Application 2019 & 2032
Frequently Asked Questions
1. What is the projected Compound Annual Growth Rate (CAGR) of the Veterinary Pain Management Market?
The projected CAGR is approximately 5.91%.
2. Which companies are prominent players in the Veterinary Pain Management Market?
Key companies in the market include Assisi Animal Health, Boehringer Ingelheim International GmbH, Merck and Co Inc, Dechra Pharmaceuticals PLC, Chanelle Veterinary Limited, VetoquinolSA, Norbrook, Eltech K-Laser SRL, Ceva Sante Animale, Elanco Animal Health Incorporated, Zoetis Inc.
3. What are the main segments of the Veterinary Pain Management Market?
The market segments include Product, Application, Animal Type, End User.
4. Can you provide details about the market size?
The market size is estimated to be USD 1.65 Million as of 2022.
5. What are some drivers contributing to market growth?
Growth in Prevalence of Painful and Inflammatory Diseases in Animals; Rise in Need for Easily Accessible and Affordable Treatment Options; Increase in Awareness about Animal Health and Welfare.
6. What are the notable trends driving market growth?
Laser Therapy is Expected to Witness Considerable Growth Over the Forecast Period.
7. Are there any restraints impacting market growth?
Side Effects Associated With Treatment and High Cost of Certain Products.
8. Can you provide examples of recent developments in the market?
September 2022: Zoetis launched Solensia to manage feline osteoarthritis pain in the United States.
9. What pricing options are available for accessing the report?
Pricing options include single-user, multi-user, and enterprise licenses priced at USD 4750, USD 5250, and USD 8750 respectively.
10. Is the market size provided in terms of value or volume?
The market size is provided in terms of value, measured in Million and volume, measured in K Unit.
11. Are there any specific market keywords associated with the report?
Yes, the market keyword associated with the report is "Veterinary Pain Management Market," which aids in identifying and referencing the specific market segment covered.
12. How do I determine which pricing option suits my needs best?
The pricing options vary based on user requirements and access needs. Individual users may opt for single-user licenses, while businesses requiring broader access may choose multi-user or enterprise licenses for cost-effective access to the report.
13. Are there any additional resources or data provided in the Veterinary Pain Management Market report?
While the report offers comprehensive insights, it's advisable to review the specific contents or supplementary materials provided to ascertain if additional resources or data are available.
14. How can I stay updated on further developments or reports in the Veterinary Pain Management Market?
To stay informed about further developments, trends, and reports in the Veterinary Pain Management Market, consider subscribing to industry newsletters, following relevant companies and organizations, or regularly checking reputable industry news sources and publications.
Methodology
Step 1 - Identification of Relevant Samples Size from Population Database


Step 2 - Approaches for Defining Global Market Size (Value, Volume* & Price*)

Note*: In applicable scenarios
Step 3 - Data Sources
Primary Research
- Web Analytics
- Survey Reports
- Research Institute
- Latest Research Reports
- Opinion Leaders
Secondary Research
- Annual Reports
- White Paper
- Latest Press Release
- Industry Association
- Paid Database
- Investor Presentations

Step 4 - Data Triangulation
Involves using different sources of information in order to increase the validity of a study
These sources are likely to be stakeholders in a program - participants, other researchers, program staff, other community members, and so on.
Then we put all data in single framework & apply various statistical tools to find out the dynamic on the market.
During the analysis stage, feedback from the stakeholder groups would be compared to determine areas of agreement as well as areas of divergence
