

Key Insights
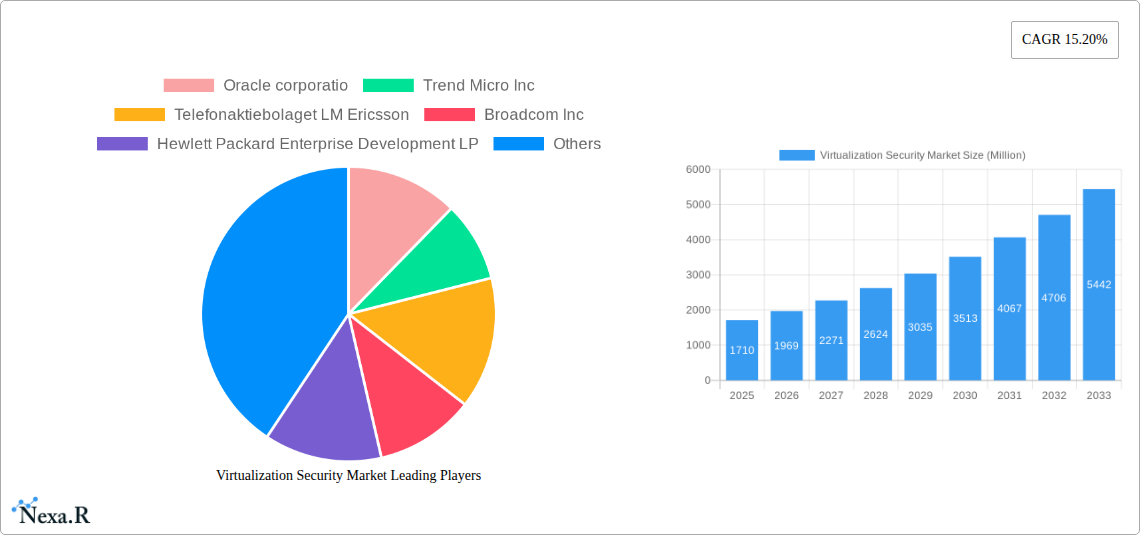
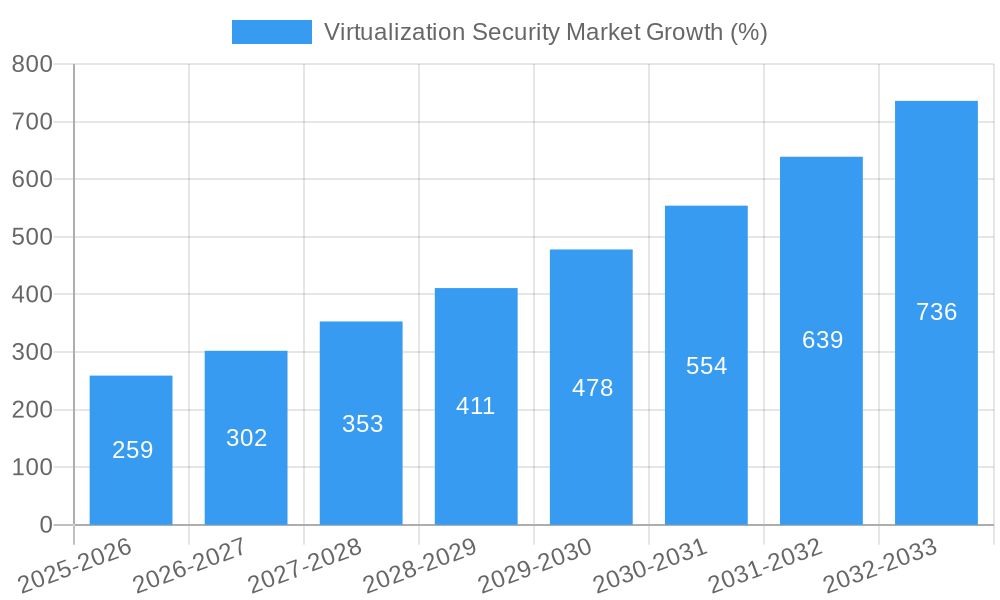
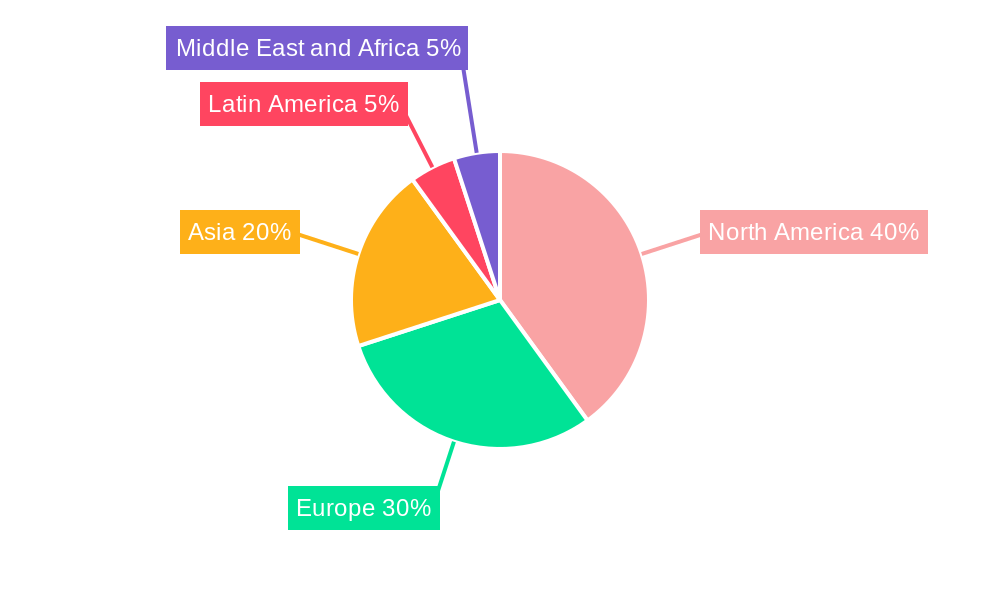
The virtualization security market, valued at $1.71 billion in 2025, is projected to experience robust growth, driven by the increasing adoption of virtualization technologies across diverse sectors. A Compound Annual Growth Rate (CAGR) of 15.20% from 2025 to 2033 indicates a significant expansion, fueled by several key factors. The rising prevalence of cloud computing and data centers necessitates robust security measures, thereby boosting demand for virtualization security solutions. Furthermore, the escalating number of cyber threats and data breaches underscores the critical need for advanced security architectures that protect virtualized environments. The market segmentation reveals a strong preference for hardware virtualization over application virtualization, with IT & Telecom, Data Center, and Cloud Service Providers representing the dominant end-user applications. Major players like VMware, Oracle, and others are aggressively investing in research and development to enhance their offerings, fostering innovation and competition within the market. Geographic distribution shows North America and Europe holding significant market shares, driven by mature IT infrastructure and high cybersecurity awareness. However, the Asia-Pacific region, with its rapidly expanding digital landscape, is poised for substantial growth in the coming years. The market’s growth trajectory suggests a promising future, with opportunities for both established players and emerging innovators to capitalize on the increasing demand for comprehensive virtualization security solutions.
The restraints to market growth primarily include the complexity of implementing and managing virtualization security solutions, along with the high initial investment costs. Concerns surrounding vendor lock-in and the potential for integration challenges can also deter some organizations. However, the overall benefits of enhanced security, improved resource optimization, and reduced operational costs are expected to outweigh these challenges. The continuous evolution of cyber threats necessitates ongoing investments in security solutions and skilled personnel, posing an ongoing operational challenge. Nevertheless, advancements in artificial intelligence (AI) and machine learning (ML) are creating innovative solutions that can automate threat detection and response, addressing some of these challenges. The market’s resilience to these restraints is evident in its projected sustained growth, suggesting that the demand for secure virtualization environments will remain a significant driving force.
Virtualization Security Market: A Comprehensive Report (2019-2033)
This comprehensive report provides a detailed analysis of the Virtualization Security Market, encompassing market dynamics, growth trends, regional segmentation, product landscape, key players, and future outlook. The study period covers 2019-2033, with 2025 as the base and estimated year. The report is crucial for industry professionals, investors, and strategic decision-makers seeking insights into this rapidly evolving sector. The parent market is the broader Cybersecurity market, while the child market focuses specifically on security solutions within virtualized environments. The market size is projected to reach xx Million by 2033.
Virtualization Security Market Dynamics & Structure
The Virtualization Security Market is characterized by a moderately concentrated landscape, with key players such as VMware, Oracle, and Hewlett Packard Enterprise holding significant market share. Technological innovation, particularly in areas like AI-driven security and cloud-native solutions, is a primary growth driver. Stringent data privacy regulations and increasing cybersecurity threats are shaping the regulatory environment. The market experiences competitive pressure from alternative security solutions. End-user demographics are shifting towards cloud-based deployments, favoring cloud service providers and data centers. M&A activity is significant, reflecting consolidation and expansion strategies within the sector.
- Market Concentration: Moderately concentrated, with top 5 players holding approximately xx% of the market share in 2025.
- Technological Innovation: AI, machine learning, and cloud-native security are key innovation drivers.
- Regulatory Framework: GDPR, CCPA, and other data privacy regulations are driving demand for robust virtualization security.
- Competitive Substitutes: Traditional network security solutions and cloud security services pose competitive pressure.
- End-User Demographics: Growth is fueled by increased adoption of cloud computing and virtualization across IT & Telecom, Data Centers and Cloud Service Providers.
- M&A Trends: Significant M&A activity observed in the historical period (2019-2024), with an average of xx deals per year.
Virtualization Security Market Growth Trends & Insights
The Virtualization Security Market witnessed robust growth during the historical period (2019-2024), expanding at a CAGR of xx%. This growth is attributed to several factors including the rising adoption of virtualization technologies across various industries, increasing concerns over data breaches and cyberattacks, and the growing adoption of cloud computing. Market penetration for virtualization security solutions increased significantly from xx% in 2019 to xx% in 2024, and is projected to reach xx% by 2033. Technological advancements, such as the integration of AI and machine learning, are enhancing the effectiveness and efficiency of these solutions. The shift towards cloud-based deployments and multi-cloud environments is further driving the adoption of virtualization security solutions. Consumer behavior increasingly emphasizes data protection and seamless security integration.
Dominant Regions, Countries, or Segments in Virtualization Security Market
North America currently dominates the Virtualization Security Market, driven by strong technological advancements, high adoption rates of virtualization technologies, and robust cybersecurity infrastructure. However, the Asia-Pacific region is projected to experience the fastest growth during the forecast period (2025-2033) due to increasing digitalization and government initiatives promoting cybersecurity. Within the segments, the Hardware Virtualization segment holds the largest market share, followed by Application Virtualization. The Data Center and Cloud Service Provider segments are witnessing the highest growth due to the increasing adoption of cloud computing.
- Key Drivers for North America: Strong technological ecosystem, high awareness of cyber risks, and regulatory compliance needs.
- Key Drivers for Asia-Pacific: Rapid digital transformation, increasing government investments in cybersecurity, and growing adoption of cloud services.
- Segment Dominance: Hardware Virtualization holds a larger market share due to its broader applicability, while the Application Virtualization segment shows higher growth potential.
- End-User Application Growth: The Data Center and Cloud Service Providers segment demonstrate the highest growth due to their heavy reliance on virtualization and associated security needs.
Virtualization Security Market Product Landscape
The Virtualization Security Market offers a diverse range of products, including hardware-based solutions (e.g., network firewalls, intrusion detection/prevention systems) and software-based solutions (e.g., virtual patching, security information and event management (SIEM) tools). These solutions are designed to secure virtualized environments, protecting against various threats such as malware, data breaches, and unauthorized access. Recent advancements involve integration with AI/ML for improved threat detection and response, as well as enhanced automation capabilities for streamlined security management. Unique selling propositions focus on ease of use, scalability, and comprehensive threat protection across diverse virtualized infrastructures.
Key Drivers, Barriers & Challenges in Virtualization Security Market
Key Drivers:
- The rising adoption of cloud computing and virtualization technologies.
- Increasing cyber threats and data breaches.
- Stricter data privacy regulations.
Challenges & Restraints:
- High initial investment costs associated with implementing virtualization security solutions.
- Complexity in managing and integrating multiple security solutions across diverse virtualized environments.
- Shortage of skilled cybersecurity professionals.
- Supply chain disruptions impacting the availability of hardware components.
Emerging Opportunities in Virtualization Security Market
- Growing demand for secure multi-cloud environments.
- Increased adoption of AI/ML-powered security solutions.
- Expanding market in developing economies.
- Growth in the adoption of serverless computing and containerization.
- Development of specialized solutions for securing specific virtualized applications (e.g., DevOps, AI/ML).
Growth Accelerators in the Virtualization Security Market Industry
Strategic partnerships between virtualization vendors and security providers are fostering innovation and driving market growth. Technological advancements like AI-driven threat detection and cloud-native security solutions are accelerating adoption. Expansion into emerging markets, particularly in developing economies undergoing rapid digital transformation, presents significant growth opportunities.
Key Players Shaping the Virtualization Security Market Market
- Oracle Corporation
- Trend Micro Inc
- Telefonaktiebolaget LM Ericsson
- Broadcom Inc
- Hewlett Packard Enterprise Development LP
- Dell Inc
- Altor Networks
- VMware Inc
Notable Milestones in Virtualization Security Market Sector
- August 2023: Lenovo and VMware partnered to deliver NVIDIA-powered generative AI and multi-cloud solutions, expanding hybrid multi-cloud capabilities for mid-size businesses. This signifies a major push toward AI-driven security within hybrid cloud environments.
- March 2023: Hewlett Packard Enterprise's acquisition of Axis Security strengthened its network security offerings, providing integrated networking and security-as-a-service solutions. This highlights the trend towards integrated security solutions delivered via the cloud.
In-Depth Virtualization Security Market Market Outlook
The Virtualization Security Market is poised for sustained growth, driven by the increasing adoption of cloud computing, the growing threat landscape, and ongoing technological advancements. Strategic partnerships, innovative product development, and expansion into new markets will play a pivotal role in shaping the market’s future. The market is expected to witness significant growth in the next decade, presenting lucrative opportunities for both established players and new entrants.
Virtualization Security Market Segmentation
-
1. Type
- 1.1. Hardware Virtualization
- 1.2. Application Virtualization
-
2. End-user Application
- 2.1. IT & Telecom
- 2.2. Data Center
- 2.3. Cloud Service Providers
Virtualization Security Market Segmentation By Geography
-
1. North America
- 1.1. United States
- 1.2. Canada
-
2. Europe
- 2.1. United Kingdom
- 2.2. Germany
- 2.3. France
-
3. Asia
- 3.1. China
- 3.2. Japan
- 4. Australia and New Zealand
-
5. Latin America
- 5.1. Mexico
- 5.2. Brazil
- 6. Middle East and Africa
Virtualization Security Market REPORT HIGHLIGHTS
| Aspects | Details |
|---|---|
| Study Period | 2019-2033 |
| Base Year | 2024 |
| Estimated Year | 2025 |
| Forecast Period | 2025-2033 |
| Historical Period | 2019-2024 |
| Growth Rate | CAGR of 15.20% from 2019-2033 |
| Segmentation |
|
Table of Contents
- 1. Introduction
- 1.1. Research Scope
- 1.2. Market Segmentation
- 1.3. Research Methodology
- 1.4. Definitions and Assumptions
- 2. Executive Summary
- 2.1. Introduction
- 3. Market Dynamics
- 3.1. Introduction
- 3.2. Market Drivers
- 3.2.1. Rapid Increase in Data Generated to Witness the Growth
- 3.3. Market Restrains
- 3.3.1. High Up-front Costs Involved
- 3.4. Market Trends
- 3.4.1. IT & Telecom is Expected to Hold a Major Market Share
- 4. Market Factor Analysis
- 4.1. Porters Five Forces
- 4.2. Supply/Value Chain
- 4.3. PESTEL analysis
- 4.4. Market Entropy
- 4.5. Patent/Trademark Analysis
- 5. Global Virtualization Security Market Analysis, Insights and Forecast, 2019-2031
- 5.1. Market Analysis, Insights and Forecast - by Type
- 5.1.1. Hardware Virtualization
- 5.1.2. Application Virtualization
- 5.2. Market Analysis, Insights and Forecast - by End-user Application
- 5.2.1. IT & Telecom
- 5.2.2. Data Center
- 5.2.3. Cloud Service Providers
- 5.3. Market Analysis, Insights and Forecast - by Region
- 5.3.1. North America
- 5.3.2. Europe
- 5.3.3. Asia
- 5.3.4. Australia and New Zealand
- 5.3.5. Latin America
- 5.3.6. Middle East and Africa
- 5.1. Market Analysis, Insights and Forecast - by Type
- 6. North America Virtualization Security Market Analysis, Insights and Forecast, 2019-2031
- 6.1. Market Analysis, Insights and Forecast - by Type
- 6.1.1. Hardware Virtualization
- 6.1.2. Application Virtualization
- 6.2. Market Analysis, Insights and Forecast - by End-user Application
- 6.2.1. IT & Telecom
- 6.2.2. Data Center
- 6.2.3. Cloud Service Providers
- 6.1. Market Analysis, Insights and Forecast - by Type
- 7. Europe Virtualization Security Market Analysis, Insights and Forecast, 2019-2031
- 7.1. Market Analysis, Insights and Forecast - by Type
- 7.1.1. Hardware Virtualization
- 7.1.2. Application Virtualization
- 7.2. Market Analysis, Insights and Forecast - by End-user Application
- 7.2.1. IT & Telecom
- 7.2.2. Data Center
- 7.2.3. Cloud Service Providers
- 7.1. Market Analysis, Insights and Forecast - by Type
- 8. Asia Virtualization Security Market Analysis, Insights and Forecast, 2019-2031
- 8.1. Market Analysis, Insights and Forecast - by Type
- 8.1.1. Hardware Virtualization
- 8.1.2. Application Virtualization
- 8.2. Market Analysis, Insights and Forecast - by End-user Application
- 8.2.1. IT & Telecom
- 8.2.2. Data Center
- 8.2.3. Cloud Service Providers
- 8.1. Market Analysis, Insights and Forecast - by Type
- 9. Australia and New Zealand Virtualization Security Market Analysis, Insights and Forecast, 2019-2031
- 9.1. Market Analysis, Insights and Forecast - by Type
- 9.1.1. Hardware Virtualization
- 9.1.2. Application Virtualization
- 9.2. Market Analysis, Insights and Forecast - by End-user Application
- 9.2.1. IT & Telecom
- 9.2.2. Data Center
- 9.2.3. Cloud Service Providers
- 9.1. Market Analysis, Insights and Forecast - by Type
- 10. Latin America Virtualization Security Market Analysis, Insights and Forecast, 2019-2031
- 10.1. Market Analysis, Insights and Forecast - by Type
- 10.1.1. Hardware Virtualization
- 10.1.2. Application Virtualization
- 10.2. Market Analysis, Insights and Forecast - by End-user Application
- 10.2.1. IT & Telecom
- 10.2.2. Data Center
- 10.2.3. Cloud Service Providers
- 10.1. Market Analysis, Insights and Forecast - by Type
- 11. Middle East and Africa Virtualization Security Market Analysis, Insights and Forecast, 2019-2031
- 11.1. Market Analysis, Insights and Forecast - by Type
- 11.1.1. Hardware Virtualization
- 11.1.2. Application Virtualization
- 11.2. Market Analysis, Insights and Forecast - by End-user Application
- 11.2.1. IT & Telecom
- 11.2.2. Data Center
- 11.2.3. Cloud Service Providers
- 11.1. Market Analysis, Insights and Forecast - by Type
- 12. North America Virtualization Security Market Analysis, Insights and Forecast, 2019-2031
- 12.1. Market Analysis, Insights and Forecast - By Country/Sub-region
- 12.1.1 United States
- 12.1.2 Canada
- 13. Europe Virtualization Security Market Analysis, Insights and Forecast, 2019-2031
- 13.1. Market Analysis, Insights and Forecast - By Country/Sub-region
- 13.1.1 United Kingdom
- 13.1.2 Germany
- 13.1.3 France
- 14. Asia Virtualization Security Market Analysis, Insights and Forecast, 2019-2031
- 14.1. Market Analysis, Insights and Forecast - By Country/Sub-region
- 14.1.1 China
- 14.1.2 Japan
- 14.1.3 Australia
- 15. Latin America Virtualization Security Market Analysis, Insights and Forecast, 2019-2031
- 15.1. Market Analysis, Insights and Forecast - By Country/Sub-region
- 15.1.1 Mexico
- 15.1.2 Brazil
- 16. Middle East and Africa Virtualization Security Market Analysis, Insights and Forecast, 2019-2031
- 16.1. Market Analysis, Insights and Forecast - By Country/Sub-region
- 16.1.1.
- 17. Competitive Analysis
- 17.1. Global Market Share Analysis 2024
- 17.2. Company Profiles
- 17.2.1 Oracle corporatio
- 17.2.1.1. Overview
- 17.2.1.2. Products
- 17.2.1.3. SWOT Analysis
- 17.2.1.4. Recent Developments
- 17.2.1.5. Financials (Based on Availability)
- 17.2.2 Trend Micro Inc
- 17.2.2.1. Overview
- 17.2.2.2. Products
- 17.2.2.3. SWOT Analysis
- 17.2.2.4. Recent Developments
- 17.2.2.5. Financials (Based on Availability)
- 17.2.3 Telefonaktiebolaget LM Ericsson
- 17.2.3.1. Overview
- 17.2.3.2. Products
- 17.2.3.3. SWOT Analysis
- 17.2.3.4. Recent Developments
- 17.2.3.5. Financials (Based on Availability)
- 17.2.4 Broadcom Inc
- 17.2.4.1. Overview
- 17.2.4.2. Products
- 17.2.4.3. SWOT Analysis
- 17.2.4.4. Recent Developments
- 17.2.4.5. Financials (Based on Availability)
- 17.2.5 Hewlett Packard Enterprise Development LP
- 17.2.5.1. Overview
- 17.2.5.2. Products
- 17.2.5.3. SWOT Analysis
- 17.2.5.4. Recent Developments
- 17.2.5.5. Financials (Based on Availability)
- 17.2.6 Dell Inc
- 17.2.6.1. Overview
- 17.2.6.2. Products
- 17.2.6.3. SWOT Analysis
- 17.2.6.4. Recent Developments
- 17.2.6.5. Financials (Based on Availability)
- 17.2.7 Altor Networks
- 17.2.7.1. Overview
- 17.2.7.2. Products
- 17.2.7.3. SWOT Analysis
- 17.2.7.4. Recent Developments
- 17.2.7.5. Financials (Based on Availability)
- 17.2.8 VMware Inc
- 17.2.8.1. Overview
- 17.2.8.2. Products
- 17.2.8.3. SWOT Analysis
- 17.2.8.4. Recent Developments
- 17.2.8.5. Financials (Based on Availability)
- 17.2.1 Oracle corporatio
List of Figures
- Figure 1: Global Virtualization Security Market Revenue Breakdown (Million, %) by Region 2024 & 2032
- Figure 2: North America Virtualization Security Market Revenue (Million), by Country 2024 & 2032
- Figure 3: North America Virtualization Security Market Revenue Share (%), by Country 2024 & 2032
- Figure 4: Europe Virtualization Security Market Revenue (Million), by Country 2024 & 2032
- Figure 5: Europe Virtualization Security Market Revenue Share (%), by Country 2024 & 2032
- Figure 6: Asia Virtualization Security Market Revenue (Million), by Country 2024 & 2032
- Figure 7: Asia Virtualization Security Market Revenue Share (%), by Country 2024 & 2032
- Figure 8: Latin America Virtualization Security Market Revenue (Million), by Country 2024 & 2032
- Figure 9: Latin America Virtualization Security Market Revenue Share (%), by Country 2024 & 2032
- Figure 10: Middle East and Africa Virtualization Security Market Revenue (Million), by Country 2024 & 2032
- Figure 11: Middle East and Africa Virtualization Security Market Revenue Share (%), by Country 2024 & 2032
- Figure 12: North America Virtualization Security Market Revenue (Million), by Type 2024 & 2032
- Figure 13: North America Virtualization Security Market Revenue Share (%), by Type 2024 & 2032
- Figure 14: North America Virtualization Security Market Revenue (Million), by End-user Application 2024 & 2032
- Figure 15: North America Virtualization Security Market Revenue Share (%), by End-user Application 2024 & 2032
- Figure 16: North America Virtualization Security Market Revenue (Million), by Country 2024 & 2032
- Figure 17: North America Virtualization Security Market Revenue Share (%), by Country 2024 & 2032
- Figure 18: Europe Virtualization Security Market Revenue (Million), by Type 2024 & 2032
- Figure 19: Europe Virtualization Security Market Revenue Share (%), by Type 2024 & 2032
- Figure 20: Europe Virtualization Security Market Revenue (Million), by End-user Application 2024 & 2032
- Figure 21: Europe Virtualization Security Market Revenue Share (%), by End-user Application 2024 & 2032
- Figure 22: Europe Virtualization Security Market Revenue (Million), by Country 2024 & 2032
- Figure 23: Europe Virtualization Security Market Revenue Share (%), by Country 2024 & 2032
- Figure 24: Asia Virtualization Security Market Revenue (Million), by Type 2024 & 2032
- Figure 25: Asia Virtualization Security Market Revenue Share (%), by Type 2024 & 2032
- Figure 26: Asia Virtualization Security Market Revenue (Million), by End-user Application 2024 & 2032
- Figure 27: Asia Virtualization Security Market Revenue Share (%), by End-user Application 2024 & 2032
- Figure 28: Asia Virtualization Security Market Revenue (Million), by Country 2024 & 2032
- Figure 29: Asia Virtualization Security Market Revenue Share (%), by Country 2024 & 2032
- Figure 30: Australia and New Zealand Virtualization Security Market Revenue (Million), by Type 2024 & 2032
- Figure 31: Australia and New Zealand Virtualization Security Market Revenue Share (%), by Type 2024 & 2032
- Figure 32: Australia and New Zealand Virtualization Security Market Revenue (Million), by End-user Application 2024 & 2032
- Figure 33: Australia and New Zealand Virtualization Security Market Revenue Share (%), by End-user Application 2024 & 2032
- Figure 34: Australia and New Zealand Virtualization Security Market Revenue (Million), by Country 2024 & 2032
- Figure 35: Australia and New Zealand Virtualization Security Market Revenue Share (%), by Country 2024 & 2032
- Figure 36: Latin America Virtualization Security Market Revenue (Million), by Type 2024 & 2032
- Figure 37: Latin America Virtualization Security Market Revenue Share (%), by Type 2024 & 2032
- Figure 38: Latin America Virtualization Security Market Revenue (Million), by End-user Application 2024 & 2032
- Figure 39: Latin America Virtualization Security Market Revenue Share (%), by End-user Application 2024 & 2032
- Figure 40: Latin America Virtualization Security Market Revenue (Million), by Country 2024 & 2032
- Figure 41: Latin America Virtualization Security Market Revenue Share (%), by Country 2024 & 2032
- Figure 42: Middle East and Africa Virtualization Security Market Revenue (Million), by Type 2024 & 2032
- Figure 43: Middle East and Africa Virtualization Security Market Revenue Share (%), by Type 2024 & 2032
- Figure 44: Middle East and Africa Virtualization Security Market Revenue (Million), by End-user Application 2024 & 2032
- Figure 45: Middle East and Africa Virtualization Security Market Revenue Share (%), by End-user Application 2024 & 2032
- Figure 46: Middle East and Africa Virtualization Security Market Revenue (Million), by Country 2024 & 2032
- Figure 47: Middle East and Africa Virtualization Security Market Revenue Share (%), by Country 2024 & 2032
List of Tables
- Table 1: Global Virtualization Security Market Revenue Million Forecast, by Region 2019 & 2032
- Table 2: Global Virtualization Security Market Revenue Million Forecast, by Type 2019 & 2032
- Table 3: Global Virtualization Security Market Revenue Million Forecast, by End-user Application 2019 & 2032
- Table 4: Global Virtualization Security Market Revenue Million Forecast, by Region 2019 & 2032
- Table 5: Global Virtualization Security Market Revenue Million Forecast, by Country 2019 & 2032
- Table 6: United States Virtualization Security Market Revenue (Million) Forecast, by Application 2019 & 2032
- Table 7: Canada Virtualization Security Market Revenue (Million) Forecast, by Application 2019 & 2032
- Table 8: Global Virtualization Security Market Revenue Million Forecast, by Country 2019 & 2032
- Table 9: United Kingdom Virtualization Security Market Revenue (Million) Forecast, by Application 2019 & 2032
- Table 10: Germany Virtualization Security Market Revenue (Million) Forecast, by Application 2019 & 2032
- Table 11: France Virtualization Security Market Revenue (Million) Forecast, by Application 2019 & 2032
- Table 12: Global Virtualization Security Market Revenue Million Forecast, by Country 2019 & 2032
- Table 13: China Virtualization Security Market Revenue (Million) Forecast, by Application 2019 & 2032
- Table 14: Japan Virtualization Security Market Revenue (Million) Forecast, by Application 2019 & 2032
- Table 15: Australia Virtualization Security Market Revenue (Million) Forecast, by Application 2019 & 2032
- Table 16: Global Virtualization Security Market Revenue Million Forecast, by Country 2019 & 2032
- Table 17: Mexico Virtualization Security Market Revenue (Million) Forecast, by Application 2019 & 2032
- Table 18: Brazil Virtualization Security Market Revenue (Million) Forecast, by Application 2019 & 2032
- Table 19: Global Virtualization Security Market Revenue Million Forecast, by Country 2019 & 2032
- Table 20: Virtualization Security Market Revenue (Million) Forecast, by Application 2019 & 2032
- Table 21: Global Virtualization Security Market Revenue Million Forecast, by Type 2019 & 2032
- Table 22: Global Virtualization Security Market Revenue Million Forecast, by End-user Application 2019 & 2032
- Table 23: Global Virtualization Security Market Revenue Million Forecast, by Country 2019 & 2032
- Table 24: United States Virtualization Security Market Revenue (Million) Forecast, by Application 2019 & 2032
- Table 25: Canada Virtualization Security Market Revenue (Million) Forecast, by Application 2019 & 2032
- Table 26: Global Virtualization Security Market Revenue Million Forecast, by Type 2019 & 2032
- Table 27: Global Virtualization Security Market Revenue Million Forecast, by End-user Application 2019 & 2032
- Table 28: Global Virtualization Security Market Revenue Million Forecast, by Country 2019 & 2032
- Table 29: United Kingdom Virtualization Security Market Revenue (Million) Forecast, by Application 2019 & 2032
- Table 30: Germany Virtualization Security Market Revenue (Million) Forecast, by Application 2019 & 2032
- Table 31: France Virtualization Security Market Revenue (Million) Forecast, by Application 2019 & 2032
- Table 32: Global Virtualization Security Market Revenue Million Forecast, by Type 2019 & 2032
- Table 33: Global Virtualization Security Market Revenue Million Forecast, by End-user Application 2019 & 2032
- Table 34: Global Virtualization Security Market Revenue Million Forecast, by Country 2019 & 2032
- Table 35: China Virtualization Security Market Revenue (Million) Forecast, by Application 2019 & 2032
- Table 36: Japan Virtualization Security Market Revenue (Million) Forecast, by Application 2019 & 2032
- Table 37: Global Virtualization Security Market Revenue Million Forecast, by Type 2019 & 2032
- Table 38: Global Virtualization Security Market Revenue Million Forecast, by End-user Application 2019 & 2032
- Table 39: Global Virtualization Security Market Revenue Million Forecast, by Country 2019 & 2032
- Table 40: Global Virtualization Security Market Revenue Million Forecast, by Type 2019 & 2032
- Table 41: Global Virtualization Security Market Revenue Million Forecast, by End-user Application 2019 & 2032
- Table 42: Global Virtualization Security Market Revenue Million Forecast, by Country 2019 & 2032
- Table 43: Mexico Virtualization Security Market Revenue (Million) Forecast, by Application 2019 & 2032
- Table 44: Brazil Virtualization Security Market Revenue (Million) Forecast, by Application 2019 & 2032
- Table 45: Global Virtualization Security Market Revenue Million Forecast, by Type 2019 & 2032
- Table 46: Global Virtualization Security Market Revenue Million Forecast, by End-user Application 2019 & 2032
- Table 47: Global Virtualization Security Market Revenue Million Forecast, by Country 2019 & 2032
Frequently Asked Questions
1. What is the projected Compound Annual Growth Rate (CAGR) of the Virtualization Security Market?
The projected CAGR is approximately 15.20%.
2. Which companies are prominent players in the Virtualization Security Market?
Key companies in the market include Oracle corporatio, Trend Micro Inc, Telefonaktiebolaget LM Ericsson, Broadcom Inc, Hewlett Packard Enterprise Development LP, Dell Inc, Altor Networks, VMware Inc.
3. What are the main segments of the Virtualization Security Market?
The market segments include Type, End-user Application.
4. Can you provide details about the market size?
The market size is estimated to be USD 1.71 Million as of 2022.
5. What are some drivers contributing to market growth?
Rapid Increase in Data Generated to Witness the Growth.
6. What are the notable trends driving market growth?
IT & Telecom is Expected to Hold a Major Market Share.
7. Are there any restraints impacting market growth?
High Up-front Costs Involved.
8. Can you provide examples of recent developments in the market?
August 2023: Lenovo and VMware expanded their partnership to bring new NVIDIA-powered turnkey generative AI and multi-cloud solutions to every business. They will deliver modern hybrid multi-cloud capabilities to mid-size companies and help customers more easily harness data to empower their intelligent transformation.
9. What pricing options are available for accessing the report?
Pricing options include single-user, multi-user, and enterprise licenses priced at USD 4750, USD 5250, and USD 8750 respectively.
10. Is the market size provided in terms of value or volume?
The market size is provided in terms of value, measured in Million.
11. Are there any specific market keywords associated with the report?
Yes, the market keyword associated with the report is "Virtualization Security Market," which aids in identifying and referencing the specific market segment covered.
12. How do I determine which pricing option suits my needs best?
The pricing options vary based on user requirements and access needs. Individual users may opt for single-user licenses, while businesses requiring broader access may choose multi-user or enterprise licenses for cost-effective access to the report.
13. Are there any additional resources or data provided in the Virtualization Security Market report?
While the report offers comprehensive insights, it's advisable to review the specific contents or supplementary materials provided to ascertain if additional resources or data are available.
14. How can I stay updated on further developments or reports in the Virtualization Security Market?
To stay informed about further developments, trends, and reports in the Virtualization Security Market, consider subscribing to industry newsletters, following relevant companies and organizations, or regularly checking reputable industry news sources and publications.
Methodology
Step 1 - Identification of Relevant Samples Size from Population Database


Step 2 - Approaches for Defining Global Market Size (Value, Volume* & Price*)

Note*: In applicable scenarios
Step 3 - Data Sources
Primary Research
- Web Analytics
- Survey Reports
- Research Institute
- Latest Research Reports
- Opinion Leaders
Secondary Research
- Annual Reports
- White Paper
- Latest Press Release
- Industry Association
- Paid Database
- Investor Presentations

Step 4 - Data Triangulation
Involves using different sources of information in order to increase the validity of a study
These sources are likely to be stakeholders in a program - participants, other researchers, program staff, other community members, and so on.
Then we put all data in single framework & apply various statistical tools to find out the dynamic on the market.
During the analysis stage, feedback from the stakeholder groups would be compared to determine areas of agreement as well as areas of divergence
