

Key Insights
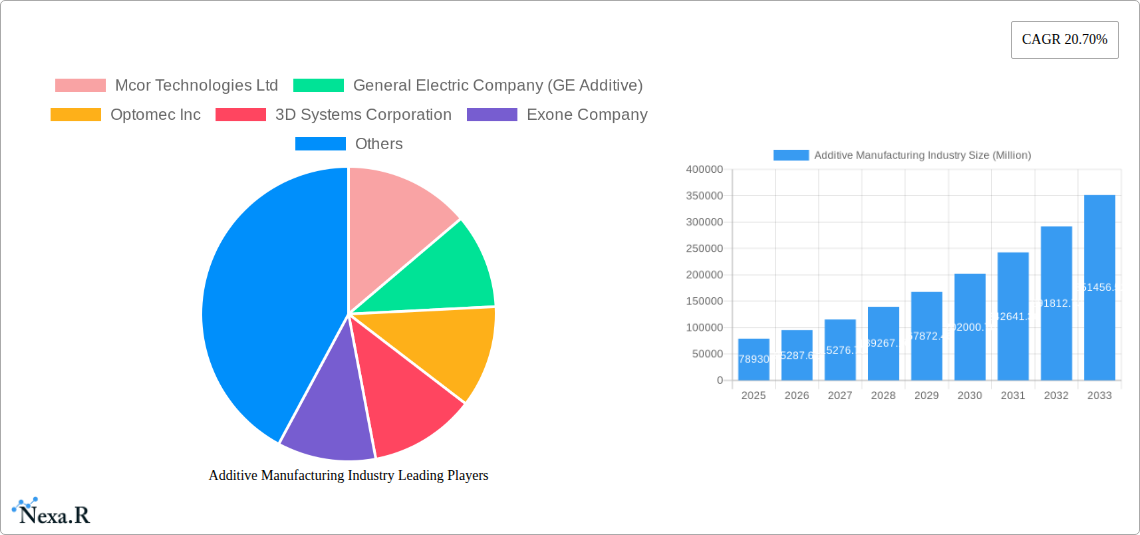
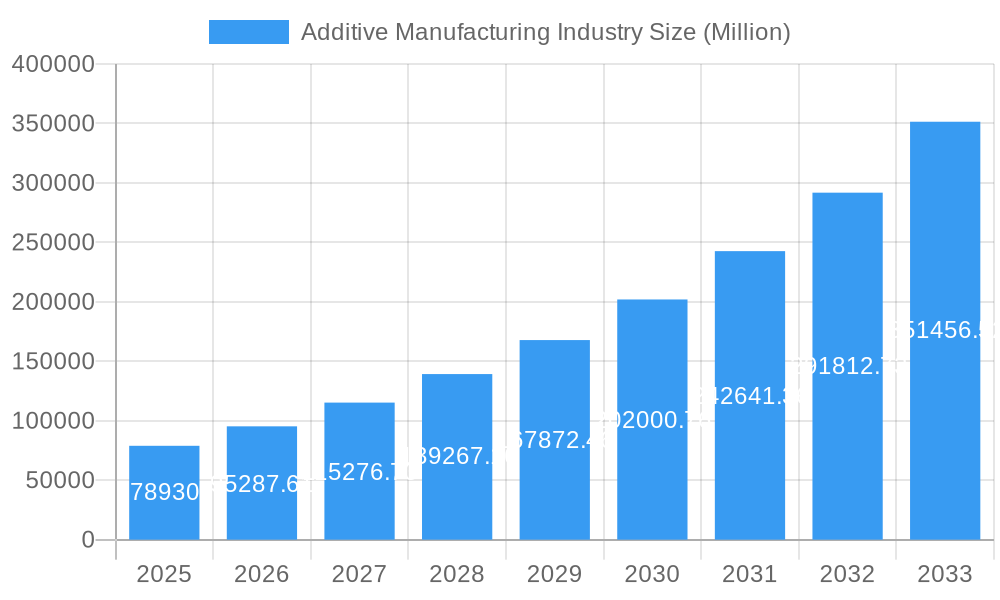
The Additive Manufacturing (AM) industry, also known as 3D printing, is experiencing robust growth, projected to reach a market size of $78.93 billion in 2025, expanding at a Compound Annual Growth Rate (CAGR) of 20.70%. This expansion is driven by several key factors. Firstly, increasing adoption across diverse sectors like aerospace & defense, automotive, and healthcare is fueling demand. These industries are leveraging AM's capabilities for rapid prototyping, customized part production, and lightweighting initiatives, leading to cost savings and improved product performance. Secondly, technological advancements in printing materials, particularly the expansion beyond plastics to encompass metals and ceramics, are opening new application possibilities and broadening the market's reach. The development of more precise and efficient printing technologies, like Stereo Lithography (SLA) and Selective Laser Melting (SLM), are also contributing to this growth. Finally, the increasing availability of sophisticated software solutions streamlining the design and manufacturing processes is simplifying AM adoption and further stimulating industry expansion.
Additive Manufacturing Industry Market Size (In Billion)
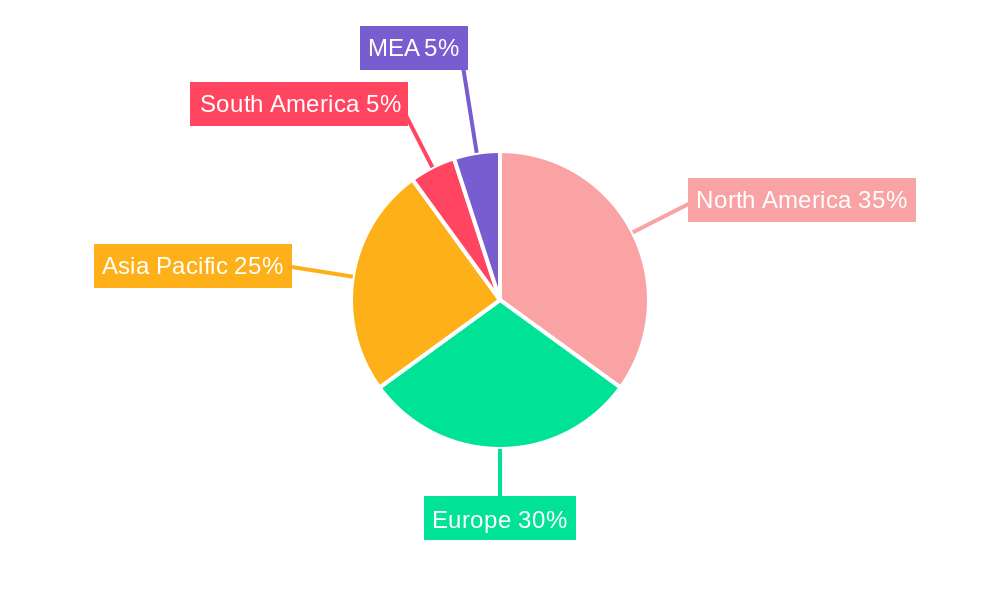
Looking ahead, the forecast period (2025-2033) anticipates continued significant growth, driven by ongoing technological innovation and expanding applications. While challenges remain, such as the high initial investment costs associated with some AM technologies and the need for skilled operators, the overall trend points toward sustained market expansion. Regional growth will be uneven, with North America and Europe maintaining significant market shares, while Asia-Pacific is poised for rapid expansion due to increasing manufacturing activity and government support for technological advancement. The competitive landscape is dynamic, with established players like 3D Systems and Stratasys alongside emerging companies innovating in materials and processes, ensuring a vibrant and evolving market. Specific segments like metal-based AM are expected to witness particularly strong growth, driven by demand from high-value industries.
Additive Manufacturing Industry Company Market Share
This comprehensive report provides an in-depth analysis of the Additive Manufacturing (3D printing) industry, encompassing market dynamics, growth trends, dominant segments, and key players. The study period spans from 2019 to 2033, with 2025 serving as the base and estimated year. The report offers invaluable insights for industry professionals, investors, and strategic decision-makers seeking to navigate this rapidly evolving landscape. The total market size is projected to reach xx Million units by 2033.
Additive Manufacturing Industry Market Dynamics & Structure
The additive manufacturing market is characterized by a moderately concentrated landscape with several key players holding significant market share. Technological innovation, driven by advancements in materials science and software, is a major growth driver. Regulatory frameworks, varying across regions, influence adoption rates and product development. Competitive substitutes, such as traditional manufacturing methods, pose ongoing challenges, but the unique capabilities of additive manufacturing, such as customized designs and complex geometries, are creating new market opportunities. End-user demographics are expanding across sectors, while mergers and acquisitions (M&A) activity is consolidating market power.
- Market Concentration: The top 10 players hold an estimated xx% market share in 2025.
- Technological Innovation: Continuous advancements in printing technologies (e.g., multi-material printing, improved resolution) are driving growth.
- Regulatory Landscape: Varying regulations regarding safety and material certifications impact market penetration in different regions.
- M&A Activity: The number of M&A deals in the sector averaged xx per year between 2019 and 2024.
- Innovation Barriers: High initial investment costs and skill requirements for operation can hinder widespread adoption.
Additive Manufacturing Industry Growth Trends & Insights
The additive manufacturing market experienced significant growth during the historical period (2019-2024), with a CAGR of xx%. This growth is attributed to increasing adoption across diverse end-user industries, technological advancements enabling higher precision and efficiency, and the rising demand for customized and complex products. Market penetration remains relatively low in several sectors, representing substantial growth potential. Consumer behavior shifts towards on-demand manufacturing and personalized products are further fueling market expansion. The forecast period (2025-2033) anticipates sustained growth, driven by the increasing affordability of 3D printers, new material development, and expanding applications in emerging sectors. By 2033, the market is projected to reach xx Million units, with a CAGR of xx% from 2025.
Dominant Regions, Countries, or Segments in Additive Manufacturing Industry
North America currently holds the largest market share in the additive manufacturing industry, followed by Europe and Asia-Pacific. Within technology segments, Fused Deposition Modelling (FDM) and Stereolithography (SLA) dominate due to their relatively lower cost and ease of use. However, Laser Sintering and Binder Jetting Printing are experiencing rapid growth due to their ability to produce high-quality metal parts. The aerospace and defense sector exhibits high adoption rates due to the need for lightweight and customized components. The automotive industry is also a significant end-user, driven by the demand for tooling and rapid prototyping. Metal materials are gaining traction due to their applicability in various industries, particularly aerospace and healthcare.
- Regional Dominance: North America's dominance is attributed to strong R&D infrastructure, early adoption, and a large aerospace and defense sector.
- Technological Segment Leadership: FDM and SLA maintain high market share due to cost-effectiveness, while Laser Sintering and Binder Jetting show strong growth potential.
- End-User Sector Growth: Aerospace & Defense, Healthcare, and Automotive are driving significant demand, followed by industrial applications.
- Material Type: Metal and plastic materials dominate, reflecting diverse applications across industries.
Additive Manufacturing Industry Product Landscape
The additive manufacturing industry showcases a wide range of products, encompassing diverse printing technologies (SLA, FDM, SLS, etc.), materials (plastics, metals, ceramics), and software solutions. Product innovations focus on enhanced resolution, speed, and material compatibility. Unique selling propositions frequently center around ease of use, cost-effectiveness, and specific material capabilities. Technological advancements drive improved precision, higher throughput, and the integration of AI for process optimization. Software development is focusing on intuitive design tools and streamlined workflows.
Key Drivers, Barriers & Challenges in Additive Manufacturing Industry
Key Drivers:
- Increasing demand for customized products and personalized manufacturing.
- Technological advancements improving printing speed, accuracy, and material selection.
- Growing investments in R&D and infrastructure development.
- Government initiatives promoting adoption of additive manufacturing technologies.
Challenges and Restraints:
- High initial capital investment costs for advanced systems.
- Skill gap in operating and maintaining advanced equipment.
- Concerns regarding material consistency and reliability in some technologies.
- Supply chain issues impacting material availability and cost. The impact of these supply chain issues is estimated to have reduced market growth by xx% in 2024.
Emerging Opportunities in Additive Manufacturing Industry
Emerging opportunities are abundant in additive manufacturing. Untapped markets include personalized medicine, bioprinting, and the production of customized consumer goods. Innovative applications include the creation of complex geometries for lightweighting and structural optimization in aerospace and automotive industries. Evolving consumer preferences towards sustainable and on-demand manufacturing are further driving growth.
Growth Accelerators in the Additive Manufacturing Industry
Several factors will accelerate long-term growth in the additive manufacturing industry. Technological breakthroughs, such as multi-material printing and advanced materials development, will drive efficiency gains and expand application potential. Strategic partnerships between technology providers and end-users will foster innovation and accelerate market penetration. Market expansion strategies targeting underserved sectors will further fuel growth.
Key Players Shaping the Additive Manufacturing Industry Market
- Mcor Technologies Ltd
- General Electric Company (GE Additive)
- Optomec Inc
- 3D Systems Corporation
- Exone Company
- SLM Solutions Group AG
- EOS GmbH
- Materialise NV
- Stratasys Ltd
- EnvisionTEC GmbH
Notable Milestones in Additive Manufacturing Industry Sector
- July 2022: Toyota began producing and selling stock parts using HP Multi Jet Fusion 3D printing, optimizing design and lead times.
- October 2022: GE Additive launched its Series 3 binder jet platform for industrial-scale metal part production, achieving 15% fuel efficiency improvement over standard parts (140,000+ units manufactured).
- March 2023: Merz Dental partnered with Nexa 3D, expanding access to fast and accurate desktop 3D printing for dental and engineering applications in Germany.
In-Depth Additive Manufacturing Industry Market Outlook
The additive manufacturing industry is poised for sustained growth driven by technological innovation, expanding applications, and increased affordability. Strategic partnerships and market expansion into new sectors will unlock significant potential. The future will be characterized by more advanced materials, higher printing speeds, and increasingly sophisticated software solutions, leading to further market penetration across diverse industries. The long-term outlook is highly positive, with substantial opportunities for growth and innovation.
Additive Manufacturing Industry Segmentation
-
1. Technology
- 1.1. Stereo Lithography
- 1.2. Fused Deposition Modelling
- 1.3. Laser Sintering
- 1.4. Binder Jetting Printing
- 1.5. Other Technologies
-
2. End User
- 2.1. Aerospace and Defense
- 2.2. Automotive
- 2.3. Healthcare
- 2.4. Industrial
- 2.5. Other End Users
-
3. Material
- 3.1. Plastic
- 3.2. Metals
- 3.3. Ceramics
Additive Manufacturing Industry Segmentation By Geography
-
1. North America
- 1.1. United States
- 1.2. Canada
-
2. Europe
- 2.1. United Kingdom
- 2.2. Germany
- 2.3. France
- 2.4. Rest of Europe
-
3. Asia Pacific
- 3.1. China
- 3.2. Japan
- 3.3. India
- 3.4. Rest of Asia Pacific
-
4. Latin America
- 4.1. Brazil
- 4.2. Mexico
- 4.3. Argentina
- 4.4. Rest of Latin America
- 5. Middle East
-
6. UAE
- 6.1. Saudi Arabia
- 6.2. Israel
- 6.3. South Africa
- 6.4. Rest of Middle East
Additive Manufacturing Industry Regional Market Share
Geographic Coverage of Additive Manufacturing Industry
Additive Manufacturing Industry REPORT HIGHLIGHTS
| Aspects | Details |
|---|---|
| Study Period | 2020-2034 |
| Base Year | 2025 |
| Estimated Year | 2026 |
| Forecast Period | 2026-2034 |
| Historical Period | 2020-2025 |
| Growth Rate | CAGR of 20.70% from 2020-2034 |
| Segmentation |
|
Table of Contents
- 1. Introduction
- 1.1. Research Scope
- 1.2. Market Segmentation
- 1.3. Research Methodology
- 1.4. Definitions and Assumptions
- 2. Executive Summary
- 2.1. Introduction
- 3. Market Dynamics
- 3.1. Introduction
- 3.2. Market Drivers
- 3.2.1. New and Improved Technologies to Drive Product Customization; Demand for Lightweight Construction in Automotive and Aerospace Industries
- 3.3. Market Restrains
- 3.3.1. Concerns over Intellectual Property Protection
- 3.4. Market Trends
- 3.4.1. Automotive to is expected Hold a Significant Share
- 4. Market Factor Analysis
- 4.1. Porters Five Forces
- 4.2. Supply/Value Chain
- 4.3. PESTEL analysis
- 4.4. Market Entropy
- 4.5. Patent/Trademark Analysis
- 5. Global Additive Manufacturing Industry Analysis, Insights and Forecast, 2020-2032
- 5.1. Market Analysis, Insights and Forecast - by Technology
- 5.1.1. Stereo Lithography
- 5.1.2. Fused Deposition Modelling
- 5.1.3. Laser Sintering
- 5.1.4. Binder Jetting Printing
- 5.1.5. Other Technologies
- 5.2. Market Analysis, Insights and Forecast - by End User
- 5.2.1. Aerospace and Defense
- 5.2.2. Automotive
- 5.2.3. Healthcare
- 5.2.4. Industrial
- 5.2.5. Other End Users
- 5.3. Market Analysis, Insights and Forecast - by Material
- 5.3.1. Plastic
- 5.3.2. Metals
- 5.3.3. Ceramics
- 5.4. Market Analysis, Insights and Forecast - by Region
- 5.4.1. North America
- 5.4.2. Europe
- 5.4.3. Asia Pacific
- 5.4.4. Latin America
- 5.4.5. Middle East
- 5.4.6. UAE
- 5.1. Market Analysis, Insights and Forecast - by Technology
- 6. North America Additive Manufacturing Industry Analysis, Insights and Forecast, 2020-2032
- 6.1. Market Analysis, Insights and Forecast - by Technology
- 6.1.1. Stereo Lithography
- 6.1.2. Fused Deposition Modelling
- 6.1.3. Laser Sintering
- 6.1.4. Binder Jetting Printing
- 6.1.5. Other Technologies
- 6.2. Market Analysis, Insights and Forecast - by End User
- 6.2.1. Aerospace and Defense
- 6.2.2. Automotive
- 6.2.3. Healthcare
- 6.2.4. Industrial
- 6.2.5. Other End Users
- 6.3. Market Analysis, Insights and Forecast - by Material
- 6.3.1. Plastic
- 6.3.2. Metals
- 6.3.3. Ceramics
- 6.1. Market Analysis, Insights and Forecast - by Technology
- 7. Europe Additive Manufacturing Industry Analysis, Insights and Forecast, 2020-2032
- 7.1. Market Analysis, Insights and Forecast - by Technology
- 7.1.1. Stereo Lithography
- 7.1.2. Fused Deposition Modelling
- 7.1.3. Laser Sintering
- 7.1.4. Binder Jetting Printing
- 7.1.5. Other Technologies
- 7.2. Market Analysis, Insights and Forecast - by End User
- 7.2.1. Aerospace and Defense
- 7.2.2. Automotive
- 7.2.3. Healthcare
- 7.2.4. Industrial
- 7.2.5. Other End Users
- 7.3. Market Analysis, Insights and Forecast - by Material
- 7.3.1. Plastic
- 7.3.2. Metals
- 7.3.3. Ceramics
- 7.1. Market Analysis, Insights and Forecast - by Technology
- 8. Asia Pacific Additive Manufacturing Industry Analysis, Insights and Forecast, 2020-2032
- 8.1. Market Analysis, Insights and Forecast - by Technology
- 8.1.1. Stereo Lithography
- 8.1.2. Fused Deposition Modelling
- 8.1.3. Laser Sintering
- 8.1.4. Binder Jetting Printing
- 8.1.5. Other Technologies
- 8.2. Market Analysis, Insights and Forecast - by End User
- 8.2.1. Aerospace and Defense
- 8.2.2. Automotive
- 8.2.3. Healthcare
- 8.2.4. Industrial
- 8.2.5. Other End Users
- 8.3. Market Analysis, Insights and Forecast - by Material
- 8.3.1. Plastic
- 8.3.2. Metals
- 8.3.3. Ceramics
- 8.1. Market Analysis, Insights and Forecast - by Technology
- 9. Latin America Additive Manufacturing Industry Analysis, Insights and Forecast, 2020-2032
- 9.1. Market Analysis, Insights and Forecast - by Technology
- 9.1.1. Stereo Lithography
- 9.1.2. Fused Deposition Modelling
- 9.1.3. Laser Sintering
- 9.1.4. Binder Jetting Printing
- 9.1.5. Other Technologies
- 9.2. Market Analysis, Insights and Forecast - by End User
- 9.2.1. Aerospace and Defense
- 9.2.2. Automotive
- 9.2.3. Healthcare
- 9.2.4. Industrial
- 9.2.5. Other End Users
- 9.3. Market Analysis, Insights and Forecast - by Material
- 9.3.1. Plastic
- 9.3.2. Metals
- 9.3.3. Ceramics
- 9.1. Market Analysis, Insights and Forecast - by Technology
- 10. Middle East Additive Manufacturing Industry Analysis, Insights and Forecast, 2020-2032
- 10.1. Market Analysis, Insights and Forecast - by Technology
- 10.1.1. Stereo Lithography
- 10.1.2. Fused Deposition Modelling
- 10.1.3. Laser Sintering
- 10.1.4. Binder Jetting Printing
- 10.1.5. Other Technologies
- 10.2. Market Analysis, Insights and Forecast - by End User
- 10.2.1. Aerospace and Defense
- 10.2.2. Automotive
- 10.2.3. Healthcare
- 10.2.4. Industrial
- 10.2.5. Other End Users
- 10.3. Market Analysis, Insights and Forecast - by Material
- 10.3.1. Plastic
- 10.3.2. Metals
- 10.3.3. Ceramics
- 10.1. Market Analysis, Insights and Forecast - by Technology
- 11. UAE Additive Manufacturing Industry Analysis, Insights and Forecast, 2020-2032
- 11.1. Market Analysis, Insights and Forecast - by Technology
- 11.1.1. Stereo Lithography
- 11.1.2. Fused Deposition Modelling
- 11.1.3. Laser Sintering
- 11.1.4. Binder Jetting Printing
- 11.1.5. Other Technologies
- 11.2. Market Analysis, Insights and Forecast - by End User
- 11.2.1. Aerospace and Defense
- 11.2.2. Automotive
- 11.2.3. Healthcare
- 11.2.4. Industrial
- 11.2.5. Other End Users
- 11.3. Market Analysis, Insights and Forecast - by Material
- 11.3.1. Plastic
- 11.3.2. Metals
- 11.3.3. Ceramics
- 11.1. Market Analysis, Insights and Forecast - by Technology
- 12. Competitive Analysis
- 12.1. Global Market Share Analysis 2025
- 12.2. Company Profiles
- 12.2.1 Mcor Technologies Ltd
- 12.2.1.1. Overview
- 12.2.1.2. Products
- 12.2.1.3. SWOT Analysis
- 12.2.1.4. Recent Developments
- 12.2.1.5. Financials (Based on Availability)
- 12.2.2 General Electric Company (GE Additive)
- 12.2.2.1. Overview
- 12.2.2.2. Products
- 12.2.2.3. SWOT Analysis
- 12.2.2.4. Recent Developments
- 12.2.2.5. Financials (Based on Availability)
- 12.2.3 Optomec Inc
- 12.2.3.1. Overview
- 12.2.3.2. Products
- 12.2.3.3. SWOT Analysis
- 12.2.3.4. Recent Developments
- 12.2.3.5. Financials (Based on Availability)
- 12.2.4 3D Systems Corporation
- 12.2.4.1. Overview
- 12.2.4.2. Products
- 12.2.4.3. SWOT Analysis
- 12.2.4.4. Recent Developments
- 12.2.4.5. Financials (Based on Availability)
- 12.2.5 Exone Company
- 12.2.5.1. Overview
- 12.2.5.2. Products
- 12.2.5.3. SWOT Analysis
- 12.2.5.4. Recent Developments
- 12.2.5.5. Financials (Based on Availability)
- 12.2.6 SLM Solutions Group AG*List Not Exhaustive
- 12.2.6.1. Overview
- 12.2.6.2. Products
- 12.2.6.3. SWOT Analysis
- 12.2.6.4. Recent Developments
- 12.2.6.5. Financials (Based on Availability)
- 12.2.7 EOS GmbH
- 12.2.7.1. Overview
- 12.2.7.2. Products
- 12.2.7.3. SWOT Analysis
- 12.2.7.4. Recent Developments
- 12.2.7.5. Financials (Based on Availability)
- 12.2.8 Materialise NV
- 12.2.8.1. Overview
- 12.2.8.2. Products
- 12.2.8.3. SWOT Analysis
- 12.2.8.4. Recent Developments
- 12.2.8.5. Financials (Based on Availability)
- 12.2.9 Stratasys Ltd
- 12.2.9.1. Overview
- 12.2.9.2. Products
- 12.2.9.3. SWOT Analysis
- 12.2.9.4. Recent Developments
- 12.2.9.5. Financials (Based on Availability)
- 12.2.10 EnvisionTEC GmbH
- 12.2.10.1. Overview
- 12.2.10.2. Products
- 12.2.10.3. SWOT Analysis
- 12.2.10.4. Recent Developments
- 12.2.10.5. Financials (Based on Availability)
- 12.2.1 Mcor Technologies Ltd
List of Figures
- Figure 1: Global Additive Manufacturing Industry Revenue Breakdown (Million, %) by Region 2025 & 2033
- Figure 2: North America Additive Manufacturing Industry Revenue (Million), by Technology 2025 & 2033
- Figure 3: North America Additive Manufacturing Industry Revenue Share (%), by Technology 2025 & 2033
- Figure 4: North America Additive Manufacturing Industry Revenue (Million), by End User 2025 & 2033
- Figure 5: North America Additive Manufacturing Industry Revenue Share (%), by End User 2025 & 2033
- Figure 6: North America Additive Manufacturing Industry Revenue (Million), by Material 2025 & 2033
- Figure 7: North America Additive Manufacturing Industry Revenue Share (%), by Material 2025 & 2033
- Figure 8: North America Additive Manufacturing Industry Revenue (Million), by Country 2025 & 2033
- Figure 9: North America Additive Manufacturing Industry Revenue Share (%), by Country 2025 & 2033
- Figure 10: Europe Additive Manufacturing Industry Revenue (Million), by Technology 2025 & 2033
- Figure 11: Europe Additive Manufacturing Industry Revenue Share (%), by Technology 2025 & 2033
- Figure 12: Europe Additive Manufacturing Industry Revenue (Million), by End User 2025 & 2033
- Figure 13: Europe Additive Manufacturing Industry Revenue Share (%), by End User 2025 & 2033
- Figure 14: Europe Additive Manufacturing Industry Revenue (Million), by Material 2025 & 2033
- Figure 15: Europe Additive Manufacturing Industry Revenue Share (%), by Material 2025 & 2033
- Figure 16: Europe Additive Manufacturing Industry Revenue (Million), by Country 2025 & 2033
- Figure 17: Europe Additive Manufacturing Industry Revenue Share (%), by Country 2025 & 2033
- Figure 18: Asia Pacific Additive Manufacturing Industry Revenue (Million), by Technology 2025 & 2033
- Figure 19: Asia Pacific Additive Manufacturing Industry Revenue Share (%), by Technology 2025 & 2033
- Figure 20: Asia Pacific Additive Manufacturing Industry Revenue (Million), by End User 2025 & 2033
- Figure 21: Asia Pacific Additive Manufacturing Industry Revenue Share (%), by End User 2025 & 2033
- Figure 22: Asia Pacific Additive Manufacturing Industry Revenue (Million), by Material 2025 & 2033
- Figure 23: Asia Pacific Additive Manufacturing Industry Revenue Share (%), by Material 2025 & 2033
- Figure 24: Asia Pacific Additive Manufacturing Industry Revenue (Million), by Country 2025 & 2033
- Figure 25: Asia Pacific Additive Manufacturing Industry Revenue Share (%), by Country 2025 & 2033
- Figure 26: Latin America Additive Manufacturing Industry Revenue (Million), by Technology 2025 & 2033
- Figure 27: Latin America Additive Manufacturing Industry Revenue Share (%), by Technology 2025 & 2033
- Figure 28: Latin America Additive Manufacturing Industry Revenue (Million), by End User 2025 & 2033
- Figure 29: Latin America Additive Manufacturing Industry Revenue Share (%), by End User 2025 & 2033
- Figure 30: Latin America Additive Manufacturing Industry Revenue (Million), by Material 2025 & 2033
- Figure 31: Latin America Additive Manufacturing Industry Revenue Share (%), by Material 2025 & 2033
- Figure 32: Latin America Additive Manufacturing Industry Revenue (Million), by Country 2025 & 2033
- Figure 33: Latin America Additive Manufacturing Industry Revenue Share (%), by Country 2025 & 2033
- Figure 34: Middle East Additive Manufacturing Industry Revenue (Million), by Technology 2025 & 2033
- Figure 35: Middle East Additive Manufacturing Industry Revenue Share (%), by Technology 2025 & 2033
- Figure 36: Middle East Additive Manufacturing Industry Revenue (Million), by End User 2025 & 2033
- Figure 37: Middle East Additive Manufacturing Industry Revenue Share (%), by End User 2025 & 2033
- Figure 38: Middle East Additive Manufacturing Industry Revenue (Million), by Material 2025 & 2033
- Figure 39: Middle East Additive Manufacturing Industry Revenue Share (%), by Material 2025 & 2033
- Figure 40: Middle East Additive Manufacturing Industry Revenue (Million), by Country 2025 & 2033
- Figure 41: Middle East Additive Manufacturing Industry Revenue Share (%), by Country 2025 & 2033
- Figure 42: UAE Additive Manufacturing Industry Revenue (Million), by Technology 2025 & 2033
- Figure 43: UAE Additive Manufacturing Industry Revenue Share (%), by Technology 2025 & 2033
- Figure 44: UAE Additive Manufacturing Industry Revenue (Million), by End User 2025 & 2033
- Figure 45: UAE Additive Manufacturing Industry Revenue Share (%), by End User 2025 & 2033
- Figure 46: UAE Additive Manufacturing Industry Revenue (Million), by Material 2025 & 2033
- Figure 47: UAE Additive Manufacturing Industry Revenue Share (%), by Material 2025 & 2033
- Figure 48: UAE Additive Manufacturing Industry Revenue (Million), by Country 2025 & 2033
- Figure 49: UAE Additive Manufacturing Industry Revenue Share (%), by Country 2025 & 2033
List of Tables
- Table 1: Global Additive Manufacturing Industry Revenue Million Forecast, by Technology 2020 & 2033
- Table 2: Global Additive Manufacturing Industry Revenue Million Forecast, by End User 2020 & 2033
- Table 3: Global Additive Manufacturing Industry Revenue Million Forecast, by Material 2020 & 2033
- Table 4: Global Additive Manufacturing Industry Revenue Million Forecast, by Region 2020 & 2033
- Table 5: Global Additive Manufacturing Industry Revenue Million Forecast, by Technology 2020 & 2033
- Table 6: Global Additive Manufacturing Industry Revenue Million Forecast, by End User 2020 & 2033
- Table 7: Global Additive Manufacturing Industry Revenue Million Forecast, by Material 2020 & 2033
- Table 8: Global Additive Manufacturing Industry Revenue Million Forecast, by Country 2020 & 2033
- Table 9: United States Additive Manufacturing Industry Revenue (Million) Forecast, by Application 2020 & 2033
- Table 10: Canada Additive Manufacturing Industry Revenue (Million) Forecast, by Application 2020 & 2033
- Table 11: Global Additive Manufacturing Industry Revenue Million Forecast, by Technology 2020 & 2033
- Table 12: Global Additive Manufacturing Industry Revenue Million Forecast, by End User 2020 & 2033
- Table 13: Global Additive Manufacturing Industry Revenue Million Forecast, by Material 2020 & 2033
- Table 14: Global Additive Manufacturing Industry Revenue Million Forecast, by Country 2020 & 2033
- Table 15: United Kingdom Additive Manufacturing Industry Revenue (Million) Forecast, by Application 2020 & 2033
- Table 16: Germany Additive Manufacturing Industry Revenue (Million) Forecast, by Application 2020 & 2033
- Table 17: France Additive Manufacturing Industry Revenue (Million) Forecast, by Application 2020 & 2033
- Table 18: Rest of Europe Additive Manufacturing Industry Revenue (Million) Forecast, by Application 2020 & 2033
- Table 19: Global Additive Manufacturing Industry Revenue Million Forecast, by Technology 2020 & 2033
- Table 20: Global Additive Manufacturing Industry Revenue Million Forecast, by End User 2020 & 2033
- Table 21: Global Additive Manufacturing Industry Revenue Million Forecast, by Material 2020 & 2033
- Table 22: Global Additive Manufacturing Industry Revenue Million Forecast, by Country 2020 & 2033
- Table 23: China Additive Manufacturing Industry Revenue (Million) Forecast, by Application 2020 & 2033
- Table 24: Japan Additive Manufacturing Industry Revenue (Million) Forecast, by Application 2020 & 2033
- Table 25: India Additive Manufacturing Industry Revenue (Million) Forecast, by Application 2020 & 2033
- Table 26: Rest of Asia Pacific Additive Manufacturing Industry Revenue (Million) Forecast, by Application 2020 & 2033
- Table 27: Global Additive Manufacturing Industry Revenue Million Forecast, by Technology 2020 & 2033
- Table 28: Global Additive Manufacturing Industry Revenue Million Forecast, by End User 2020 & 2033
- Table 29: Global Additive Manufacturing Industry Revenue Million Forecast, by Material 2020 & 2033
- Table 30: Global Additive Manufacturing Industry Revenue Million Forecast, by Country 2020 & 2033
- Table 31: Brazil Additive Manufacturing Industry Revenue (Million) Forecast, by Application 2020 & 2033
- Table 32: Mexico Additive Manufacturing Industry Revenue (Million) Forecast, by Application 2020 & 2033
- Table 33: Argentina Additive Manufacturing Industry Revenue (Million) Forecast, by Application 2020 & 2033
- Table 34: Rest of Latin America Additive Manufacturing Industry Revenue (Million) Forecast, by Application 2020 & 2033
- Table 35: Global Additive Manufacturing Industry Revenue Million Forecast, by Technology 2020 & 2033
- Table 36: Global Additive Manufacturing Industry Revenue Million Forecast, by End User 2020 & 2033
- Table 37: Global Additive Manufacturing Industry Revenue Million Forecast, by Material 2020 & 2033
- Table 38: Global Additive Manufacturing Industry Revenue Million Forecast, by Country 2020 & 2033
- Table 39: Global Additive Manufacturing Industry Revenue Million Forecast, by Technology 2020 & 2033
- Table 40: Global Additive Manufacturing Industry Revenue Million Forecast, by End User 2020 & 2033
- Table 41: Global Additive Manufacturing Industry Revenue Million Forecast, by Material 2020 & 2033
- Table 42: Global Additive Manufacturing Industry Revenue Million Forecast, by Country 2020 & 2033
- Table 43: Saudi Arabia Additive Manufacturing Industry Revenue (Million) Forecast, by Application 2020 & 2033
- Table 44: Israel Additive Manufacturing Industry Revenue (Million) Forecast, by Application 2020 & 2033
- Table 45: South Africa Additive Manufacturing Industry Revenue (Million) Forecast, by Application 2020 & 2033
- Table 46: Rest of Middle East Additive Manufacturing Industry Revenue (Million) Forecast, by Application 2020 & 2033
Frequently Asked Questions
1. What is the projected Compound Annual Growth Rate (CAGR) of the Additive Manufacturing Industry?
The projected CAGR is approximately 20.70%.
2. Which companies are prominent players in the Additive Manufacturing Industry?
Key companies in the market include Mcor Technologies Ltd, General Electric Company (GE Additive), Optomec Inc, 3D Systems Corporation, Exone Company, SLM Solutions Group AG*List Not Exhaustive, EOS GmbH, Materialise NV, Stratasys Ltd, EnvisionTEC GmbH.
3. What are the main segments of the Additive Manufacturing Industry?
The market segments include Technology, End User, Material.
4. Can you provide details about the market size?
The market size is estimated to be USD 78.93 Million as of 2022.
5. What are some drivers contributing to market growth?
New and Improved Technologies to Drive Product Customization; Demand for Lightweight Construction in Automotive and Aerospace Industries.
6. What are the notable trends driving market growth?
Automotive to is expected Hold a Significant Share.
7. Are there any restraints impacting market growth?
Concerns over Intellectual Property Protection.
8. Can you provide examples of recent developments in the market?
March 2023 - Merz Dental, a digital dentistry company, partnered with Nexa 3D, the polymer 3D printing leader. The partnership will support the consumers of Nexa 3D throughout Germany. The 3D printing platform is fast and accurate to increase professional and dental desktop 3D printing use. The desktop 3D printer serves a wide variety of engineering and dental applications, including orthodontic models, splints, and surgical guides
9. What pricing options are available for accessing the report?
Pricing options include single-user, multi-user, and enterprise licenses priced at USD 4750, USD 5250, and USD 8750 respectively.
10. Is the market size provided in terms of value or volume?
The market size is provided in terms of value, measured in Million.
11. Are there any specific market keywords associated with the report?
Yes, the market keyword associated with the report is "Additive Manufacturing Industry," which aids in identifying and referencing the specific market segment covered.
12. How do I determine which pricing option suits my needs best?
The pricing options vary based on user requirements and access needs. Individual users may opt for single-user licenses, while businesses requiring broader access may choose multi-user or enterprise licenses for cost-effective access to the report.
13. Are there any additional resources or data provided in the Additive Manufacturing Industry report?
While the report offers comprehensive insights, it's advisable to review the specific contents or supplementary materials provided to ascertain if additional resources or data are available.
14. How can I stay updated on further developments or reports in the Additive Manufacturing Industry?
To stay informed about further developments, trends, and reports in the Additive Manufacturing Industry, consider subscribing to industry newsletters, following relevant companies and organizations, or regularly checking reputable industry news sources and publications.
Methodology
Step 1 - Identification of Relevant Samples Size from Population Database


Step 2 - Approaches for Defining Global Market Size (Value, Volume* & Price*)

Note*: In applicable scenarios
Step 3 - Data Sources
Primary Research
- Web Analytics
- Survey Reports
- Research Institute
- Latest Research Reports
- Opinion Leaders
Secondary Research
- Annual Reports
- White Paper
- Latest Press Release
- Industry Association
- Paid Database
- Investor Presentations

Step 4 - Data Triangulation
Involves using different sources of information in order to increase the validity of a study
These sources are likely to be stakeholders in a program - participants, other researchers, program staff, other community members, and so on.
Then we put all data in single framework & apply various statistical tools to find out the dynamic on the market.
During the analysis stage, feedback from the stakeholder groups would be compared to determine areas of agreement as well as areas of divergence