

Key Insights
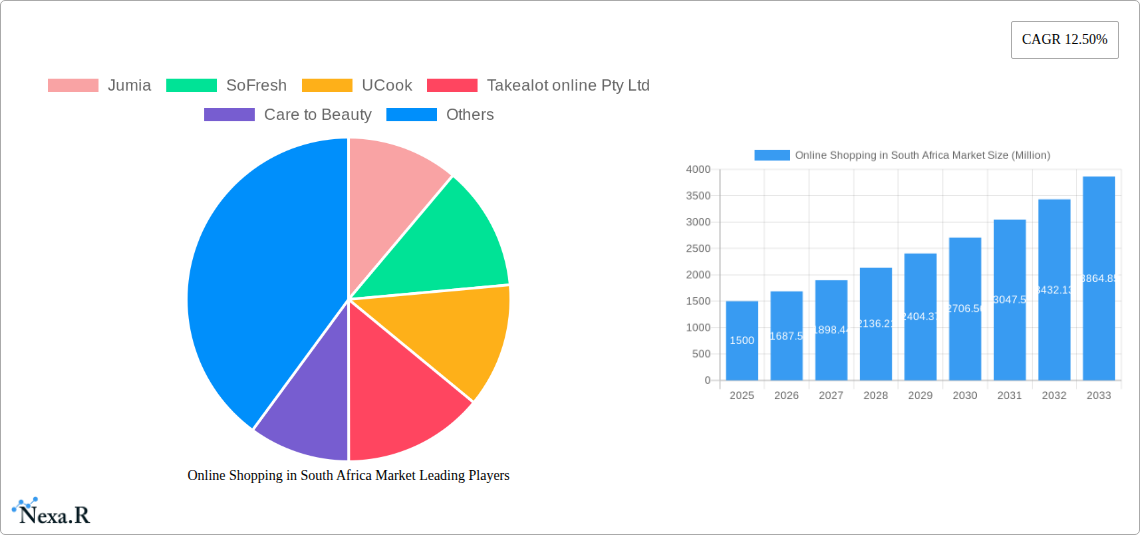
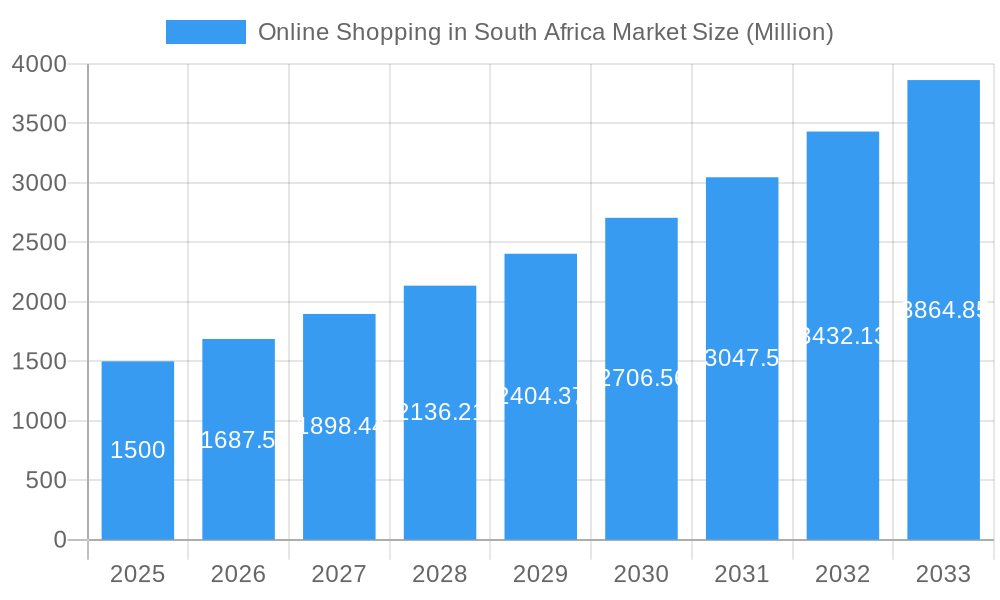
The South African online shopping market, exhibiting a robust Compound Annual Growth Rate (CAGR) of 12.50% from 2019-2024, is poised for continued expansion through 2033. Driven by increasing internet and smartphone penetration, a young and digitally-savvy population, and the convenience offered by e-commerce platforms, the market is experiencing significant growth. Key players like Jumia, Takealot, and Superbalist are contributing to this expansion, offering diverse product categories ranging from fashion and cosmetics to electronics and groceries. The market segmentation by application reveals strong performance across various sectors, indicating a broad appeal among consumers. While challenges such as unreliable infrastructure in certain regions and concerns about online security persist, the overall positive trend suggests a resilient and expanding market. The projected market value for 2025 serves as a strong base for future forecasts, which will be significantly influenced by continued infrastructure improvements, enhanced logistics capabilities, and increased consumer trust in online transactions.
Online Shopping in South Africa Market Market Size (In Billion)
Expanding on this trajectory, the forecasted growth through 2033 hinges on several factors. Government initiatives promoting digital inclusion will play a crucial role, along with continued investment in logistics and payment infrastructure to improve the overall online shopping experience. The emergence of new players and innovative business models, focusing on localized needs and providing seamless customer journeys, will further stimulate growth. Increased competition will likely drive down prices and enhance consumer choice, further solidifying the position of online shopping as a primary retail channel in South Africa. However, careful attention must be paid to mitigating the risks associated with cybersecurity threats and addressing potential regulatory hurdles to ensure sustainable growth in the coming years.
Online Shopping in South Africa Market Company Market Share
Online Shopping in South Africa Market Report: 2019-2033
This comprehensive report provides a detailed analysis of the burgeoning online shopping market in South Africa, covering the period 2019-2033. It delves into market dynamics, growth trends, key players, and future opportunities, offering invaluable insights for industry professionals, investors, and strategic planners. The report uses 2025 as its base and estimated year, with a forecast period spanning 2025-2033 and a historical period covering 2019-2024. All values are presented in million units.
Online Shopping in South Africa Market Dynamics & Structure
This section analyzes the South African online shopping market's structure, encompassing market concentration, technological innovation, regulatory frameworks, competitive substitutes, end-user demographics, and mergers & acquisitions (M&A) activity. The market is characterized by a relatively fragmented landscape, with a few dominant players and numerous smaller niche businesses. Technological innovation, particularly in mobile commerce and logistics, is a key driver.
- Market Concentration: The top 5 players hold an estimated xx% market share in 2025, indicating a moderately concentrated market.
- Technological Innovation: Increased mobile penetration and the adoption of advanced logistics solutions are significant growth catalysts. Barriers include infrastructure limitations in some regions and digital literacy gaps among certain demographics.
- Regulatory Framework: Existing regulations on consumer protection and data privacy impact market operations. Future regulatory changes could significantly alter market dynamics.
- Competitive Substitutes: Traditional brick-and-mortar retail remains a significant competitor, although online shopping's convenience is steadily eroding its market share.
- End-User Demographics: The young and affluent urban population segment is the primary driver of online shopping growth, but expansion into rural areas holds substantial untapped potential.
- M&A Trends: The acquisition of Quench by TFG Ltd in December 2021 exemplifies the growing trend of strategic acquisitions aimed at enhancing logistics and delivery capabilities. The total value of M&A deals within the sector between 2019 and 2024 is estimated at xx million.
Online Shopping in South Africa Market Growth Trends & Insights
The South African online shopping market is experiencing robust growth, driven by increasing internet and smartphone penetration, rising disposable incomes, and evolving consumer preferences. This section provides a detailed analysis of market size evolution, adoption rates, technological disruptions, and consumer behavior shifts. The market size is projected to reach xx million in 2025, growing at a CAGR of xx% during the forecast period (2025-2033). Market penetration is expected to reach xx% by 2033, driven by a combination of factors such as improved digital infrastructure, wider product availability, and increasing trust in online transactions. Technological innovations like improved payment gateways, enhanced user interfaces, and personalized recommendations contribute significantly to this growth. Consumer behavior shifts towards convenience, value, and personalized experiences also drive market expansion.
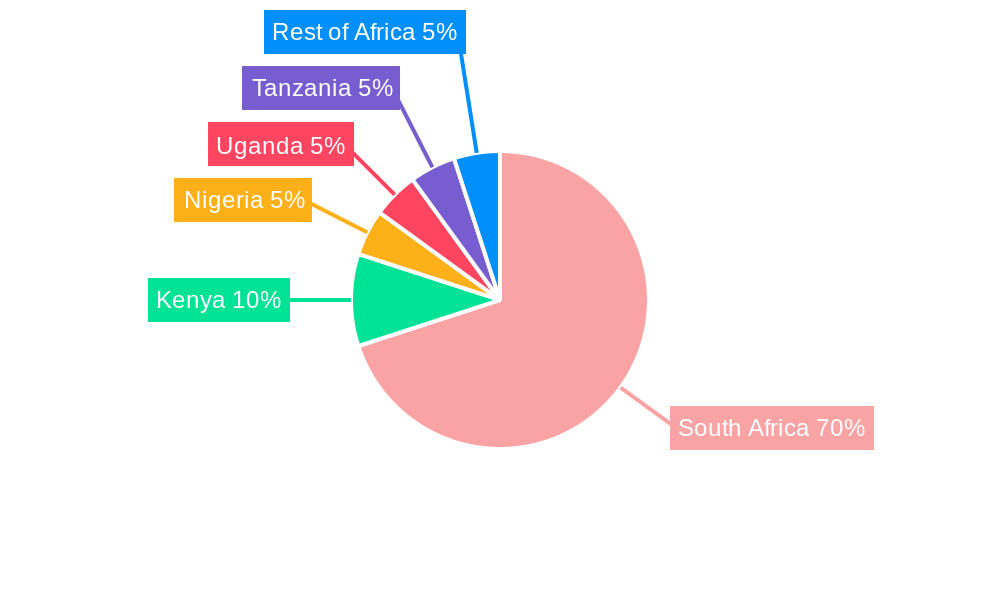
Dominant Regions, Countries, or Segments in Online Shopping in South Africa Market
The major metropolitan areas like Gauteng, Western Cape, and KwaZulu-Natal are currently leading the online shopping market. The growth is primarily driven by a higher concentration of internet users and affluent consumers.
- Key Drivers: High internet penetration, strong purchasing power, and the availability of advanced logistics infrastructure are key factors contributing to the dominance of these regions. Government initiatives promoting digital inclusion also play a crucial role.
- Market Share & Growth Potential: Gauteng holds the largest market share, followed by Western Cape and KwaZulu-Natal. Significant growth potential exists in expanding to less developed regions through targeted marketing campaigns and the improvement of logistics networks. The "by Application" segment details will be provided within the full report.
Online Shopping in South Africa Market Product Landscape
The online shopping market showcases a diverse range of product categories, from electronics and apparel to groceries and beauty products. Significant innovation focuses on enhancing the user experience through personalized recommendations, improved search functionalities, and seamless checkout processes. The rise of mobile-first shopping experiences and the adoption of augmented reality (AR) and virtual reality (VR) technologies are also transforming the product landscape. This leads to enhanced user engagement and increased sales conversion rates.
Key Drivers, Barriers & Challenges in Online Shopping in South Africa Market
Key Drivers: Increased smartphone penetration, rising disposable incomes, and improved internet infrastructure are major drivers. Government initiatives promoting digital inclusion also play a significant role.
Key Challenges: High data costs, limited access to reliable internet in certain areas, and concerns about online security remain significant challenges, resulting in a relatively lower penetration compared to developed countries. Logistics remain a considerable hurdle, particularly for delivering goods to remote areas. These logistical constraints, coupled with anxieties over online security and scams, continue to hold back market growth.
Emerging Opportunities in Online Shopping in South Africa Market
Untapped opportunities exist in expanding online shopping to rural areas through targeted marketing and improved delivery services, expanding into niche product categories, and leveraging the growing adoption of mobile payments. The development of innovative solutions to address logistical challenges and enhance consumer trust can also unlock significant growth potential.
Growth Accelerators in the Online Shopping in South Africa Market Industry
Technological advancements, strategic partnerships, and market expansion strategies are key growth catalysts. The increasing adoption of mobile commerce, AI-powered personalization, and advanced logistics solutions will fuel market expansion. Strategic alliances between online retailers and logistics providers will enhance delivery efficiency and reach. Expansion into previously underserved regions will unlock substantial growth opportunities.
Key Players Shaping the Online Shopping in South Africa Market Market
- Jumia
- SoFresh
- UCook
- Takealot online Pty Ltd
- Care to Beauty
- Superbalist.com
- ToysRUs
- Zando
- Cosmetic SA
- Decathlon
- Evetech Pty Ltd
- List Not Exhaustive
Notable Milestones in Online Shopping in South Africa Market Sector
- April 2021: Amazon announces plans to establish a new African headquarters in Cape Town, signaling a significant investment in the South African market and boosting confidence in the country's e-commerce potential.
- December 2021: TFG Ltd's acquisition of Quench enhances the company's delivery capabilities, strengthening its position in the competitive online retail space.
In-Depth Online Shopping in South Africa Market Market Outlook
The South African online shopping market is poised for sustained growth, driven by a combination of factors including increasing internet and smartphone penetration, rising disposable incomes, and continuous improvements in logistics and infrastructure. Strategic partnerships, technological advancements, and expansion into underserved markets will further propel market growth, creating lucrative opportunities for businesses operating within this dynamic sector. The forecast period promises significant expansion, particularly as the market addresses existing challenges and capitalizes on emerging trends.
Online Shopping in South Africa Market Segmentation
-
1. B2C ecommerce
- 1.1. Market size (GMV) for the period of 2017-2027
-
1.2. Market Segmentation - by Application
- 1.2.1. Beauty and Personal Care
- 1.2.2. Consumer Electronics
- 1.2.3. Fashion and Apparel
- 1.2.4. Food and Beverage
- 1.2.5. Furniture and Home
- 1.2.6. Others (Toys, DIY, Media, etc.)
- 2. Market size (GMV) for the period of 2017-2027
-
3. Application
- 3.1. Beauty and Personal Care
- 3.2. Consumer Electronics
- 3.3. Fashion and Apparel
- 3.4. Food and Beverage
- 3.5. Furniture and Home
- 3.6. Others (Toys, DIY, Media, etc.)
- 4. Beauty and Personal Care
- 5. Consumer Electronics
- 6. Fashion and Apparel
- 7. Food and Beverage
- 8. Furniture and Home
- 9. Others (Toys, DIY, Media, etc.)
-
10. B2B ecommerce
- 10.1. Market size for the period of 2017-2027
Online Shopping in South Africa Market Segmentation By Geography
-
1. North America
- 1.1. United States
- 1.2. Canada
- 1.3. Mexico
-
2. South America
- 2.1. Brazil
- 2.2. Argentina
- 2.3. Rest of South America
-
3. Europe
- 3.1. United Kingdom
- 3.2. Germany
- 3.3. France
- 3.4. Italy
- 3.5. Spain
- 3.6. Russia
- 3.7. Benelux
- 3.8. Nordics
- 3.9. Rest of Europe
-
4. Middle East & Africa
- 4.1. Turkey
- 4.2. Israel
- 4.3. GCC
- 4.4. North Africa
- 4.5. South Africa
- 4.6. Rest of Middle East & Africa
-
5. Asia Pacific
- 5.1. China
- 5.2. India
- 5.3. Japan
- 5.4. South Korea
- 5.5. ASEAN
- 5.6. Oceania
- 5.7. Rest of Asia Pacific
Online Shopping in South Africa Market Regional Market Share
Geographic Coverage of Online Shopping in South Africa Market
Online Shopping in South Africa Market REPORT HIGHLIGHTS
| Aspects | Details |
|---|---|
| Study Period | 2020-2034 |
| Base Year | 2025 |
| Estimated Year | 2026 |
| Forecast Period | 2026-2034 |
| Historical Period | 2020-2025 |
| Growth Rate | CAGR of 8.17% from 2020-2034 |
| Segmentation |
|
Table of Contents
- 1. Introduction
- 1.1. Research Scope
- 1.2. Market Segmentation
- 1.3. Research Objective
- 1.4. Definitions and Assumptions
- 2. Executive Summary
- 2.1. Market Snapshot
- 3. Market Dynamics
- 3.1. Market Drivers
- 3.2. Market Restrains
- 3.3. Market Trends
- 3.4. Market Opportunities
- 4. Market Factor Analysis
- 4.1. Porters Five Forces
- 4.1.1. Bargaining Power of Suppliers
- 4.1.2. Bargaining Power of Buyers
- 4.1.3. Threat of New Entrants
- 4.1.4. Threat of Substitutes
- 4.1.5. Competitive Rivalry
- 4.2. PESTEL analysis
- 4.3. BCG Analysis
- 4.3.1. Stars (High Growth, High Market Share)
- 4.3.2. Cash Cows (Low Growth, High Market Share)
- 4.3.3. Question Mark (High Growth, Low Market Share)
- 4.3.4. Dogs (Low Growth, Low Market Share)
- 4.4. Ansoff Matrix Analysis
- 4.5. Supply Chain Analysis
- 4.6. Regulatory Landscape
- 4.7. Current Market Potential and Opportunity Assessment (TAM–SAM–SOM Framework)
- 4.8. NRP Analyst Note
- 4.1. Porters Five Forces
- 5. Market Analysis, Insights and Forecast 2021-2033
- 5.1. Market Analysis, Insights and Forecast - by B2C ecommerce
- 5.1.1. Market size (GMV) for the period of 2017-2027
- 5.1.2. Market Segmentation - by Application
- 5.1.2.1. Beauty and Personal Care
- 5.1.2.2. Consumer Electronics
- 5.1.2.3. Fashion and Apparel
- 5.1.2.4. Food and Beverage
- 5.1.2.5. Furniture and Home
- 5.1.2.6. Others (Toys, DIY, Media, etc.)
- 5.2. Market Analysis, Insights and Forecast - by Market size (GMV) for the period of 2017-2027
- 5.3. Market Analysis, Insights and Forecast - by Application
- 5.3.1. Beauty and Personal Care
- 5.3.2. Consumer Electronics
- 5.3.3. Fashion and Apparel
- 5.3.4. Food and Beverage
- 5.3.5. Furniture and Home
- 5.3.6. Others (Toys, DIY, Media, etc.)
- 5.4. Market Analysis, Insights and Forecast - by Beauty and Personal Care
- 5.5. Market Analysis, Insights and Forecast - by Consumer Electronics
- 5.6. Market Analysis, Insights and Forecast - by Fashion and Apparel
- 5.7. Market Analysis, Insights and Forecast - by Food and Beverage
- 5.8. Market Analysis, Insights and Forecast - by Furniture and Home
- 5.9. Market Analysis, Insights and Forecast - by Others (Toys, DIY, Media, etc.)
- 5.10. Market Analysis, Insights and Forecast - by B2B ecommerce
- 5.10.1. Market size for the period of 2017-2027
- 5.11. Market Analysis, Insights and Forecast - by Region
- 5.11.1. North America
- 5.11.2. South America
- 5.11.3. Europe
- 5.11.4. Middle East & Africa
- 5.11.5. Asia Pacific
- 5.1. Market Analysis, Insights and Forecast - by B2C ecommerce
- 6. Global Online Shopping in South Africa Market Analysis, Insights and Forecast, 2021-2033
- 6.1. Market Analysis, Insights and Forecast - by B2C ecommerce
- 6.1.1. Market size (GMV) for the period of 2017-2027
- 6.1.2. Market Segmentation - by Application
- 6.1.2.1. Beauty and Personal Care
- 6.1.2.2. Consumer Electronics
- 6.1.2.3. Fashion and Apparel
- 6.1.2.4. Food and Beverage
- 6.1.2.5. Furniture and Home
- 6.1.2.6. Others (Toys, DIY, Media, etc.)
- 6.2. Market Analysis, Insights and Forecast - by Market size (GMV) for the period of 2017-2027
- 6.3. Market Analysis, Insights and Forecast - by Application
- 6.3.1. Beauty and Personal Care
- 6.3.2. Consumer Electronics
- 6.3.3. Fashion and Apparel
- 6.3.4. Food and Beverage
- 6.3.5. Furniture and Home
- 6.3.6. Others (Toys, DIY, Media, etc.)
- 6.4. Market Analysis, Insights and Forecast - by Beauty and Personal Care
- 6.5. Market Analysis, Insights and Forecast - by Consumer Electronics
- 6.6. Market Analysis, Insights and Forecast - by Fashion and Apparel
- 6.7. Market Analysis, Insights and Forecast - by Food and Beverage
- 6.8. Market Analysis, Insights and Forecast - by Furniture and Home
- 6.9. Market Analysis, Insights and Forecast - by Others (Toys, DIY, Media, etc.)
- 6.10. Market Analysis, Insights and Forecast - by B2B ecommerce
- 6.10.1. Market size for the period of 2017-2027
- 6.1. Market Analysis, Insights and Forecast - by B2C ecommerce
- 7. North America Online Shopping in South Africa Market Analysis, Insights and Forecast, 2020-2032
- 7.1. Market Analysis, Insights and Forecast - by B2C ecommerce
- 7.1.1. Market size (GMV) for the period of 2017-2027
- 7.1.2. Market Segmentation - by Application
- 7.1.2.1. Beauty and Personal Care
- 7.1.2.2. Consumer Electronics
- 7.1.2.3. Fashion and Apparel
- 7.1.2.4. Food and Beverage
- 7.1.2.5. Furniture and Home
- 7.1.2.6. Others (Toys, DIY, Media, etc.)
- 7.2. Market Analysis, Insights and Forecast - by Market size (GMV) for the period of 2017-2027
- 7.3. Market Analysis, Insights and Forecast - by Application
- 7.3.1. Beauty and Personal Care
- 7.3.2. Consumer Electronics
- 7.3.3. Fashion and Apparel
- 7.3.4. Food and Beverage
- 7.3.5. Furniture and Home
- 7.3.6. Others (Toys, DIY, Media, etc.)
- 7.4. Market Analysis, Insights and Forecast - by Beauty and Personal Care
- 7.5. Market Analysis, Insights and Forecast - by Consumer Electronics
- 7.6. Market Analysis, Insights and Forecast - by Fashion and Apparel
- 7.7. Market Analysis, Insights and Forecast - by Food and Beverage
- 7.8. Market Analysis, Insights and Forecast - by Furniture and Home
- 7.9. Market Analysis, Insights and Forecast - by Others (Toys, DIY, Media, etc.)
- 7.10. Market Analysis, Insights and Forecast - by B2B ecommerce
- 7.10.1. Market size for the period of 2017-2027
- 7.1. Market Analysis, Insights and Forecast - by B2C ecommerce
- 8. South America Online Shopping in South Africa Market Analysis, Insights and Forecast, 2020-2032
- 8.1. Market Analysis, Insights and Forecast - by B2C ecommerce
- 8.1.1. Market size (GMV) for the period of 2017-2027
- 8.1.2. Market Segmentation - by Application
- 8.1.2.1. Beauty and Personal Care
- 8.1.2.2. Consumer Electronics
- 8.1.2.3. Fashion and Apparel
- 8.1.2.4. Food and Beverage
- 8.1.2.5. Furniture and Home
- 8.1.2.6. Others (Toys, DIY, Media, etc.)
- 8.2. Market Analysis, Insights and Forecast - by Market size (GMV) for the period of 2017-2027
- 8.3. Market Analysis, Insights and Forecast - by Application
- 8.3.1. Beauty and Personal Care
- 8.3.2. Consumer Electronics
- 8.3.3. Fashion and Apparel
- 8.3.4. Food and Beverage
- 8.3.5. Furniture and Home
- 8.3.6. Others (Toys, DIY, Media, etc.)
- 8.4. Market Analysis, Insights and Forecast - by Beauty and Personal Care
- 8.5. Market Analysis, Insights and Forecast - by Consumer Electronics
- 8.6. Market Analysis, Insights and Forecast - by Fashion and Apparel
- 8.7. Market Analysis, Insights and Forecast - by Food and Beverage
- 8.8. Market Analysis, Insights and Forecast - by Furniture and Home
- 8.9. Market Analysis, Insights and Forecast - by Others (Toys, DIY, Media, etc.)
- 8.10. Market Analysis, Insights and Forecast - by B2B ecommerce
- 8.10.1. Market size for the period of 2017-2027
- 8.1. Market Analysis, Insights and Forecast - by B2C ecommerce
- 9. Europe Online Shopping in South Africa Market Analysis, Insights and Forecast, 2020-2032
- 9.1. Market Analysis, Insights and Forecast - by B2C ecommerce
- 9.1.1. Market size (GMV) for the period of 2017-2027
- 9.1.2. Market Segmentation - by Application
- 9.1.2.1. Beauty and Personal Care
- 9.1.2.2. Consumer Electronics
- 9.1.2.3. Fashion and Apparel
- 9.1.2.4. Food and Beverage
- 9.1.2.5. Furniture and Home
- 9.1.2.6. Others (Toys, DIY, Media, etc.)
- 9.2. Market Analysis, Insights and Forecast - by Market size (GMV) for the period of 2017-2027
- 9.3. Market Analysis, Insights and Forecast - by Application
- 9.3.1. Beauty and Personal Care
- 9.3.2. Consumer Electronics
- 9.3.3. Fashion and Apparel
- 9.3.4. Food and Beverage
- 9.3.5. Furniture and Home
- 9.3.6. Others (Toys, DIY, Media, etc.)
- 9.4. Market Analysis, Insights and Forecast - by Beauty and Personal Care
- 9.5. Market Analysis, Insights and Forecast - by Consumer Electronics
- 9.6. Market Analysis, Insights and Forecast - by Fashion and Apparel
- 9.7. Market Analysis, Insights and Forecast - by Food and Beverage
- 9.8. Market Analysis, Insights and Forecast - by Furniture and Home
- 9.9. Market Analysis, Insights and Forecast - by Others (Toys, DIY, Media, etc.)
- 9.10. Market Analysis, Insights and Forecast - by B2B ecommerce
- 9.10.1. Market size for the period of 2017-2027
- 9.1. Market Analysis, Insights and Forecast - by B2C ecommerce
- 10. Middle East & Africa Online Shopping in South Africa Market Analysis, Insights and Forecast, 2020-2032
- 10.1. Market Analysis, Insights and Forecast - by B2C ecommerce
- 10.1.1. Market size (GMV) for the period of 2017-2027
- 10.1.2. Market Segmentation - by Application
- 10.1.2.1. Beauty and Personal Care
- 10.1.2.2. Consumer Electronics
- 10.1.2.3. Fashion and Apparel
- 10.1.2.4. Food and Beverage
- 10.1.2.5. Furniture and Home
- 10.1.2.6. Others (Toys, DIY, Media, etc.)
- 10.2. Market Analysis, Insights and Forecast - by Market size (GMV) for the period of 2017-2027
- 10.3. Market Analysis, Insights and Forecast - by Application
- 10.3.1. Beauty and Personal Care
- 10.3.2. Consumer Electronics
- 10.3.3. Fashion and Apparel
- 10.3.4. Food and Beverage
- 10.3.5. Furniture and Home
- 10.3.6. Others (Toys, DIY, Media, etc.)
- 10.4. Market Analysis, Insights and Forecast - by Beauty and Personal Care
- 10.5. Market Analysis, Insights and Forecast - by Consumer Electronics
- 10.6. Market Analysis, Insights and Forecast - by Fashion and Apparel
- 10.7. Market Analysis, Insights and Forecast - by Food and Beverage
- 10.8. Market Analysis, Insights and Forecast - by Furniture and Home
- 10.9. Market Analysis, Insights and Forecast - by Others (Toys, DIY, Media, etc.)
- 10.10. Market Analysis, Insights and Forecast - by B2B ecommerce
- 10.10.1. Market size for the period of 2017-2027
- 10.1. Market Analysis, Insights and Forecast - by B2C ecommerce
- 11. Asia Pacific Online Shopping in South Africa Market Analysis, Insights and Forecast, 2020-2032
- 11.1. Market Analysis, Insights and Forecast - by B2C ecommerce
- 11.1.1. Market size (GMV) for the period of 2017-2027
- 11.1.2. Market Segmentation - by Application
- 11.1.2.1. Beauty and Personal Care
- 11.1.2.2. Consumer Electronics
- 11.1.2.3. Fashion and Apparel
- 11.1.2.4. Food and Beverage
- 11.1.2.5. Furniture and Home
- 11.1.2.6. Others (Toys, DIY, Media, etc.)
- 11.2. Market Analysis, Insights and Forecast - by Market size (GMV) for the period of 2017-2027
- 11.3. Market Analysis, Insights and Forecast - by Application
- 11.3.1. Beauty and Personal Care
- 11.3.2. Consumer Electronics
- 11.3.3. Fashion and Apparel
- 11.3.4. Food and Beverage
- 11.3.5. Furniture and Home
- 11.3.6. Others (Toys, DIY, Media, etc.)
- 11.4. Market Analysis, Insights and Forecast - by Beauty and Personal Care
- 11.5. Market Analysis, Insights and Forecast - by Consumer Electronics
- 11.6. Market Analysis, Insights and Forecast - by Fashion and Apparel
- 11.7. Market Analysis, Insights and Forecast - by Food and Beverage
- 11.8. Market Analysis, Insights and Forecast - by Furniture and Home
- 11.9. Market Analysis, Insights and Forecast - by Others (Toys, DIY, Media, etc.)
- 11.10. Market Analysis, Insights and Forecast - by B2B ecommerce
- 11.10.1. Market size for the period of 2017-2027
- 11.1. Market Analysis, Insights and Forecast - by B2C ecommerce
- 12. Competitive Analysis
- 12.1. Company Profiles
- 12.1.1 Jumia
- 12.1.1.1. Company Overview
- 12.1.1.2. Products
- 12.1.1.3. Company Financials
- 12.1.1.4. SWOT Analysis
- 12.1.2 SoFresh
- 12.1.2.1. Company Overview
- 12.1.2.2. Products
- 12.1.2.3. Company Financials
- 12.1.2.4. SWOT Analysis
- 12.1.3 UCook
- 12.1.3.1. Company Overview
- 12.1.3.2. Products
- 12.1.3.3. Company Financials
- 12.1.3.4. SWOT Analysis
- 12.1.4 Takealot online Pty Ltd
- 12.1.4.1. Company Overview
- 12.1.4.2. Products
- 12.1.4.3. Company Financials
- 12.1.4.4. SWOT Analysis
- 12.1.5 Care to Beauty
- 12.1.5.1. Company Overview
- 12.1.5.2. Products
- 12.1.5.3. Company Financials
- 12.1.5.4. SWOT Analysis
- 12.1.6 Superbalist com
- 12.1.6.1. Company Overview
- 12.1.6.2. Products
- 12.1.6.3. Company Financials
- 12.1.6.4. SWOT Analysis
- 12.1.7 ToysRUs
- 12.1.7.1. Company Overview
- 12.1.7.2. Products
- 12.1.7.3. Company Financials
- 12.1.7.4. SWOT Analysis
- 12.1.8 Zando
- 12.1.8.1. Company Overview
- 12.1.8.2. Products
- 12.1.8.3. Company Financials
- 12.1.8.4. SWOT Analysis
- 12.1.9 Cosmetic SA
- 12.1.9.1. Company Overview
- 12.1.9.2. Products
- 12.1.9.3. Company Financials
- 12.1.9.4. SWOT Analysis
- 12.1.10 Decathlon
- 12.1.10.1. Company Overview
- 12.1.10.2. Products
- 12.1.10.3. Company Financials
- 12.1.10.4. SWOT Analysis
- 12.1.11 Evetech Pty Ltd*List Not Exhaustive
- 12.1.11.1. Company Overview
- 12.1.11.2. Products
- 12.1.11.3. Company Financials
- 12.1.11.4. SWOT Analysis
- 12.1.1 Jumia
- 12.2. Market Entropy
- 12.2.1 Company's Key Areas Served
- 12.2.2 Recent Developments
- 12.3. Company Market Share Analysis 2025
- 12.3.1 Top 5 Companies Market Share Analysis
- 12.3.2 Top 3 Companies Market Share Analysis
- 12.4. List of Potential Customers
- 13. Research Methodology
List of Figures
- Figure 1: Global Online Shopping in South Africa Market Revenue Breakdown (billion, %) by Region 2025 & 2033
- Figure 2: North America Online Shopping in South Africa Market Revenue (billion), by B2C ecommerce 2025 & 2033
- Figure 3: North America Online Shopping in South Africa Market Revenue Share (%), by B2C ecommerce 2025 & 2033
- Figure 4: North America Online Shopping in South Africa Market Revenue (billion), by Market size (GMV) for the period of 2017-2027 2025 & 2033
- Figure 5: North America Online Shopping in South Africa Market Revenue Share (%), by Market size (GMV) for the period of 2017-2027 2025 & 2033
- Figure 6: North America Online Shopping in South Africa Market Revenue (billion), by Application 2025 & 2033
- Figure 7: North America Online Shopping in South Africa Market Revenue Share (%), by Application 2025 & 2033
- Figure 8: North America Online Shopping in South Africa Market Revenue (billion), by Beauty and Personal Care 2025 & 2033
- Figure 9: North America Online Shopping in South Africa Market Revenue Share (%), by Beauty and Personal Care 2025 & 2033
- Figure 10: North America Online Shopping in South Africa Market Revenue (billion), by Consumer Electronics 2025 & 2033
- Figure 11: North America Online Shopping in South Africa Market Revenue Share (%), by Consumer Electronics 2025 & 2033
- Figure 12: North America Online Shopping in South Africa Market Revenue (billion), by Fashion and Apparel 2025 & 2033
- Figure 13: North America Online Shopping in South Africa Market Revenue Share (%), by Fashion and Apparel 2025 & 2033
- Figure 14: North America Online Shopping in South Africa Market Revenue (billion), by Food and Beverage 2025 & 2033
- Figure 15: North America Online Shopping in South Africa Market Revenue Share (%), by Food and Beverage 2025 & 2033
- Figure 16: North America Online Shopping in South Africa Market Revenue (billion), by Furniture and Home 2025 & 2033
- Figure 17: North America Online Shopping in South Africa Market Revenue Share (%), by Furniture and Home 2025 & 2033
- Figure 18: North America Online Shopping in South Africa Market Revenue (billion), by Others (Toys, DIY, Media, etc.) 2025 & 2033
- Figure 19: North America Online Shopping in South Africa Market Revenue Share (%), by Others (Toys, DIY, Media, etc.) 2025 & 2033
- Figure 20: North America Online Shopping in South Africa Market Revenue (billion), by B2B ecommerce 2025 & 2033
- Figure 21: North America Online Shopping in South Africa Market Revenue Share (%), by B2B ecommerce 2025 & 2033
- Figure 22: North America Online Shopping in South Africa Market Revenue (billion), by Country 2025 & 2033
- Figure 23: North America Online Shopping in South Africa Market Revenue Share (%), by Country 2025 & 2033
- Figure 24: South America Online Shopping in South Africa Market Revenue (billion), by B2C ecommerce 2025 & 2033
- Figure 25: South America Online Shopping in South Africa Market Revenue Share (%), by B2C ecommerce 2025 & 2033
- Figure 26: South America Online Shopping in South Africa Market Revenue (billion), by Market size (GMV) for the period of 2017-2027 2025 & 2033
- Figure 27: South America Online Shopping in South Africa Market Revenue Share (%), by Market size (GMV) for the period of 2017-2027 2025 & 2033
- Figure 28: South America Online Shopping in South Africa Market Revenue (billion), by Application 2025 & 2033
- Figure 29: South America Online Shopping in South Africa Market Revenue Share (%), by Application 2025 & 2033
- Figure 30: South America Online Shopping in South Africa Market Revenue (billion), by Beauty and Personal Care 2025 & 2033
- Figure 31: South America Online Shopping in South Africa Market Revenue Share (%), by Beauty and Personal Care 2025 & 2033
- Figure 32: South America Online Shopping in South Africa Market Revenue (billion), by Consumer Electronics 2025 & 2033
- Figure 33: South America Online Shopping in South Africa Market Revenue Share (%), by Consumer Electronics 2025 & 2033
- Figure 34: South America Online Shopping in South Africa Market Revenue (billion), by Fashion and Apparel 2025 & 2033
- Figure 35: South America Online Shopping in South Africa Market Revenue Share (%), by Fashion and Apparel 2025 & 2033
- Figure 36: South America Online Shopping in South Africa Market Revenue (billion), by Food and Beverage 2025 & 2033
- Figure 37: South America Online Shopping in South Africa Market Revenue Share (%), by Food and Beverage 2025 & 2033
- Figure 38: South America Online Shopping in South Africa Market Revenue (billion), by Furniture and Home 2025 & 2033
- Figure 39: South America Online Shopping in South Africa Market Revenue Share (%), by Furniture and Home 2025 & 2033
- Figure 40: South America Online Shopping in South Africa Market Revenue (billion), by Others (Toys, DIY, Media, etc.) 2025 & 2033
- Figure 41: South America Online Shopping in South Africa Market Revenue Share (%), by Others (Toys, DIY, Media, etc.) 2025 & 2033
- Figure 42: South America Online Shopping in South Africa Market Revenue (billion), by B2B ecommerce 2025 & 2033
- Figure 43: South America Online Shopping in South Africa Market Revenue Share (%), by B2B ecommerce 2025 & 2033
- Figure 44: South America Online Shopping in South Africa Market Revenue (billion), by Country 2025 & 2033
- Figure 45: South America Online Shopping in South Africa Market Revenue Share (%), by Country 2025 & 2033
- Figure 46: Europe Online Shopping in South Africa Market Revenue (billion), by B2C ecommerce 2025 & 2033
- Figure 47: Europe Online Shopping in South Africa Market Revenue Share (%), by B2C ecommerce 2025 & 2033
- Figure 48: Europe Online Shopping in South Africa Market Revenue (billion), by Market size (GMV) for the period of 2017-2027 2025 & 2033
- Figure 49: Europe Online Shopping in South Africa Market Revenue Share (%), by Market size (GMV) for the period of 2017-2027 2025 & 2033
- Figure 50: Europe Online Shopping in South Africa Market Revenue (billion), by Application 2025 & 2033
- Figure 51: Europe Online Shopping in South Africa Market Revenue Share (%), by Application 2025 & 2033
- Figure 52: Europe Online Shopping in South Africa Market Revenue (billion), by Beauty and Personal Care 2025 & 2033
- Figure 53: Europe Online Shopping in South Africa Market Revenue Share (%), by Beauty and Personal Care 2025 & 2033
- Figure 54: Europe Online Shopping in South Africa Market Revenue (billion), by Consumer Electronics 2025 & 2033
- Figure 55: Europe Online Shopping in South Africa Market Revenue Share (%), by Consumer Electronics 2025 & 2033
- Figure 56: Europe Online Shopping in South Africa Market Revenue (billion), by Fashion and Apparel 2025 & 2033
- Figure 57: Europe Online Shopping in South Africa Market Revenue Share (%), by Fashion and Apparel 2025 & 2033
- Figure 58: Europe Online Shopping in South Africa Market Revenue (billion), by Food and Beverage 2025 & 2033
- Figure 59: Europe Online Shopping in South Africa Market Revenue Share (%), by Food and Beverage 2025 & 2033
- Figure 60: Europe Online Shopping in South Africa Market Revenue (billion), by Furniture and Home 2025 & 2033
- Figure 61: Europe Online Shopping in South Africa Market Revenue Share (%), by Furniture and Home 2025 & 2033
- Figure 62: Europe Online Shopping in South Africa Market Revenue (billion), by Others (Toys, DIY, Media, etc.) 2025 & 2033
- Figure 63: Europe Online Shopping in South Africa Market Revenue Share (%), by Others (Toys, DIY, Media, etc.) 2025 & 2033
- Figure 64: Europe Online Shopping in South Africa Market Revenue (billion), by B2B ecommerce 2025 & 2033
- Figure 65: Europe Online Shopping in South Africa Market Revenue Share (%), by B2B ecommerce 2025 & 2033
- Figure 66: Europe Online Shopping in South Africa Market Revenue (billion), by Country 2025 & 2033
- Figure 67: Europe Online Shopping in South Africa Market Revenue Share (%), by Country 2025 & 2033
- Figure 68: Middle East & Africa Online Shopping in South Africa Market Revenue (billion), by B2C ecommerce 2025 & 2033
- Figure 69: Middle East & Africa Online Shopping in South Africa Market Revenue Share (%), by B2C ecommerce 2025 & 2033
- Figure 70: Middle East & Africa Online Shopping in South Africa Market Revenue (billion), by Market size (GMV) for the period of 2017-2027 2025 & 2033
- Figure 71: Middle East & Africa Online Shopping in South Africa Market Revenue Share (%), by Market size (GMV) for the period of 2017-2027 2025 & 2033
- Figure 72: Middle East & Africa Online Shopping in South Africa Market Revenue (billion), by Application 2025 & 2033
- Figure 73: Middle East & Africa Online Shopping in South Africa Market Revenue Share (%), by Application 2025 & 2033
- Figure 74: Middle East & Africa Online Shopping in South Africa Market Revenue (billion), by Beauty and Personal Care 2025 & 2033
- Figure 75: Middle East & Africa Online Shopping in South Africa Market Revenue Share (%), by Beauty and Personal Care 2025 & 2033
- Figure 76: Middle East & Africa Online Shopping in South Africa Market Revenue (billion), by Consumer Electronics 2025 & 2033
- Figure 77: Middle East & Africa Online Shopping in South Africa Market Revenue Share (%), by Consumer Electronics 2025 & 2033
- Figure 78: Middle East & Africa Online Shopping in South Africa Market Revenue (billion), by Fashion and Apparel 2025 & 2033
- Figure 79: Middle East & Africa Online Shopping in South Africa Market Revenue Share (%), by Fashion and Apparel 2025 & 2033
- Figure 80: Middle East & Africa Online Shopping in South Africa Market Revenue (billion), by Food and Beverage 2025 & 2033
- Figure 81: Middle East & Africa Online Shopping in South Africa Market Revenue Share (%), by Food and Beverage 2025 & 2033
- Figure 82: Middle East & Africa Online Shopping in South Africa Market Revenue (billion), by Furniture and Home 2025 & 2033
- Figure 83: Middle East & Africa Online Shopping in South Africa Market Revenue Share (%), by Furniture and Home 2025 & 2033
- Figure 84: Middle East & Africa Online Shopping in South Africa Market Revenue (billion), by Others (Toys, DIY, Media, etc.) 2025 & 2033
- Figure 85: Middle East & Africa Online Shopping in South Africa Market Revenue Share (%), by Others (Toys, DIY, Media, etc.) 2025 & 2033
- Figure 86: Middle East & Africa Online Shopping in South Africa Market Revenue (billion), by B2B ecommerce 2025 & 2033
- Figure 87: Middle East & Africa Online Shopping in South Africa Market Revenue Share (%), by B2B ecommerce 2025 & 2033
- Figure 88: Middle East & Africa Online Shopping in South Africa Market Revenue (billion), by Country 2025 & 2033
- Figure 89: Middle East & Africa Online Shopping in South Africa Market Revenue Share (%), by Country 2025 & 2033
- Figure 90: Asia Pacific Online Shopping in South Africa Market Revenue (billion), by B2C ecommerce 2025 & 2033
- Figure 91: Asia Pacific Online Shopping in South Africa Market Revenue Share (%), by B2C ecommerce 2025 & 2033
- Figure 92: Asia Pacific Online Shopping in South Africa Market Revenue (billion), by Market size (GMV) for the period of 2017-2027 2025 & 2033
- Figure 93: Asia Pacific Online Shopping in South Africa Market Revenue Share (%), by Market size (GMV) for the period of 2017-2027 2025 & 2033
- Figure 94: Asia Pacific Online Shopping in South Africa Market Revenue (billion), by Application 2025 & 2033
- Figure 95: Asia Pacific Online Shopping in South Africa Market Revenue Share (%), by Application 2025 & 2033
- Figure 96: Asia Pacific Online Shopping in South Africa Market Revenue (billion), by Beauty and Personal Care 2025 & 2033
- Figure 97: Asia Pacific Online Shopping in South Africa Market Revenue Share (%), by Beauty and Personal Care 2025 & 2033
- Figure 98: Asia Pacific Online Shopping in South Africa Market Revenue (billion), by Consumer Electronics 2025 & 2033
- Figure 99: Asia Pacific Online Shopping in South Africa Market Revenue Share (%), by Consumer Electronics 2025 & 2033
- Figure 100: Asia Pacific Online Shopping in South Africa Market Revenue (billion), by Fashion and Apparel 2025 & 2033
- Figure 101: Asia Pacific Online Shopping in South Africa Market Revenue Share (%), by Fashion and Apparel 2025 & 2033
- Figure 102: Asia Pacific Online Shopping in South Africa Market Revenue (billion), by Food and Beverage 2025 & 2033
- Figure 103: Asia Pacific Online Shopping in South Africa Market Revenue Share (%), by Food and Beverage 2025 & 2033
- Figure 104: Asia Pacific Online Shopping in South Africa Market Revenue (billion), by Furniture and Home 2025 & 2033
- Figure 105: Asia Pacific Online Shopping in South Africa Market Revenue Share (%), by Furniture and Home 2025 & 2033
- Figure 106: Asia Pacific Online Shopping in South Africa Market Revenue (billion), by Others (Toys, DIY, Media, etc.) 2025 & 2033
- Figure 107: Asia Pacific Online Shopping in South Africa Market Revenue Share (%), by Others (Toys, DIY, Media, etc.) 2025 & 2033
- Figure 108: Asia Pacific Online Shopping in South Africa Market Revenue (billion), by B2B ecommerce 2025 & 2033
- Figure 109: Asia Pacific Online Shopping in South Africa Market Revenue Share (%), by B2B ecommerce 2025 & 2033
- Figure 110: Asia Pacific Online Shopping in South Africa Market Revenue (billion), by Country 2025 & 2033
- Figure 111: Asia Pacific Online Shopping in South Africa Market Revenue Share (%), by Country 2025 & 2033
List of Tables
- Table 1: Global Online Shopping in South Africa Market Revenue billion Forecast, by B2C ecommerce 2020 & 2033
- Table 2: Global Online Shopping in South Africa Market Revenue billion Forecast, by Market size (GMV) for the period of 2017-2027 2020 & 2033
- Table 3: Global Online Shopping in South Africa Market Revenue billion Forecast, by Application 2020 & 2033
- Table 4: Global Online Shopping in South Africa Market Revenue billion Forecast, by Beauty and Personal Care 2020 & 2033
- Table 5: Global Online Shopping in South Africa Market Revenue billion Forecast, by Consumer Electronics 2020 & 2033
- Table 6: Global Online Shopping in South Africa Market Revenue billion Forecast, by Fashion and Apparel 2020 & 2033
- Table 7: Global Online Shopping in South Africa Market Revenue billion Forecast, by Food and Beverage 2020 & 2033
- Table 8: Global Online Shopping in South Africa Market Revenue billion Forecast, by Furniture and Home 2020 & 2033
- Table 9: Global Online Shopping in South Africa Market Revenue billion Forecast, by Others (Toys, DIY, Media, etc.) 2020 & 2033
- Table 10: Global Online Shopping in South Africa Market Revenue billion Forecast, by B2B ecommerce 2020 & 2033
- Table 11: Global Online Shopping in South Africa Market Revenue billion Forecast, by Region 2020 & 2033
- Table 12: Global Online Shopping in South Africa Market Revenue billion Forecast, by B2C ecommerce 2020 & 2033
- Table 13: Global Online Shopping in South Africa Market Revenue billion Forecast, by Market size (GMV) for the period of 2017-2027 2020 & 2033
- Table 14: Global Online Shopping in South Africa Market Revenue billion Forecast, by Application 2020 & 2033
- Table 15: Global Online Shopping in South Africa Market Revenue billion Forecast, by Beauty and Personal Care 2020 & 2033
- Table 16: Global Online Shopping in South Africa Market Revenue billion Forecast, by Consumer Electronics 2020 & 2033
- Table 17: Global Online Shopping in South Africa Market Revenue billion Forecast, by Fashion and Apparel 2020 & 2033
- Table 18: Global Online Shopping in South Africa Market Revenue billion Forecast, by Food and Beverage 2020 & 2033
- Table 19: Global Online Shopping in South Africa Market Revenue billion Forecast, by Furniture and Home 2020 & 2033
- Table 20: Global Online Shopping in South Africa Market Revenue billion Forecast, by Others (Toys, DIY, Media, etc.) 2020 & 2033
- Table 21: Global Online Shopping in South Africa Market Revenue billion Forecast, by B2B ecommerce 2020 & 2033
- Table 22: Global Online Shopping in South Africa Market Revenue billion Forecast, by Country 2020 & 2033
- Table 23: United States Online Shopping in South Africa Market Revenue (billion) Forecast, by Application 2020 & 2033
- Table 24: Canada Online Shopping in South Africa Market Revenue (billion) Forecast, by Application 2020 & 2033
- Table 25: Mexico Online Shopping in South Africa Market Revenue (billion) Forecast, by Application 2020 & 2033
- Table 26: Global Online Shopping in South Africa Market Revenue billion Forecast, by B2C ecommerce 2020 & 2033
- Table 27: Global Online Shopping in South Africa Market Revenue billion Forecast, by Market size (GMV) for the period of 2017-2027 2020 & 2033
- Table 28: Global Online Shopping in South Africa Market Revenue billion Forecast, by Application 2020 & 2033
- Table 29: Global Online Shopping in South Africa Market Revenue billion Forecast, by Beauty and Personal Care 2020 & 2033
- Table 30: Global Online Shopping in South Africa Market Revenue billion Forecast, by Consumer Electronics 2020 & 2033
- Table 31: Global Online Shopping in South Africa Market Revenue billion Forecast, by Fashion and Apparel 2020 & 2033
- Table 32: Global Online Shopping in South Africa Market Revenue billion Forecast, by Food and Beverage 2020 & 2033
- Table 33: Global Online Shopping in South Africa Market Revenue billion Forecast, by Furniture and Home 2020 & 2033
- Table 34: Global Online Shopping in South Africa Market Revenue billion Forecast, by Others (Toys, DIY, Media, etc.) 2020 & 2033
- Table 35: Global Online Shopping in South Africa Market Revenue billion Forecast, by B2B ecommerce 2020 & 2033
- Table 36: Global Online Shopping in South Africa Market Revenue billion Forecast, by Country 2020 & 2033
- Table 37: Brazil Online Shopping in South Africa Market Revenue (billion) Forecast, by Application 2020 & 2033
- Table 38: Argentina Online Shopping in South Africa Market Revenue (billion) Forecast, by Application 2020 & 2033
- Table 39: Rest of South America Online Shopping in South Africa Market Revenue (billion) Forecast, by Application 2020 & 2033
- Table 40: Global Online Shopping in South Africa Market Revenue billion Forecast, by B2C ecommerce 2020 & 2033
- Table 41: Global Online Shopping in South Africa Market Revenue billion Forecast, by Market size (GMV) for the period of 2017-2027 2020 & 2033
- Table 42: Global Online Shopping in South Africa Market Revenue billion Forecast, by Application 2020 & 2033
- Table 43: Global Online Shopping in South Africa Market Revenue billion Forecast, by Beauty and Personal Care 2020 & 2033
- Table 44: Global Online Shopping in South Africa Market Revenue billion Forecast, by Consumer Electronics 2020 & 2033
- Table 45: Global Online Shopping in South Africa Market Revenue billion Forecast, by Fashion and Apparel 2020 & 2033
- Table 46: Global Online Shopping in South Africa Market Revenue billion Forecast, by Food and Beverage 2020 & 2033
- Table 47: Global Online Shopping in South Africa Market Revenue billion Forecast, by Furniture and Home 2020 & 2033
- Table 48: Global Online Shopping in South Africa Market Revenue billion Forecast, by Others (Toys, DIY, Media, etc.) 2020 & 2033
- Table 49: Global Online Shopping in South Africa Market Revenue billion Forecast, by B2B ecommerce 2020 & 2033
- Table 50: Global Online Shopping in South Africa Market Revenue billion Forecast, by Country 2020 & 2033
- Table 51: United Kingdom Online Shopping in South Africa Market Revenue (billion) Forecast, by Application 2020 & 2033
- Table 52: Germany Online Shopping in South Africa Market Revenue (billion) Forecast, by Application 2020 & 2033
- Table 53: France Online Shopping in South Africa Market Revenue (billion) Forecast, by Application 2020 & 2033
- Table 54: Italy Online Shopping in South Africa Market Revenue (billion) Forecast, by Application 2020 & 2033
- Table 55: Spain Online Shopping in South Africa Market Revenue (billion) Forecast, by Application 2020 & 2033
- Table 56: Russia Online Shopping in South Africa Market Revenue (billion) Forecast, by Application 2020 & 2033
- Table 57: Benelux Online Shopping in South Africa Market Revenue (billion) Forecast, by Application 2020 & 2033
- Table 58: Nordics Online Shopping in South Africa Market Revenue (billion) Forecast, by Application 2020 & 2033
- Table 59: Rest of Europe Online Shopping in South Africa Market Revenue (billion) Forecast, by Application 2020 & 2033
- Table 60: Global Online Shopping in South Africa Market Revenue billion Forecast, by B2C ecommerce 2020 & 2033
- Table 61: Global Online Shopping in South Africa Market Revenue billion Forecast, by Market size (GMV) for the period of 2017-2027 2020 & 2033
- Table 62: Global Online Shopping in South Africa Market Revenue billion Forecast, by Application 2020 & 2033
- Table 63: Global Online Shopping in South Africa Market Revenue billion Forecast, by Beauty and Personal Care 2020 & 2033
- Table 64: Global Online Shopping in South Africa Market Revenue billion Forecast, by Consumer Electronics 2020 & 2033
- Table 65: Global Online Shopping in South Africa Market Revenue billion Forecast, by Fashion and Apparel 2020 & 2033
- Table 66: Global Online Shopping in South Africa Market Revenue billion Forecast, by Food and Beverage 2020 & 2033
- Table 67: Global Online Shopping in South Africa Market Revenue billion Forecast, by Furniture and Home 2020 & 2033
- Table 68: Global Online Shopping in South Africa Market Revenue billion Forecast, by Others (Toys, DIY, Media, etc.) 2020 & 2033
- Table 69: Global Online Shopping in South Africa Market Revenue billion Forecast, by B2B ecommerce 2020 & 2033
- Table 70: Global Online Shopping in South Africa Market Revenue billion Forecast, by Country 2020 & 2033
- Table 71: Turkey Online Shopping in South Africa Market Revenue (billion) Forecast, by Application 2020 & 2033
- Table 72: Israel Online Shopping in South Africa Market Revenue (billion) Forecast, by Application 2020 & 2033
- Table 73: GCC Online Shopping in South Africa Market Revenue (billion) Forecast, by Application 2020 & 2033
- Table 74: North Africa Online Shopping in South Africa Market Revenue (billion) Forecast, by Application 2020 & 2033
- Table 75: South Africa Online Shopping in South Africa Market Revenue (billion) Forecast, by Application 2020 & 2033
- Table 76: Rest of Middle East & Africa Online Shopping in South Africa Market Revenue (billion) Forecast, by Application 2020 & 2033
- Table 77: Global Online Shopping in South Africa Market Revenue billion Forecast, by B2C ecommerce 2020 & 2033
- Table 78: Global Online Shopping in South Africa Market Revenue billion Forecast, by Market size (GMV) for the period of 2017-2027 2020 & 2033
- Table 79: Global Online Shopping in South Africa Market Revenue billion Forecast, by Application 2020 & 2033
- Table 80: Global Online Shopping in South Africa Market Revenue billion Forecast, by Beauty and Personal Care 2020 & 2033
- Table 81: Global Online Shopping in South Africa Market Revenue billion Forecast, by Consumer Electronics 2020 & 2033
- Table 82: Global Online Shopping in South Africa Market Revenue billion Forecast, by Fashion and Apparel 2020 & 2033
- Table 83: Global Online Shopping in South Africa Market Revenue billion Forecast, by Food and Beverage 2020 & 2033
- Table 84: Global Online Shopping in South Africa Market Revenue billion Forecast, by Furniture and Home 2020 & 2033
- Table 85: Global Online Shopping in South Africa Market Revenue billion Forecast, by Others (Toys, DIY, Media, etc.) 2020 & 2033
- Table 86: Global Online Shopping in South Africa Market Revenue billion Forecast, by B2B ecommerce 2020 & 2033
- Table 87: Global Online Shopping in South Africa Market Revenue billion Forecast, by Country 2020 & 2033
- Table 88: China Online Shopping in South Africa Market Revenue (billion) Forecast, by Application 2020 & 2033
- Table 89: India Online Shopping in South Africa Market Revenue (billion) Forecast, by Application 2020 & 2033
- Table 90: Japan Online Shopping in South Africa Market Revenue (billion) Forecast, by Application 2020 & 2033
- Table 91: South Korea Online Shopping in South Africa Market Revenue (billion) Forecast, by Application 2020 & 2033
- Table 92: ASEAN Online Shopping in South Africa Market Revenue (billion) Forecast, by Application 2020 & 2033
- Table 93: Oceania Online Shopping in South Africa Market Revenue (billion) Forecast, by Application 2020 & 2033
- Table 94: Rest of Asia Pacific Online Shopping in South Africa Market Revenue (billion) Forecast, by Application 2020 & 2033
Frequently Asked Questions
1. What is the projected Compound Annual Growth Rate (CAGR) of the Online Shopping in South Africa Market?
The projected CAGR is approximately 8.17%.
2. Which companies are prominent players in the Online Shopping in South Africa Market?
Key companies in the market include Jumia, SoFresh, UCook, Takealot online Pty Ltd, Care to Beauty, Superbalist com, ToysRUs, Zando, Cosmetic SA, Decathlon, Evetech Pty Ltd*List Not Exhaustive.
3. What are the main segments of the Online Shopping in South Africa Market?
The market segments include B2C ecommerce, Market size (GMV) for the period of 2017-2027, Application, Beauty and Personal Care, Consumer Electronics, Fashion and Apparel, Food and Beverage, Furniture and Home, Others (Toys, DIY, Media, etc.), B2B ecommerce.
4. Can you provide details about the market size?
The market size is estimated to be USD 38.11 billion as of 2022.
5. What are some drivers contributing to market growth?
Growing Demand from Fashion Industry; Penetration of Internet and Smartphone Usage.
6. What are the notable trends driving market growth?
Fashion industry to have significant growth in the country.
7. Are there any restraints impacting market growth?
Performance Constraint of Cryocoolers.
8. Can you provide examples of recent developments in the market?
April 2021 - US-based retailer Amazon will set up a new African headquarters in Cape Town, South Africa. The government approved the proposed multipurpose development on 15 acres of land to boost the city's economy, with Amazon headquarters as the project's main tenant. Development is in stages and is expected to be completed within 3-5 years.
9. What pricing options are available for accessing the report?
Pricing options include single-user, multi-user, and enterprise licenses priced at USD 3800, USD 4500, and USD 5800 respectively.
10. Is the market size provided in terms of value or volume?
The market size is provided in terms of value, measured in billion.
11. Are there any specific market keywords associated with the report?
Yes, the market keyword associated with the report is "Online Shopping in South Africa Market," which aids in identifying and referencing the specific market segment covered.
12. How do I determine which pricing option suits my needs best?
The pricing options vary based on user requirements and access needs. Individual users may opt for single-user licenses, while businesses requiring broader access may choose multi-user or enterprise licenses for cost-effective access to the report.
13. Are there any additional resources or data provided in the Online Shopping in South Africa Market report?
While the report offers comprehensive insights, it's advisable to review the specific contents or supplementary materials provided to ascertain if additional resources or data are available.
14. How can I stay updated on further developments or reports in the Online Shopping in South Africa Market?
To stay informed about further developments, trends, and reports in the Online Shopping in South Africa Market, consider subscribing to industry newsletters, following relevant companies and organizations, or regularly checking reputable industry news sources and publications.
Methodology
Step 1 - Identification of Relevant Samples Size from Population Database


Step 2 - Approaches for Defining Global Market Size (Value, Volume* & Price*)

Note*: In applicable scenarios
Step 3 - Data Sources
Primary Research
- Web Analytics
- Survey Reports
- Research Institute
- Latest Research Reports
- Opinion Leaders
Secondary Research
- Annual Reports
- White Paper
- Latest Press Release
- Industry Association
- Paid Database
- Investor Presentations

Step 4 - Data Triangulation
Involves using different sources of information in order to increase the validity of a study
These sources are likely to be stakeholders in a program - participants, other researchers, program staff, other community members, and so on.
Then we put all data in single framework & apply various statistical tools to find out the dynamic on the market.
During the analysis stage, feedback from the stakeholder groups would be compared to determine areas of agreement as well as areas of divergence