

Key Insights
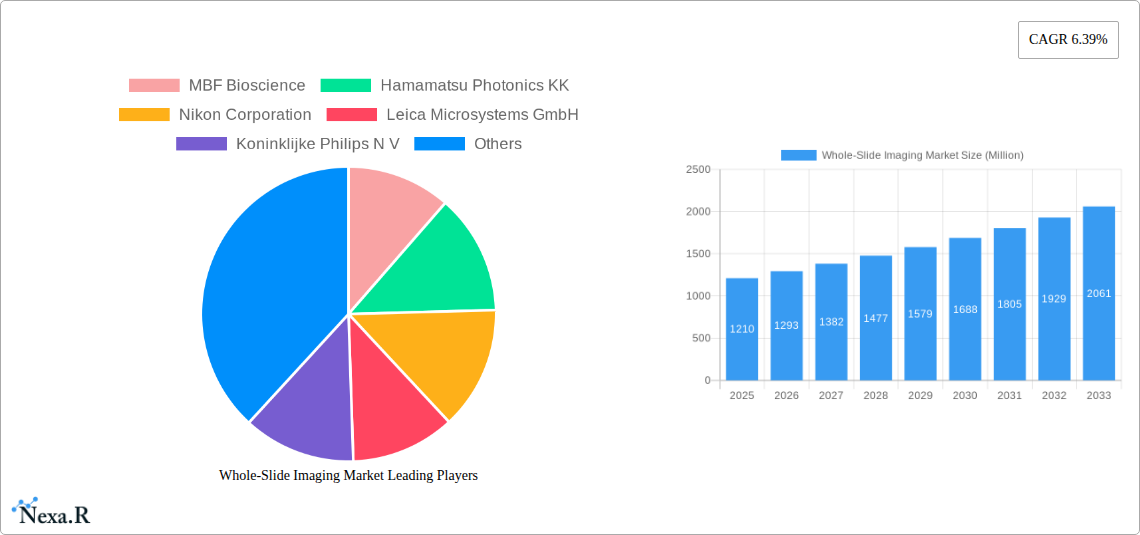
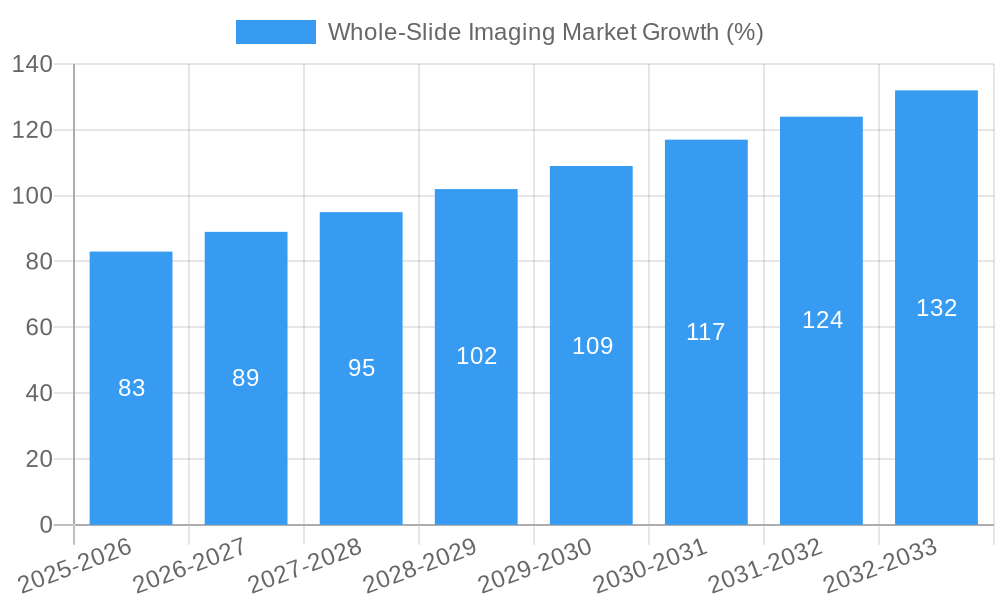
The whole-slide imaging (WSI) market, valued at $1.21 billion in 2025, is experiencing robust growth, projected to expand at a compound annual growth rate (CAGR) of 6.39% from 2025 to 2033. This expansion is fueled by several key factors. The increasing adoption of digital pathology in healthcare settings is a major driver, offering advantages such as improved diagnostic accuracy, enhanced collaboration among pathologists, and streamlined workflow efficiencies. Furthermore, the rising prevalence of chronic diseases, necessitating more sophisticated diagnostic tools, is significantly boosting market demand. Technological advancements, including the development of higher-resolution scanners and more sophisticated image analysis software, are further contributing to market growth. The integration of artificial intelligence (AI) and machine learning (ML) algorithms into WSI systems is transforming diagnostic capabilities, allowing for automated analysis and improved diagnostic accuracy, which is further driving market expansion. The expansion of telepathology, enabling remote consultations and diagnosis, is also contributing to the growth trajectory. While regulatory hurdles and high initial investment costs might present some challenges, the long-term benefits of improved diagnostics and workflow efficiency outweigh these limitations, ensuring sustained growth.
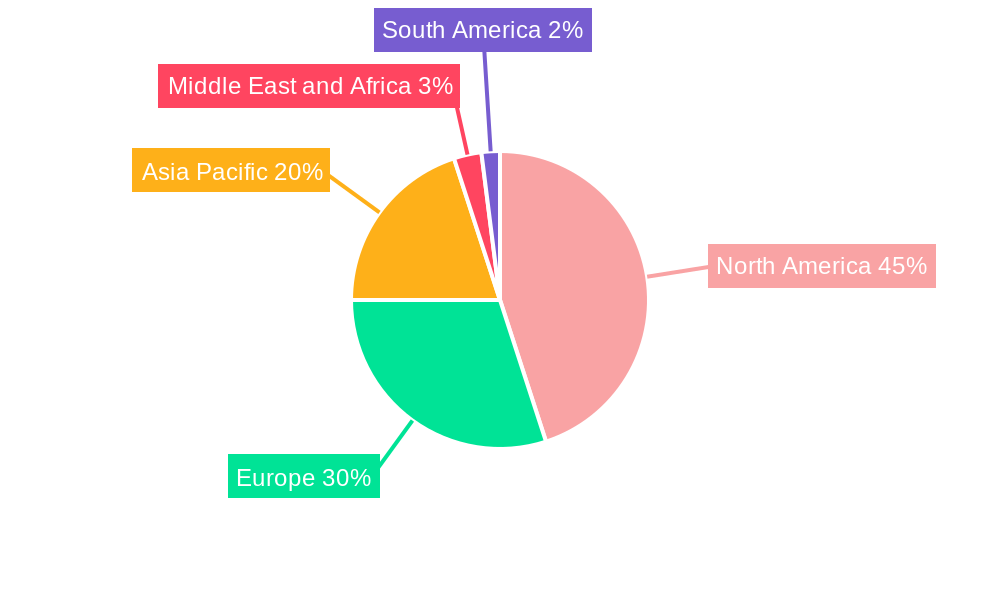
Segment-wise, the scanner technology segment holds a significant market share, driven by the continuous innovation in scanner technologies. The telepathology application segment is experiencing rapid growth due to the increased demand for remote diagnostic services. North America currently dominates the market, owing to high technological advancements, increased healthcare spending, and early adoption of digital pathology. However, the Asia-Pacific region is expected to witness substantial growth in the coming years, fueled by rising healthcare infrastructure development and increasing awareness of advanced diagnostic techniques. Key players in the market, including MBF Bioscience, Hamamatsu Photonics KK, and Leica Microsystems, are constantly innovating and expanding their product portfolios to cater to the evolving market needs. This competitive landscape further propels market growth through technological advancements and improved accessibility of WSI systems.
Whole-Slide Imaging Market: A Comprehensive Market Report (2019-2033)
This in-depth report provides a comprehensive analysis of the Whole-Slide Imaging market, encompassing market dynamics, growth trends, regional segmentation, product landscape, key players, and future outlook. The study period covers 2019-2033, with 2025 as the base and estimated year. The report is essential for industry professionals, investors, and strategic decision-makers seeking a clear understanding of this rapidly evolving market. The market is segmented by technology (Scanners, IT Infrastructure, Viewer, Image Management System), application (Telepathology, Cytopathology, Immunohistochemistry, Hematopathology), and end-user (Academic Institute, Research, Others). The total market size in 2025 is estimated at xx Million.
Whole-Slide Imaging Market Market Dynamics & Structure
The Whole-Slide Imaging market is characterized by a moderately concentrated landscape, with key players such as Leica Microsystems, Hamamatsu, and 3DHistech holding significant market share. Technological innovation, particularly in AI-powered image analysis and cloud-based solutions, is a major driver. Regulatory frameworks, such as FDA approvals for digital pathology systems, significantly influence market growth. The market faces competition from traditional microscopy techniques, but the advantages of digital pathology, including enhanced collaboration, improved efficiency, and remote diagnostics, are driving adoption. M&A activity is moderate, with strategic partnerships and acquisitions aimed at expanding product portfolios and market reach. For example, the recent collaboration between Pramana and PathPresenter highlights the increasing trend of integration across the digital pathology workflow.
- Market Concentration: Moderately concentrated, with top 5 players holding approximately xx% market share in 2025.
- Technological Innovation: AI-powered image analysis, cloud-based solutions, and improved scanner technologies are key drivers.
- Regulatory Framework: FDA approvals and other regulatory guidelines shape market access and adoption.
- Competitive Substitutes: Traditional microscopy techniques pose some competition, but digital pathology’s benefits drive market shift.
- M&A Trends: Moderate activity, focusing on strategic partnerships and acquisitions to broaden product portfolios and market presence. xx M&A deals were recorded between 2019 and 2024.
Whole-Slide Imaging Market Growth Trends & Insights
The Whole-Slide Imaging market experienced robust growth during the historical period (2019-2024), with a CAGR of xx%. This growth is primarily attributed to increasing adoption of digital pathology in routine clinical practice and research. The rising prevalence of chronic diseases, coupled with the need for efficient and accurate diagnostic solutions, is fueling market expansion. Technological advancements, including higher resolution scanners and improved image analysis software, are accelerating market adoption. Telepathology is gaining traction, enabled by improved network infrastructure and remote access capabilities. Consumer behavior shifts towards a preference for digital solutions are further enhancing market growth. The market is expected to maintain a healthy growth trajectory during the forecast period (2025-2033), with a projected CAGR of xx%, reaching xx Million by 2033. Market penetration in key regions is expected to increase from xx% in 2025 to xx% by 2033.
Dominant Regions, Countries, or Segments in Whole-Slide Imaging Market
North America currently dominates the Whole-Slide Imaging market, driven by high healthcare spending, advanced infrastructure, and early adoption of digital pathology technologies. However, the Asia-Pacific region is projected to witness the fastest growth during the forecast period, fueled by increasing healthcare investments, rising prevalence of chronic diseases, and growing adoption of advanced medical technologies. Within the segmentation, the Scanners segment holds the largest market share, owing to its crucial role in the digital pathology workflow. However, the Image Management System segment is anticipated to exhibit the highest growth rate, driven by the rising need for efficient storage, retrieval, and analysis of whole-slide images.
- North America: High healthcare expenditure, robust infrastructure, and early adoption of digital pathology.
- Asia-Pacific: Fastest-growing region due to increasing healthcare investments and rising prevalence of chronic diseases.
- Europe: Significant market share due to established healthcare systems and technological advancements.
- Scanners Segment: Largest market share due to essential role in digital pathology workflow.
- Image Management System Segment: Highest growth rate due to increasing need for efficient image handling.
Whole-Slide Imaging Market Product Landscape
The Whole-Slide Imaging market offers a diverse range of products, including high-resolution scanners, sophisticated image management systems, and user-friendly viewers. Recent innovations focus on improving image quality, enhancing analysis capabilities through AI integration, and streamlining workflows to improve efficiency. Key features include improved speed, higher resolution, integrated AI algorithms for automated analysis, and cloud-based solutions for remote access and collaboration. The unique selling propositions include improved diagnostic accuracy, enhanced efficiency, reduced operational costs, and improved collaboration among pathologists.
Key Drivers, Barriers & Challenges in Whole-Slide Imaging Market
Key Drivers: The increasing prevalence of chronic diseases, the demand for improved diagnostic accuracy, and the need for efficient pathology workflows are major drivers. Technological advancements, such as AI-powered image analysis and cloud-based solutions, are also accelerating market growth. Government initiatives promoting digital healthcare are providing further impetus.
Key Challenges: High initial investment costs for equipment and software can be a barrier to adoption, particularly in resource-constrained settings. Regulatory hurdles and the need for skilled personnel to operate and maintain the systems also pose challenges. Competition among established players and emerging companies is intensifying, potentially impacting pricing and profitability. The estimated impact of these challenges on market growth is approximately xx% reduction in CAGR.
Emerging Opportunities in Whole-Slide Imaging Market
Untapped markets in developing countries present significant growth opportunities. The integration of AI and machine learning for automated diagnostics and improved image analysis is creating new avenues for innovation. The increasing adoption of telepathology is expanding access to specialized pathology services in remote areas. Growth opportunities also exist in personalized medicine and drug development, leveraging the capabilities of whole-slide imaging for advanced research applications.
Growth Accelerators in the Whole-Slide Imaging Market Industry
Strategic partnerships and collaborations between technology providers, healthcare institutions, and research organizations are driving market growth. The development of user-friendly software and intuitive interfaces is increasing accessibility and usability. Expansion of digital pathology networks and the development of robust cybersecurity measures are crucial for wider adoption. Furthermore, advancements in AI and machine learning are providing advanced diagnostic capabilities and pushing market expansion.
Key Players Shaping the Whole-Slide Imaging Market Market
- MBF Bioscience
- Hamamatsu Photonics KK (Hamamatsu Photonics)
- Nikon Corporation (Nikon)
- Leica Microsystems GmbH (Leica Microsystems)
- Koninklijke Philips N V (Philips)
- 3DHistech
- Visiopharm
- Indica Labs
- Molecular Machines & Industries
- Mikroscan Technologies Inc
- Olympus Corporation (Olympus)
- Akoya Biosciences
Notable Milestones in Whole-Slide Imaging Market Sector
- March 2023: Pramana, Inc. and PathPresenter collaborate to accelerate enterprise adoption of digital pathology workflows.
- March 2023: Hamamatsu enters a multi-year distribution agreement with Siemens Healthineers to expand digital pathology offerings.
In-Depth Whole-Slide Imaging Market Market Outlook
The Whole-Slide Imaging market is poised for continued expansion driven by technological advancements, increasing adoption in clinical settings, and expanding applications in research and drug development. Strategic partnerships and a focus on improving usability are key factors in future growth. The market offers substantial opportunities for companies offering innovative solutions, particularly those leveraging AI and cloud computing technologies. The market's future potential is substantial, with continued growth expected throughout the forecast period.
Whole-Slide Imaging Market Segmentation
-
1. Technology
- 1.1. Scanners
- 1.2. IT Infrastructure
- 1.3. Viewer
- 1.4. Image Management System
-
2. Application
- 2.1. Telepathology
- 2.2. Cytopathology
- 2.3. Immunohistochemistry
- 2.4. Hematopathology
-
3. End User
- 3.1. Academic Institute
- 3.2. Research
- 3.3. Others
Whole-Slide Imaging Market Segmentation By Geography
-
1. North America
- 1.1. United States
- 1.2. Canada
- 1.3. Mexico
-
2. Europe
- 2.1. Germany
- 2.2. United Kingdom
- 2.3. France
- 2.4. Italy
- 2.5. Spain
- 2.6. Rest of Europe
-
3. Asia Pacific
- 3.1. China
- 3.2. Japan
- 3.3. India
- 3.4. Australia
- 3.5. South korea
- 3.6. Rest of Asia Pacific
-
4. Middle East and Africa
- 4.1. GCC
- 4.2. South Africa
- 4.3. Rest of Middle East and Africa
-
5. South America
- 5.1. Brazil
- 5.2. Argentina
- 5.3. Rest of South America
Whole-Slide Imaging Market REPORT HIGHLIGHTS
| Aspects | Details |
|---|---|
| Study Period | 2019-2033 |
| Base Year | 2024 |
| Estimated Year | 2025 |
| Forecast Period | 2025-2033 |
| Historical Period | 2019-2024 |
| Growth Rate | CAGR of 6.39% from 2019-2033 |
| Segmentation |
|
Table of Contents
- 1. Introduction
- 1.1. Research Scope
- 1.2. Market Segmentation
- 1.3. Research Methodology
- 1.4. Definitions and Assumptions
- 2. Executive Summary
- 2.1. Introduction
- 3. Market Dynamics
- 3.1. Introduction
- 3.2. Market Drivers
- 3.2.1. Growing Popularity of Virtual Slides as Compared to Physical Slides; Technological Advancements in Whole Slide Imaging; Increasing Research in Drug Discovery
- 3.3. Market Restrains
- 3.3.1. Stringent Regulatory Approvals; High Cost of Whole Slide Imaging Systems
- 3.4. Market Trends
- 3.4.1. Telepathology Segment is Expected to Grow Significantly Over the Forecast Period
- 4. Market Factor Analysis
- 4.1. Porters Five Forces
- 4.2. Supply/Value Chain
- 4.3. PESTEL analysis
- 4.4. Market Entropy
- 4.5. Patent/Trademark Analysis
- 5. Global Whole-Slide Imaging Market Analysis, Insights and Forecast, 2019-2031
- 5.1. Market Analysis, Insights and Forecast - by Technology
- 5.1.1. Scanners
- 5.1.2. IT Infrastructure
- 5.1.3. Viewer
- 5.1.4. Image Management System
- 5.2. Market Analysis, Insights and Forecast - by Application
- 5.2.1. Telepathology
- 5.2.2. Cytopathology
- 5.2.3. Immunohistochemistry
- 5.2.4. Hematopathology
- 5.3. Market Analysis, Insights and Forecast - by End User
- 5.3.1. Academic Institute
- 5.3.2. Research
- 5.3.3. Others
- 5.4. Market Analysis, Insights and Forecast - by Region
- 5.4.1. North America
- 5.4.2. Europe
- 5.4.3. Asia Pacific
- 5.4.4. Middle East and Africa
- 5.4.5. South America
- 5.1. Market Analysis, Insights and Forecast - by Technology
- 6. North America Whole-Slide Imaging Market Analysis, Insights and Forecast, 2019-2031
- 6.1. Market Analysis, Insights and Forecast - by Technology
- 6.1.1. Scanners
- 6.1.2. IT Infrastructure
- 6.1.3. Viewer
- 6.1.4. Image Management System
- 6.2. Market Analysis, Insights and Forecast - by Application
- 6.2.1. Telepathology
- 6.2.2. Cytopathology
- 6.2.3. Immunohistochemistry
- 6.2.4. Hematopathology
- 6.3. Market Analysis, Insights and Forecast - by End User
- 6.3.1. Academic Institute
- 6.3.2. Research
- 6.3.3. Others
- 6.1. Market Analysis, Insights and Forecast - by Technology
- 7. Europe Whole-Slide Imaging Market Analysis, Insights and Forecast, 2019-2031
- 7.1. Market Analysis, Insights and Forecast - by Technology
- 7.1.1. Scanners
- 7.1.2. IT Infrastructure
- 7.1.3. Viewer
- 7.1.4. Image Management System
- 7.2. Market Analysis, Insights and Forecast - by Application
- 7.2.1. Telepathology
- 7.2.2. Cytopathology
- 7.2.3. Immunohistochemistry
- 7.2.4. Hematopathology
- 7.3. Market Analysis, Insights and Forecast - by End User
- 7.3.1. Academic Institute
- 7.3.2. Research
- 7.3.3. Others
- 7.1. Market Analysis, Insights and Forecast - by Technology
- 8. Asia Pacific Whole-Slide Imaging Market Analysis, Insights and Forecast, 2019-2031
- 8.1. Market Analysis, Insights and Forecast - by Technology
- 8.1.1. Scanners
- 8.1.2. IT Infrastructure
- 8.1.3. Viewer
- 8.1.4. Image Management System
- 8.2. Market Analysis, Insights and Forecast - by Application
- 8.2.1. Telepathology
- 8.2.2. Cytopathology
- 8.2.3. Immunohistochemistry
- 8.2.4. Hematopathology
- 8.3. Market Analysis, Insights and Forecast - by End User
- 8.3.1. Academic Institute
- 8.3.2. Research
- 8.3.3. Others
- 8.1. Market Analysis, Insights and Forecast - by Technology
- 9. Middle East and Africa Whole-Slide Imaging Market Analysis, Insights and Forecast, 2019-2031
- 9.1. Market Analysis, Insights and Forecast - by Technology
- 9.1.1. Scanners
- 9.1.2. IT Infrastructure
- 9.1.3. Viewer
- 9.1.4. Image Management System
- 9.2. Market Analysis, Insights and Forecast - by Application
- 9.2.1. Telepathology
- 9.2.2. Cytopathology
- 9.2.3. Immunohistochemistry
- 9.2.4. Hematopathology
- 9.3. Market Analysis, Insights and Forecast - by End User
- 9.3.1. Academic Institute
- 9.3.2. Research
- 9.3.3. Others
- 9.1. Market Analysis, Insights and Forecast - by Technology
- 10. South America Whole-Slide Imaging Market Analysis, Insights and Forecast, 2019-2031
- 10.1. Market Analysis, Insights and Forecast - by Technology
- 10.1.1. Scanners
- 10.1.2. IT Infrastructure
- 10.1.3. Viewer
- 10.1.4. Image Management System
- 10.2. Market Analysis, Insights and Forecast - by Application
- 10.2.1. Telepathology
- 10.2.2. Cytopathology
- 10.2.3. Immunohistochemistry
- 10.2.4. Hematopathology
- 10.3. Market Analysis, Insights and Forecast - by End User
- 10.3.1. Academic Institute
- 10.3.2. Research
- 10.3.3. Others
- 10.1. Market Analysis, Insights and Forecast - by Technology
- 11. North America Whole-Slide Imaging Market Analysis, Insights and Forecast, 2019-2031
- 11.1. Market Analysis, Insights and Forecast - By Country/Sub-region
- 11.1.1 United States
- 11.1.2 Canada
- 11.1.3 Mexico
- 12. Europe Whole-Slide Imaging Market Analysis, Insights and Forecast, 2019-2031
- 12.1. Market Analysis, Insights and Forecast - By Country/Sub-region
- 12.1.1 Germany
- 12.1.2 United Kingdom
- 12.1.3 France
- 12.1.4 Italy
- 12.1.5 Spain
- 12.1.6 Rest of Europe
- 13. Asia Pacific Whole-Slide Imaging Market Analysis, Insights and Forecast, 2019-2031
- 13.1. Market Analysis, Insights and Forecast - By Country/Sub-region
- 13.1.1 China
- 13.1.2 Japan
- 13.1.3 India
- 13.1.4 Australia
- 13.1.5 South korea
- 13.1.6 Rest of Asia Pacific
- 14. Middle East and Africa Whole-Slide Imaging Market Analysis, Insights and Forecast, 2019-2031
- 14.1. Market Analysis, Insights and Forecast - By Country/Sub-region
- 14.1.1 GCC
- 14.1.2 South Africa
- 14.1.3 Rest of Middle East and Africa
- 15. South America Whole-Slide Imaging Market Analysis, Insights and Forecast, 2019-2031
- 15.1. Market Analysis, Insights and Forecast - By Country/Sub-region
- 15.1.1 Brazil
- 15.1.2 Argentina
- 15.1.3 Rest of South America
- 16. Competitive Analysis
- 16.1. Global Market Share Analysis 2024
- 16.2. Company Profiles
- 16.2.1 MBF Bioscience
- 16.2.1.1. Overview
- 16.2.1.2. Products
- 16.2.1.3. SWOT Analysis
- 16.2.1.4. Recent Developments
- 16.2.1.5. Financials (Based on Availability)
- 16.2.2 Hamamatsu Photonics KK
- 16.2.2.1. Overview
- 16.2.2.2. Products
- 16.2.2.3. SWOT Analysis
- 16.2.2.4. Recent Developments
- 16.2.2.5. Financials (Based on Availability)
- 16.2.3 Nikon Corporation
- 16.2.3.1. Overview
- 16.2.3.2. Products
- 16.2.3.3. SWOT Analysis
- 16.2.3.4. Recent Developments
- 16.2.3.5. Financials (Based on Availability)
- 16.2.4 Leica Microsystems GmbH
- 16.2.4.1. Overview
- 16.2.4.2. Products
- 16.2.4.3. SWOT Analysis
- 16.2.4.4. Recent Developments
- 16.2.4.5. Financials (Based on Availability)
- 16.2.5 Koninklijke Philips N V
- 16.2.5.1. Overview
- 16.2.5.2. Products
- 16.2.5.3. SWOT Analysis
- 16.2.5.4. Recent Developments
- 16.2.5.5. Financials (Based on Availability)
- 16.2.6 3Dhistech
- 16.2.6.1. Overview
- 16.2.6.2. Products
- 16.2.6.3. SWOT Analysis
- 16.2.6.4. Recent Developments
- 16.2.6.5. Financials (Based on Availability)
- 16.2.7 Visiopharm
- 16.2.7.1. Overview
- 16.2.7.2. Products
- 16.2.7.3. SWOT Analysis
- 16.2.7.4. Recent Developments
- 16.2.7.5. Financials (Based on Availability)
- 16.2.8 Indica Labs
- 16.2.8.1. Overview
- 16.2.8.2. Products
- 16.2.8.3. SWOT Analysis
- 16.2.8.4. Recent Developments
- 16.2.8.5. Financials (Based on Availability)
- 16.2.9 Molecular Machines & Industries
- 16.2.9.1. Overview
- 16.2.9.2. Products
- 16.2.9.3. SWOT Analysis
- 16.2.9.4. Recent Developments
- 16.2.9.5. Financials (Based on Availability)
- 16.2.10 Mikroscan Technologies Inc
- 16.2.10.1. Overview
- 16.2.10.2. Products
- 16.2.10.3. SWOT Analysis
- 16.2.10.4. Recent Developments
- 16.2.10.5. Financials (Based on Availability)
- 16.2.11 Olympus Corporation
- 16.2.11.1. Overview
- 16.2.11.2. Products
- 16.2.11.3. SWOT Analysis
- 16.2.11.4. Recent Developments
- 16.2.11.5. Financials (Based on Availability)
- 16.2.12 Akoya Biosciences
- 16.2.12.1. Overview
- 16.2.12.2. Products
- 16.2.12.3. SWOT Analysis
- 16.2.12.4. Recent Developments
- 16.2.12.5. Financials (Based on Availability)
- 16.2.1 MBF Bioscience
List of Figures
- Figure 1: Global Whole-Slide Imaging Market Revenue Breakdown (Million, %) by Region 2024 & 2032
- Figure 2: Global Whole-Slide Imaging Market Volume Breakdown (K Unit, %) by Region 2024 & 2032
- Figure 3: North America Whole-Slide Imaging Market Revenue (Million), by Country 2024 & 2032
- Figure 4: North America Whole-Slide Imaging Market Volume (K Unit), by Country 2024 & 2032
- Figure 5: North America Whole-Slide Imaging Market Revenue Share (%), by Country 2024 & 2032
- Figure 6: North America Whole-Slide Imaging Market Volume Share (%), by Country 2024 & 2032
- Figure 7: Europe Whole-Slide Imaging Market Revenue (Million), by Country 2024 & 2032
- Figure 8: Europe Whole-Slide Imaging Market Volume (K Unit), by Country 2024 & 2032
- Figure 9: Europe Whole-Slide Imaging Market Revenue Share (%), by Country 2024 & 2032
- Figure 10: Europe Whole-Slide Imaging Market Volume Share (%), by Country 2024 & 2032
- Figure 11: Asia Pacific Whole-Slide Imaging Market Revenue (Million), by Country 2024 & 2032
- Figure 12: Asia Pacific Whole-Slide Imaging Market Volume (K Unit), by Country 2024 & 2032
- Figure 13: Asia Pacific Whole-Slide Imaging Market Revenue Share (%), by Country 2024 & 2032
- Figure 14: Asia Pacific Whole-Slide Imaging Market Volume Share (%), by Country 2024 & 2032
- Figure 15: Middle East and Africa Whole-Slide Imaging Market Revenue (Million), by Country 2024 & 2032
- Figure 16: Middle East and Africa Whole-Slide Imaging Market Volume (K Unit), by Country 2024 & 2032
- Figure 17: Middle East and Africa Whole-Slide Imaging Market Revenue Share (%), by Country 2024 & 2032
- Figure 18: Middle East and Africa Whole-Slide Imaging Market Volume Share (%), by Country 2024 & 2032
- Figure 19: South America Whole-Slide Imaging Market Revenue (Million), by Country 2024 & 2032
- Figure 20: South America Whole-Slide Imaging Market Volume (K Unit), by Country 2024 & 2032
- Figure 21: South America Whole-Slide Imaging Market Revenue Share (%), by Country 2024 & 2032
- Figure 22: South America Whole-Slide Imaging Market Volume Share (%), by Country 2024 & 2032
- Figure 23: North America Whole-Slide Imaging Market Revenue (Million), by Technology 2024 & 2032
- Figure 24: North America Whole-Slide Imaging Market Volume (K Unit), by Technology 2024 & 2032
- Figure 25: North America Whole-Slide Imaging Market Revenue Share (%), by Technology 2024 & 2032
- Figure 26: North America Whole-Slide Imaging Market Volume Share (%), by Technology 2024 & 2032
- Figure 27: North America Whole-Slide Imaging Market Revenue (Million), by Application 2024 & 2032
- Figure 28: North America Whole-Slide Imaging Market Volume (K Unit), by Application 2024 & 2032
- Figure 29: North America Whole-Slide Imaging Market Revenue Share (%), by Application 2024 & 2032
- Figure 30: North America Whole-Slide Imaging Market Volume Share (%), by Application 2024 & 2032
- Figure 31: North America Whole-Slide Imaging Market Revenue (Million), by End User 2024 & 2032
- Figure 32: North America Whole-Slide Imaging Market Volume (K Unit), by End User 2024 & 2032
- Figure 33: North America Whole-Slide Imaging Market Revenue Share (%), by End User 2024 & 2032
- Figure 34: North America Whole-Slide Imaging Market Volume Share (%), by End User 2024 & 2032
- Figure 35: North America Whole-Slide Imaging Market Revenue (Million), by Country 2024 & 2032
- Figure 36: North America Whole-Slide Imaging Market Volume (K Unit), by Country 2024 & 2032
- Figure 37: North America Whole-Slide Imaging Market Revenue Share (%), by Country 2024 & 2032
- Figure 38: North America Whole-Slide Imaging Market Volume Share (%), by Country 2024 & 2032
- Figure 39: Europe Whole-Slide Imaging Market Revenue (Million), by Technology 2024 & 2032
- Figure 40: Europe Whole-Slide Imaging Market Volume (K Unit), by Technology 2024 & 2032
- Figure 41: Europe Whole-Slide Imaging Market Revenue Share (%), by Technology 2024 & 2032
- Figure 42: Europe Whole-Slide Imaging Market Volume Share (%), by Technology 2024 & 2032
- Figure 43: Europe Whole-Slide Imaging Market Revenue (Million), by Application 2024 & 2032
- Figure 44: Europe Whole-Slide Imaging Market Volume (K Unit), by Application 2024 & 2032
- Figure 45: Europe Whole-Slide Imaging Market Revenue Share (%), by Application 2024 & 2032
- Figure 46: Europe Whole-Slide Imaging Market Volume Share (%), by Application 2024 & 2032
- Figure 47: Europe Whole-Slide Imaging Market Revenue (Million), by End User 2024 & 2032
- Figure 48: Europe Whole-Slide Imaging Market Volume (K Unit), by End User 2024 & 2032
- Figure 49: Europe Whole-Slide Imaging Market Revenue Share (%), by End User 2024 & 2032
- Figure 50: Europe Whole-Slide Imaging Market Volume Share (%), by End User 2024 & 2032
- Figure 51: Europe Whole-Slide Imaging Market Revenue (Million), by Country 2024 & 2032
- Figure 52: Europe Whole-Slide Imaging Market Volume (K Unit), by Country 2024 & 2032
- Figure 53: Europe Whole-Slide Imaging Market Revenue Share (%), by Country 2024 & 2032
- Figure 54: Europe Whole-Slide Imaging Market Volume Share (%), by Country 2024 & 2032
- Figure 55: Asia Pacific Whole-Slide Imaging Market Revenue (Million), by Technology 2024 & 2032
- Figure 56: Asia Pacific Whole-Slide Imaging Market Volume (K Unit), by Technology 2024 & 2032
- Figure 57: Asia Pacific Whole-Slide Imaging Market Revenue Share (%), by Technology 2024 & 2032
- Figure 58: Asia Pacific Whole-Slide Imaging Market Volume Share (%), by Technology 2024 & 2032
- Figure 59: Asia Pacific Whole-Slide Imaging Market Revenue (Million), by Application 2024 & 2032
- Figure 60: Asia Pacific Whole-Slide Imaging Market Volume (K Unit), by Application 2024 & 2032
- Figure 61: Asia Pacific Whole-Slide Imaging Market Revenue Share (%), by Application 2024 & 2032
- Figure 62: Asia Pacific Whole-Slide Imaging Market Volume Share (%), by Application 2024 & 2032
- Figure 63: Asia Pacific Whole-Slide Imaging Market Revenue (Million), by End User 2024 & 2032
- Figure 64: Asia Pacific Whole-Slide Imaging Market Volume (K Unit), by End User 2024 & 2032
- Figure 65: Asia Pacific Whole-Slide Imaging Market Revenue Share (%), by End User 2024 & 2032
- Figure 66: Asia Pacific Whole-Slide Imaging Market Volume Share (%), by End User 2024 & 2032
- Figure 67: Asia Pacific Whole-Slide Imaging Market Revenue (Million), by Country 2024 & 2032
- Figure 68: Asia Pacific Whole-Slide Imaging Market Volume (K Unit), by Country 2024 & 2032
- Figure 69: Asia Pacific Whole-Slide Imaging Market Revenue Share (%), by Country 2024 & 2032
- Figure 70: Asia Pacific Whole-Slide Imaging Market Volume Share (%), by Country 2024 & 2032
- Figure 71: Middle East and Africa Whole-Slide Imaging Market Revenue (Million), by Technology 2024 & 2032
- Figure 72: Middle East and Africa Whole-Slide Imaging Market Volume (K Unit), by Technology 2024 & 2032
- Figure 73: Middle East and Africa Whole-Slide Imaging Market Revenue Share (%), by Technology 2024 & 2032
- Figure 74: Middle East and Africa Whole-Slide Imaging Market Volume Share (%), by Technology 2024 & 2032
- Figure 75: Middle East and Africa Whole-Slide Imaging Market Revenue (Million), by Application 2024 & 2032
- Figure 76: Middle East and Africa Whole-Slide Imaging Market Volume (K Unit), by Application 2024 & 2032
- Figure 77: Middle East and Africa Whole-Slide Imaging Market Revenue Share (%), by Application 2024 & 2032
- Figure 78: Middle East and Africa Whole-Slide Imaging Market Volume Share (%), by Application 2024 & 2032
- Figure 79: Middle East and Africa Whole-Slide Imaging Market Revenue (Million), by End User 2024 & 2032
- Figure 80: Middle East and Africa Whole-Slide Imaging Market Volume (K Unit), by End User 2024 & 2032
- Figure 81: Middle East and Africa Whole-Slide Imaging Market Revenue Share (%), by End User 2024 & 2032
- Figure 82: Middle East and Africa Whole-Slide Imaging Market Volume Share (%), by End User 2024 & 2032
- Figure 83: Middle East and Africa Whole-Slide Imaging Market Revenue (Million), by Country 2024 & 2032
- Figure 84: Middle East and Africa Whole-Slide Imaging Market Volume (K Unit), by Country 2024 & 2032
- Figure 85: Middle East and Africa Whole-Slide Imaging Market Revenue Share (%), by Country 2024 & 2032
- Figure 86: Middle East and Africa Whole-Slide Imaging Market Volume Share (%), by Country 2024 & 2032
- Figure 87: South America Whole-Slide Imaging Market Revenue (Million), by Technology 2024 & 2032
- Figure 88: South America Whole-Slide Imaging Market Volume (K Unit), by Technology 2024 & 2032
- Figure 89: South America Whole-Slide Imaging Market Revenue Share (%), by Technology 2024 & 2032
- Figure 90: South America Whole-Slide Imaging Market Volume Share (%), by Technology 2024 & 2032
- Figure 91: South America Whole-Slide Imaging Market Revenue (Million), by Application 2024 & 2032
- Figure 92: South America Whole-Slide Imaging Market Volume (K Unit), by Application 2024 & 2032
- Figure 93: South America Whole-Slide Imaging Market Revenue Share (%), by Application 2024 & 2032
- Figure 94: South America Whole-Slide Imaging Market Volume Share (%), by Application 2024 & 2032
- Figure 95: South America Whole-Slide Imaging Market Revenue (Million), by End User 2024 & 2032
- Figure 96: South America Whole-Slide Imaging Market Volume (K Unit), by End User 2024 & 2032
- Figure 97: South America Whole-Slide Imaging Market Revenue Share (%), by End User 2024 & 2032
- Figure 98: South America Whole-Slide Imaging Market Volume Share (%), by End User 2024 & 2032
- Figure 99: South America Whole-Slide Imaging Market Revenue (Million), by Country 2024 & 2032
- Figure 100: South America Whole-Slide Imaging Market Volume (K Unit), by Country 2024 & 2032
- Figure 101: South America Whole-Slide Imaging Market Revenue Share (%), by Country 2024 & 2032
- Figure 102: South America Whole-Slide Imaging Market Volume Share (%), by Country 2024 & 2032
List of Tables
- Table 1: Global Whole-Slide Imaging Market Revenue Million Forecast, by Region 2019 & 2032
- Table 2: Global Whole-Slide Imaging Market Volume K Unit Forecast, by Region 2019 & 2032
- Table 3: Global Whole-Slide Imaging Market Revenue Million Forecast, by Technology 2019 & 2032
- Table 4: Global Whole-Slide Imaging Market Volume K Unit Forecast, by Technology 2019 & 2032
- Table 5: Global Whole-Slide Imaging Market Revenue Million Forecast, by Application 2019 & 2032
- Table 6: Global Whole-Slide Imaging Market Volume K Unit Forecast, by Application 2019 & 2032
- Table 7: Global Whole-Slide Imaging Market Revenue Million Forecast, by End User 2019 & 2032
- Table 8: Global Whole-Slide Imaging Market Volume K Unit Forecast, by End User 2019 & 2032
- Table 9: Global Whole-Slide Imaging Market Revenue Million Forecast, by Region 2019 & 2032
- Table 10: Global Whole-Slide Imaging Market Volume K Unit Forecast, by Region 2019 & 2032
- Table 11: Global Whole-Slide Imaging Market Revenue Million Forecast, by Country 2019 & 2032
- Table 12: Global Whole-Slide Imaging Market Volume K Unit Forecast, by Country 2019 & 2032
- Table 13: United States Whole-Slide Imaging Market Revenue (Million) Forecast, by Application 2019 & 2032
- Table 14: United States Whole-Slide Imaging Market Volume (K Unit) Forecast, by Application 2019 & 2032
- Table 15: Canada Whole-Slide Imaging Market Revenue (Million) Forecast, by Application 2019 & 2032
- Table 16: Canada Whole-Slide Imaging Market Volume (K Unit) Forecast, by Application 2019 & 2032
- Table 17: Mexico Whole-Slide Imaging Market Revenue (Million) Forecast, by Application 2019 & 2032
- Table 18: Mexico Whole-Slide Imaging Market Volume (K Unit) Forecast, by Application 2019 & 2032
- Table 19: Global Whole-Slide Imaging Market Revenue Million Forecast, by Country 2019 & 2032
- Table 20: Global Whole-Slide Imaging Market Volume K Unit Forecast, by Country 2019 & 2032
- Table 21: Germany Whole-Slide Imaging Market Revenue (Million) Forecast, by Application 2019 & 2032
- Table 22: Germany Whole-Slide Imaging Market Volume (K Unit) Forecast, by Application 2019 & 2032
- Table 23: United Kingdom Whole-Slide Imaging Market Revenue (Million) Forecast, by Application 2019 & 2032
- Table 24: United Kingdom Whole-Slide Imaging Market Volume (K Unit) Forecast, by Application 2019 & 2032
- Table 25: France Whole-Slide Imaging Market Revenue (Million) Forecast, by Application 2019 & 2032
- Table 26: France Whole-Slide Imaging Market Volume (K Unit) Forecast, by Application 2019 & 2032
- Table 27: Italy Whole-Slide Imaging Market Revenue (Million) Forecast, by Application 2019 & 2032
- Table 28: Italy Whole-Slide Imaging Market Volume (K Unit) Forecast, by Application 2019 & 2032
- Table 29: Spain Whole-Slide Imaging Market Revenue (Million) Forecast, by Application 2019 & 2032
- Table 30: Spain Whole-Slide Imaging Market Volume (K Unit) Forecast, by Application 2019 & 2032
- Table 31: Rest of Europe Whole-Slide Imaging Market Revenue (Million) Forecast, by Application 2019 & 2032
- Table 32: Rest of Europe Whole-Slide Imaging Market Volume (K Unit) Forecast, by Application 2019 & 2032
- Table 33: Global Whole-Slide Imaging Market Revenue Million Forecast, by Country 2019 & 2032
- Table 34: Global Whole-Slide Imaging Market Volume K Unit Forecast, by Country 2019 & 2032
- Table 35: China Whole-Slide Imaging Market Revenue (Million) Forecast, by Application 2019 & 2032
- Table 36: China Whole-Slide Imaging Market Volume (K Unit) Forecast, by Application 2019 & 2032
- Table 37: Japan Whole-Slide Imaging Market Revenue (Million) Forecast, by Application 2019 & 2032
- Table 38: Japan Whole-Slide Imaging Market Volume (K Unit) Forecast, by Application 2019 & 2032
- Table 39: India Whole-Slide Imaging Market Revenue (Million) Forecast, by Application 2019 & 2032
- Table 40: India Whole-Slide Imaging Market Volume (K Unit) Forecast, by Application 2019 & 2032
- Table 41: Australia Whole-Slide Imaging Market Revenue (Million) Forecast, by Application 2019 & 2032
- Table 42: Australia Whole-Slide Imaging Market Volume (K Unit) Forecast, by Application 2019 & 2032
- Table 43: South korea Whole-Slide Imaging Market Revenue (Million) Forecast, by Application 2019 & 2032
- Table 44: South korea Whole-Slide Imaging Market Volume (K Unit) Forecast, by Application 2019 & 2032
- Table 45: Rest of Asia Pacific Whole-Slide Imaging Market Revenue (Million) Forecast, by Application 2019 & 2032
- Table 46: Rest of Asia Pacific Whole-Slide Imaging Market Volume (K Unit) Forecast, by Application 2019 & 2032
- Table 47: Global Whole-Slide Imaging Market Revenue Million Forecast, by Country 2019 & 2032
- Table 48: Global Whole-Slide Imaging Market Volume K Unit Forecast, by Country 2019 & 2032
- Table 49: GCC Whole-Slide Imaging Market Revenue (Million) Forecast, by Application 2019 & 2032
- Table 50: GCC Whole-Slide Imaging Market Volume (K Unit) Forecast, by Application 2019 & 2032
- Table 51: South Africa Whole-Slide Imaging Market Revenue (Million) Forecast, by Application 2019 & 2032
- Table 52: South Africa Whole-Slide Imaging Market Volume (K Unit) Forecast, by Application 2019 & 2032
- Table 53: Rest of Middle East and Africa Whole-Slide Imaging Market Revenue (Million) Forecast, by Application 2019 & 2032
- Table 54: Rest of Middle East and Africa Whole-Slide Imaging Market Volume (K Unit) Forecast, by Application 2019 & 2032
- Table 55: Global Whole-Slide Imaging Market Revenue Million Forecast, by Country 2019 & 2032
- Table 56: Global Whole-Slide Imaging Market Volume K Unit Forecast, by Country 2019 & 2032
- Table 57: Brazil Whole-Slide Imaging Market Revenue (Million) Forecast, by Application 2019 & 2032
- Table 58: Brazil Whole-Slide Imaging Market Volume (K Unit) Forecast, by Application 2019 & 2032
- Table 59: Argentina Whole-Slide Imaging Market Revenue (Million) Forecast, by Application 2019 & 2032
- Table 60: Argentina Whole-Slide Imaging Market Volume (K Unit) Forecast, by Application 2019 & 2032
- Table 61: Rest of South America Whole-Slide Imaging Market Revenue (Million) Forecast, by Application 2019 & 2032
- Table 62: Rest of South America Whole-Slide Imaging Market Volume (K Unit) Forecast, by Application 2019 & 2032
- Table 63: Global Whole-Slide Imaging Market Revenue Million Forecast, by Technology 2019 & 2032
- Table 64: Global Whole-Slide Imaging Market Volume K Unit Forecast, by Technology 2019 & 2032
- Table 65: Global Whole-Slide Imaging Market Revenue Million Forecast, by Application 2019 & 2032
- Table 66: Global Whole-Slide Imaging Market Volume K Unit Forecast, by Application 2019 & 2032
- Table 67: Global Whole-Slide Imaging Market Revenue Million Forecast, by End User 2019 & 2032
- Table 68: Global Whole-Slide Imaging Market Volume K Unit Forecast, by End User 2019 & 2032
- Table 69: Global Whole-Slide Imaging Market Revenue Million Forecast, by Country 2019 & 2032
- Table 70: Global Whole-Slide Imaging Market Volume K Unit Forecast, by Country 2019 & 2032
- Table 71: United States Whole-Slide Imaging Market Revenue (Million) Forecast, by Application 2019 & 2032
- Table 72: United States Whole-Slide Imaging Market Volume (K Unit) Forecast, by Application 2019 & 2032
- Table 73: Canada Whole-Slide Imaging Market Revenue (Million) Forecast, by Application 2019 & 2032
- Table 74: Canada Whole-Slide Imaging Market Volume (K Unit) Forecast, by Application 2019 & 2032
- Table 75: Mexico Whole-Slide Imaging Market Revenue (Million) Forecast, by Application 2019 & 2032
- Table 76: Mexico Whole-Slide Imaging Market Volume (K Unit) Forecast, by Application 2019 & 2032
- Table 77: Global Whole-Slide Imaging Market Revenue Million Forecast, by Technology 2019 & 2032
- Table 78: Global Whole-Slide Imaging Market Volume K Unit Forecast, by Technology 2019 & 2032
- Table 79: Global Whole-Slide Imaging Market Revenue Million Forecast, by Application 2019 & 2032
- Table 80: Global Whole-Slide Imaging Market Volume K Unit Forecast, by Application 2019 & 2032
- Table 81: Global Whole-Slide Imaging Market Revenue Million Forecast, by End User 2019 & 2032
- Table 82: Global Whole-Slide Imaging Market Volume K Unit Forecast, by End User 2019 & 2032
- Table 83: Global Whole-Slide Imaging Market Revenue Million Forecast, by Country 2019 & 2032
- Table 84: Global Whole-Slide Imaging Market Volume K Unit Forecast, by Country 2019 & 2032
- Table 85: Germany Whole-Slide Imaging Market Revenue (Million) Forecast, by Application 2019 & 2032
- Table 86: Germany Whole-Slide Imaging Market Volume (K Unit) Forecast, by Application 2019 & 2032
- Table 87: United Kingdom Whole-Slide Imaging Market Revenue (Million) Forecast, by Application 2019 & 2032
- Table 88: United Kingdom Whole-Slide Imaging Market Volume (K Unit) Forecast, by Application 2019 & 2032
- Table 89: France Whole-Slide Imaging Market Revenue (Million) Forecast, by Application 2019 & 2032
- Table 90: France Whole-Slide Imaging Market Volume (K Unit) Forecast, by Application 2019 & 2032
- Table 91: Italy Whole-Slide Imaging Market Revenue (Million) Forecast, by Application 2019 & 2032
- Table 92: Italy Whole-Slide Imaging Market Volume (K Unit) Forecast, by Application 2019 & 2032
- Table 93: Spain Whole-Slide Imaging Market Revenue (Million) Forecast, by Application 2019 & 2032
- Table 94: Spain Whole-Slide Imaging Market Volume (K Unit) Forecast, by Application 2019 & 2032
- Table 95: Rest of Europe Whole-Slide Imaging Market Revenue (Million) Forecast, by Application 2019 & 2032
- Table 96: Rest of Europe Whole-Slide Imaging Market Volume (K Unit) Forecast, by Application 2019 & 2032
- Table 97: Global Whole-Slide Imaging Market Revenue Million Forecast, by Technology 2019 & 2032
- Table 98: Global Whole-Slide Imaging Market Volume K Unit Forecast, by Technology 2019 & 2032
- Table 99: Global Whole-Slide Imaging Market Revenue Million Forecast, by Application 2019 & 2032
- Table 100: Global Whole-Slide Imaging Market Volume K Unit Forecast, by Application 2019 & 2032
- Table 101: Global Whole-Slide Imaging Market Revenue Million Forecast, by End User 2019 & 2032
- Table 102: Global Whole-Slide Imaging Market Volume K Unit Forecast, by End User 2019 & 2032
- Table 103: Global Whole-Slide Imaging Market Revenue Million Forecast, by Country 2019 & 2032
- Table 104: Global Whole-Slide Imaging Market Volume K Unit Forecast, by Country 2019 & 2032
- Table 105: China Whole-Slide Imaging Market Revenue (Million) Forecast, by Application 2019 & 2032
- Table 106: China Whole-Slide Imaging Market Volume (K Unit) Forecast, by Application 2019 & 2032
- Table 107: Japan Whole-Slide Imaging Market Revenue (Million) Forecast, by Application 2019 & 2032
- Table 108: Japan Whole-Slide Imaging Market Volume (K Unit) Forecast, by Application 2019 & 2032
- Table 109: India Whole-Slide Imaging Market Revenue (Million) Forecast, by Application 2019 & 2032
- Table 110: India Whole-Slide Imaging Market Volume (K Unit) Forecast, by Application 2019 & 2032
- Table 111: Australia Whole-Slide Imaging Market Revenue (Million) Forecast, by Application 2019 & 2032
- Table 112: Australia Whole-Slide Imaging Market Volume (K Unit) Forecast, by Application 2019 & 2032
- Table 113: South korea Whole-Slide Imaging Market Revenue (Million) Forecast, by Application 2019 & 2032
- Table 114: South korea Whole-Slide Imaging Market Volume (K Unit) Forecast, by Application 2019 & 2032
- Table 115: Rest of Asia Pacific Whole-Slide Imaging Market Revenue (Million) Forecast, by Application 2019 & 2032
- Table 116: Rest of Asia Pacific Whole-Slide Imaging Market Volume (K Unit) Forecast, by Application 2019 & 2032
- Table 117: Global Whole-Slide Imaging Market Revenue Million Forecast, by Technology 2019 & 2032
- Table 118: Global Whole-Slide Imaging Market Volume K Unit Forecast, by Technology 2019 & 2032
- Table 119: Global Whole-Slide Imaging Market Revenue Million Forecast, by Application 2019 & 2032
- Table 120: Global Whole-Slide Imaging Market Volume K Unit Forecast, by Application 2019 & 2032
- Table 121: Global Whole-Slide Imaging Market Revenue Million Forecast, by End User 2019 & 2032
- Table 122: Global Whole-Slide Imaging Market Volume K Unit Forecast, by End User 2019 & 2032
- Table 123: Global Whole-Slide Imaging Market Revenue Million Forecast, by Country 2019 & 2032
- Table 124: Global Whole-Slide Imaging Market Volume K Unit Forecast, by Country 2019 & 2032
- Table 125: GCC Whole-Slide Imaging Market Revenue (Million) Forecast, by Application 2019 & 2032
- Table 126: GCC Whole-Slide Imaging Market Volume (K Unit) Forecast, by Application 2019 & 2032
- Table 127: South Africa Whole-Slide Imaging Market Revenue (Million) Forecast, by Application 2019 & 2032
- Table 128: South Africa Whole-Slide Imaging Market Volume (K Unit) Forecast, by Application 2019 & 2032
- Table 129: Rest of Middle East and Africa Whole-Slide Imaging Market Revenue (Million) Forecast, by Application 2019 & 2032
- Table 130: Rest of Middle East and Africa Whole-Slide Imaging Market Volume (K Unit) Forecast, by Application 2019 & 2032
- Table 131: Global Whole-Slide Imaging Market Revenue Million Forecast, by Technology 2019 & 2032
- Table 132: Global Whole-Slide Imaging Market Volume K Unit Forecast, by Technology 2019 & 2032
- Table 133: Global Whole-Slide Imaging Market Revenue Million Forecast, by Application 2019 & 2032
- Table 134: Global Whole-Slide Imaging Market Volume K Unit Forecast, by Application 2019 & 2032
- Table 135: Global Whole-Slide Imaging Market Revenue Million Forecast, by End User 2019 & 2032
- Table 136: Global Whole-Slide Imaging Market Volume K Unit Forecast, by End User 2019 & 2032
- Table 137: Global Whole-Slide Imaging Market Revenue Million Forecast, by Country 2019 & 2032
- Table 138: Global Whole-Slide Imaging Market Volume K Unit Forecast, by Country 2019 & 2032
- Table 139: Brazil Whole-Slide Imaging Market Revenue (Million) Forecast, by Application 2019 & 2032
- Table 140: Brazil Whole-Slide Imaging Market Volume (K Unit) Forecast, by Application 2019 & 2032
- Table 141: Argentina Whole-Slide Imaging Market Revenue (Million) Forecast, by Application 2019 & 2032
- Table 142: Argentina Whole-Slide Imaging Market Volume (K Unit) Forecast, by Application 2019 & 2032
- Table 143: Rest of South America Whole-Slide Imaging Market Revenue (Million) Forecast, by Application 2019 & 2032
- Table 144: Rest of South America Whole-Slide Imaging Market Volume (K Unit) Forecast, by Application 2019 & 2032
Frequently Asked Questions
1. What is the projected Compound Annual Growth Rate (CAGR) of the Whole-Slide Imaging Market?
The projected CAGR is approximately 6.39%.
2. Which companies are prominent players in the Whole-Slide Imaging Market?
Key companies in the market include MBF Bioscience, Hamamatsu Photonics KK, Nikon Corporation, Leica Microsystems GmbH, Koninklijke Philips N V, 3Dhistech, Visiopharm, Indica Labs, Molecular Machines & Industries, Mikroscan Technologies Inc, Olympus Corporation, Akoya Biosciences.
3. What are the main segments of the Whole-Slide Imaging Market?
The market segments include Technology, Application, End User.
4. Can you provide details about the market size?
The market size is estimated to be USD 1.21 Million as of 2022.
5. What are some drivers contributing to market growth?
Growing Popularity of Virtual Slides as Compared to Physical Slides; Technological Advancements in Whole Slide Imaging; Increasing Research in Drug Discovery.
6. What are the notable trends driving market growth?
Telepathology Segment is Expected to Grow Significantly Over the Forecast Period.
7. Are there any restraints impacting market growth?
Stringent Regulatory Approvals; High Cost of Whole Slide Imaging Systems.
8. Can you provide examples of recent developments in the market?
March 2023: Pramana, Inc., an AI-enabled health tech company modernizing the pathology sector, collaborated with PathPresenter to accelerate the enterprise adoption of digital pathology workflows. The goal of this collaboration is to ensure a seamless user experience for the labs adopting Pramana's Digital Pathology as a Service solution for whole slide image generation, as well as PathPresenter's image management/image viewing platform.
9. What pricing options are available for accessing the report?
Pricing options include single-user, multi-user, and enterprise licenses priced at USD 4750, USD 5250, and USD 8750 respectively.
10. Is the market size provided in terms of value or volume?
The market size is provided in terms of value, measured in Million and volume, measured in K Unit.
11. Are there any specific market keywords associated with the report?
Yes, the market keyword associated with the report is "Whole-Slide Imaging Market," which aids in identifying and referencing the specific market segment covered.
12. How do I determine which pricing option suits my needs best?
The pricing options vary based on user requirements and access needs. Individual users may opt for single-user licenses, while businesses requiring broader access may choose multi-user or enterprise licenses for cost-effective access to the report.
13. Are there any additional resources or data provided in the Whole-Slide Imaging Market report?
While the report offers comprehensive insights, it's advisable to review the specific contents or supplementary materials provided to ascertain if additional resources or data are available.
14. How can I stay updated on further developments or reports in the Whole-Slide Imaging Market?
To stay informed about further developments, trends, and reports in the Whole-Slide Imaging Market, consider subscribing to industry newsletters, following relevant companies and organizations, or regularly checking reputable industry news sources and publications.
Methodology
Step 1 - Identification of Relevant Samples Size from Population Database


Step 2 - Approaches for Defining Global Market Size (Value, Volume* & Price*)

Note*: In applicable scenarios
Step 3 - Data Sources
Primary Research
- Web Analytics
- Survey Reports
- Research Institute
- Latest Research Reports
- Opinion Leaders
Secondary Research
- Annual Reports
- White Paper
- Latest Press Release
- Industry Association
- Paid Database
- Investor Presentations

Step 4 - Data Triangulation
Involves using different sources of information in order to increase the validity of a study
These sources are likely to be stakeholders in a program - participants, other researchers, program staff, other community members, and so on.
Then we put all data in single framework & apply various statistical tools to find out the dynamic on the market.
During the analysis stage, feedback from the stakeholder groups would be compared to determine areas of agreement as well as areas of divergence
