

Key Insights
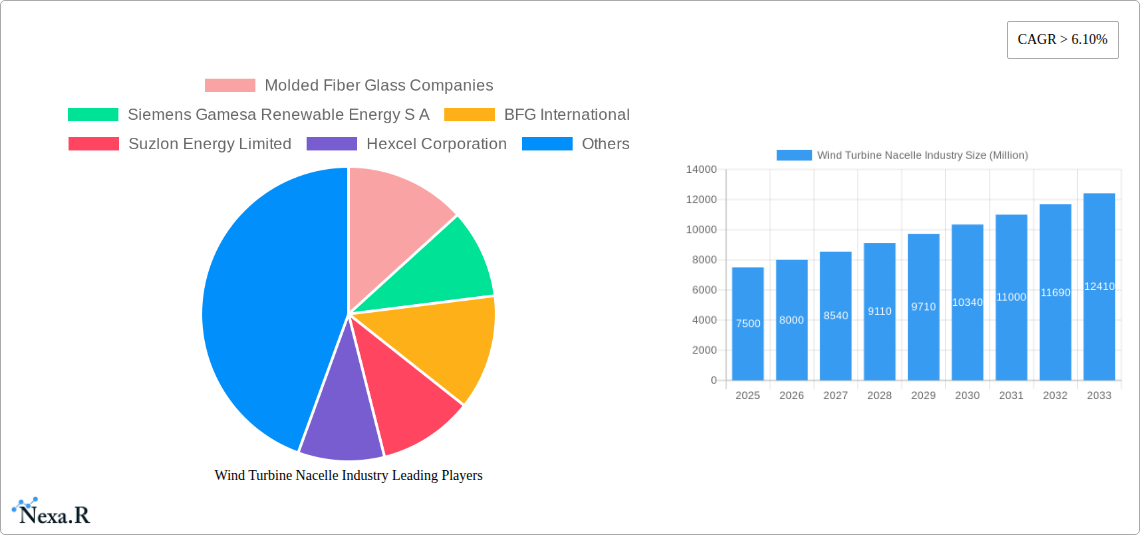
The global wind turbine nacelle market is experiencing robust growth, driven by the increasing demand for renewable energy sources and supportive government policies aimed at combating climate change. The market's compound annual growth rate (CAGR) exceeding 6.10% from 2019 to 2024 indicates a significant upward trajectory. This growth is fueled by several key factors, including the expansion of offshore wind farms, which require advanced nacelle technology for robust performance in harsh marine environments, and a rising preference for larger turbine capacities (above 2 MW) to enhance energy generation efficiency. Technological advancements, such as the development of lightweight yet durable materials (like those offered by companies such as Molded Fiber Glass Companies and Hexcel Corporation) and improved control systems are further bolstering market expansion. While challenges remain, such as the high initial investment costs associated with wind turbine installations and potential supply chain disruptions, the long-term prospects for the industry remain positive, particularly in regions with substantial renewable energy targets, such as North America, Europe, and Asia-Pacific.
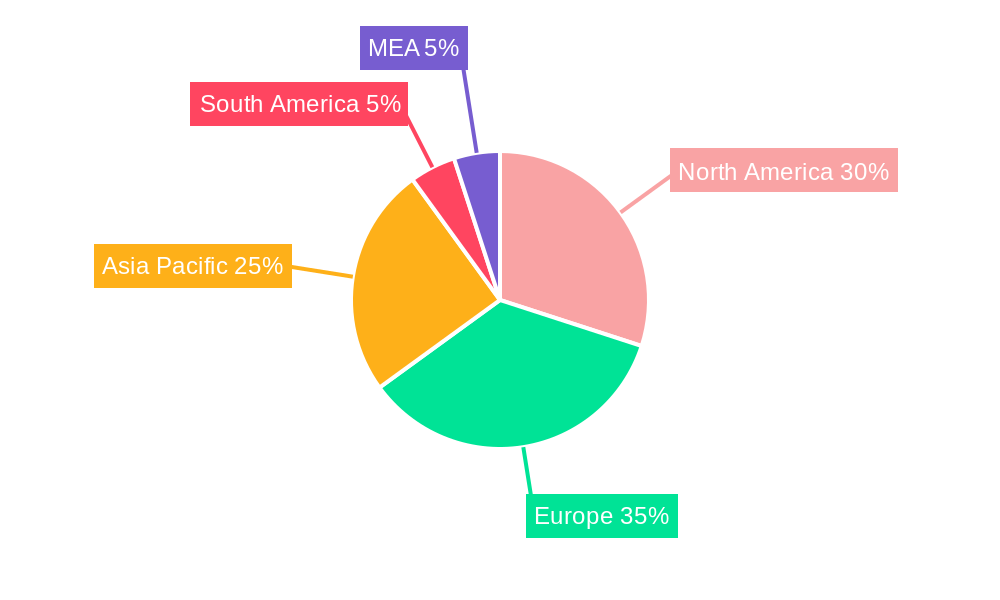
The market segmentation reveals a clear preference towards onshore deployments, although the offshore segment is rapidly gaining traction due to the vast untapped potential of offshore wind resources. The increasing adoption of turbines with capacities exceeding 2 MW is a prominent trend, indicative of the industry's focus on maximizing energy output. Leading players like Siemens Gamesa Renewable Energy S.A., General Electric Company, and Nordex SE are driving innovation and market consolidation through strategic partnerships, technological advancements, and geographical expansion. The geographic distribution of market share suggests a significant concentration in developed economies, with North America, Europe, and Asia-Pacific leading the charge. However, emerging economies in regions like South America and the Middle East and Africa are expected to witness substantial growth in the coming years, driven by increasing investments in renewable energy infrastructure. The forecast period (2025-2033) promises continued expansion, driven by technological progress, supportive policy frameworks, and growing awareness of the urgent need for sustainable energy solutions.
Wind Turbine Nacelle Industry Market Report: 2019-2033
This comprehensive report provides an in-depth analysis of the Wind Turbine Nacelle industry, encompassing market dynamics, growth trends, regional analysis, product landscape, key players, and future outlook. The report covers the period from 2019 to 2033, with a focus on the forecast period from 2025 to 2033 and a base year of 2025. The parent market is the Renewable Energy sector, while the child market is Wind Turbine Components. This report is invaluable for industry professionals, investors, and anyone seeking a detailed understanding of this dynamic market. Market values are presented in millions of USD.
Wind Turbine Nacelle Industry Market Dynamics & Structure
The wind turbine nacelle market is characterized by moderate concentration, with a few major players holding significant market share. Technological innovation, driven by the need for higher efficiency and lower costs, is a key driver. Stringent regulatory frameworks, particularly concerning safety and environmental impact, shape market practices. Competitive product substitutes, such as alternative energy generation technologies, exert pressure on market growth. End-user demographics, primarily focused on energy producers and utilities, significantly influence market demand. M&A activity has been relatively moderate, with xx deals recorded between 2019 and 2024, indicating consolidation and strategic expansion within the industry.
- Market Concentration: Moderately concentrated, with top 5 players holding xx% of market share in 2024.
- Technological Innovation: Focus on lightweight materials, advanced control systems, and modular design for improved efficiency and reduced maintenance.
- Regulatory Framework: Stringent safety and environmental regulations impacting manufacturing and deployment.
- Competitive Substitutes: Solar power, hydropower, and other renewable energy sources compete for market share.
- End-User Demographics: Primarily utility companies, independent power producers (IPPs), and energy cooperatives.
- M&A Trends: xx M&A deals in 2019-2024, indicating industry consolidation and strategic expansion. Innovation barriers include high R&D costs and long lead times for product development.
Wind Turbine Nacelle Industry Growth Trends & Insights
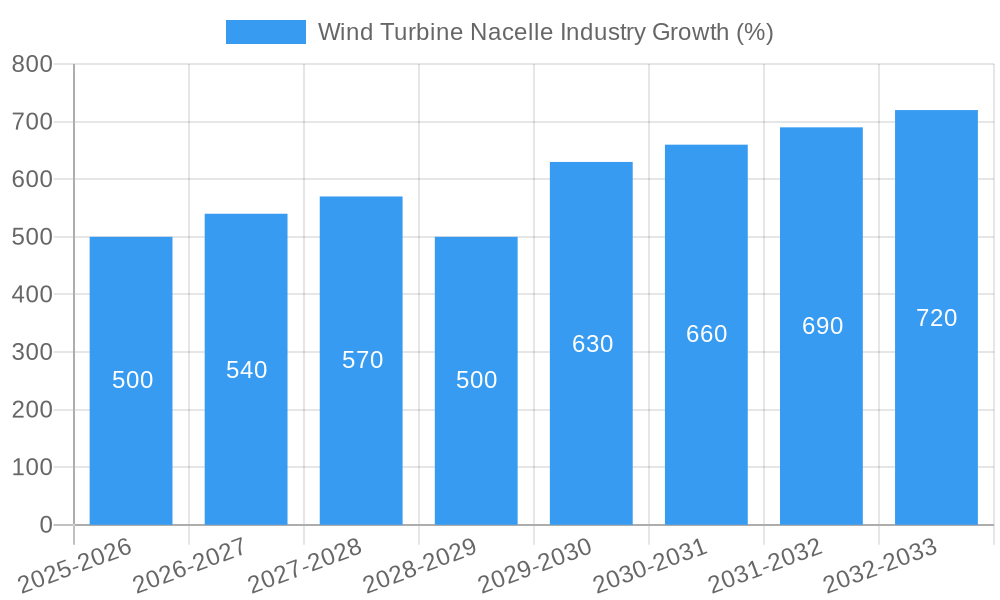
The global wind turbine nacelle market experienced a CAGR of xx% from 2019 to 2024, reaching a market size of xx million in 2024. This growth is primarily attributed to the increasing demand for renewable energy globally, driven by government policies promoting sustainable energy sources and the decreasing cost of wind energy. Technological advancements, such as the development of larger and more efficient turbines, have further fueled market expansion. Consumer behavior shifts towards environmentally conscious energy consumption also underpin this growth. The forecast period (2025-2033) projects a CAGR of xx%, with the market size expected to reach xx million by 2033. This projection takes into account factors like increasing offshore wind capacity, technological advancements, and supportive government policies. Market penetration rates are expected to increase significantly, especially in emerging markets.
Dominant Regions, Countries, or Segments in Wind Turbine Nacelle Industry
Europe and North America currently dominate the wind turbine nacelle market, driven by established wind energy sectors and supportive government policies. However, the Asia-Pacific region is experiencing the fastest growth, fueled by substantial investments in renewable energy infrastructure and increasing government support for wind energy projects. Within segments, the onshore deployment of turbines with capacities of 2 MW and above currently accounts for the largest share of the market. The Offshore segment shows high growth potential.
- Onshore vs. Offshore: Onshore currently dominates, but offshore deployment is expected to experience higher growth rates in the forecast period.
- Turbine Capacity: Greater than 2 MW capacity segment is the largest, with significant potential for growth in the larger capacity range.
- Key Drivers: Government subsidies and renewable energy mandates, falling turbine costs, grid infrastructure investments, and technological advancements.
- Market Share: Europe and North America hold the largest market share currently, while Asia-Pacific is the fastest-growing region.
Wind Turbine Nacelle Industry Product Landscape
Nacelle designs are continuously evolving, focusing on increased power output, enhanced reliability, reduced maintenance needs, and improved cost-effectiveness. Modular nacelle designs are emerging, enabling easier transportation, assembly, and maintenance. This innovation addresses logistical challenges associated with the transportation and installation of increasingly larger nacelles, improving efficiency and reducing overall project costs. Advanced sensors and digitalization are also being incorporated for predictive maintenance and remote monitoring, maximizing uptime and optimizing operational efficiency.
Key Drivers, Barriers & Challenges in Wind Turbine Nacelle Industry
Key Drivers:
- Increasing demand for renewable energy, driven by climate change concerns and government policies.
- Technological advancements resulting in higher efficiency and lower costs of wind turbines.
- Growing investments in wind energy infrastructure, particularly in offshore wind projects.
Key Challenges:
- Supply chain disruptions impacting the availability of raw materials and components.
- Regulatory hurdles and permitting processes delaying project development.
- Intense competition among manufacturers leading to price pressure. This pressure is estimated to result in a xx% reduction in average nacelle prices by 2033.
Emerging Opportunities in Wind Turbine Nacelle Industry
- Floating offshore wind technology presents significant opportunities for expansion in deeper waters.
- Integration of advanced technologies like AI and machine learning for improved predictive maintenance and operational efficiency.
- Development of lightweight and cost-effective materials to reduce nacelle weight and improve transportation.
Growth Accelerators in the Wind Turbine Nacelle Industry Industry
Technological advancements, strategic partnerships, and government support will be key drivers of long-term growth. Innovations in materials science, digitalization, and design will improve efficiency and reduce costs. Collaborations between manufacturers and energy companies will enhance project development and deployment. Continued government support, including subsidies and tax incentives, will maintain market momentum.
Key Players Shaping the Wind Turbine Nacelle Industry Market
- Molded Fiber Glass Companies
- Siemens Gamesa Renewable Energy S A
- BFG International
- Suzlon Energy Limited
- Hexcel Corporation
- General Electric Company
- Nordex SE
- ENERCON GmbH
Notable Milestones in Wind Turbine Nacelle Industry Sector
- November 2021: Vestas unveils the first modular nacelle design, improving logistics and maintenance.
- September 2021: Siemens Gamesa and Orsted open a new nacelle assembly facility in Taiwan, expanding manufacturing capacity in Asia-Pacific.
In-Depth Wind Turbine Nacelle Industry Market Outlook
The future of the wind turbine nacelle market is bright, driven by the increasing global demand for renewable energy and technological advancements. Strategic partnerships and innovation will be critical to success. The market is poised for significant growth, with substantial opportunities for manufacturers to expand capacity, develop innovative products, and capitalize on emerging technologies and markets. The focus on cost reduction, efficiency improvement, and sustainable manufacturing practices will be crucial for long-term success.
Wind Turbine Nacelle Industry Segmentation
-
1. Location of Deployment
- 1.1. Onshore
- 1.2. Offshore
-
2. Turbine Capacity
- 2.1. Less than 1.5 MW
- 2.2. 1.5 to 2 MW
- 2.3. 2 to 2.5 MW
- 2.4. Greater than 2.5 MW
Wind Turbine Nacelle Industry Segmentation By Geography
- 1. North America
- 2. Europe
- 3. Asia Pacific
- 4. South America
- 5. Middle East and Africa
Wind Turbine Nacelle Industry REPORT HIGHLIGHTS
| Aspects | Details |
|---|---|
| Study Period | 2019-2033 |
| Base Year | 2024 |
| Estimated Year | 2025 |
| Forecast Period | 2025-2033 |
| Historical Period | 2019-2024 |
| Growth Rate | CAGR of > 6.10% from 2019-2033 |
| Segmentation |
|
Table of Contents
- 1. Introduction
- 1.1. Research Scope
- 1.2. Market Segmentation
- 1.3. Research Methodology
- 1.4. Definitions and Assumptions
- 2. Executive Summary
- 2.1. Introduction
- 3. Market Dynamics
- 3.1. Introduction
- 3.2. Market Drivers
- 3.2.1 4.; Increasing Amount of Waste Generation
- 3.2.2 Growing Concern for Waste Management to Meet the Needs for Sustainable Urban Living4.; Increasing Focus on Non-fossil Fuel Sources of Energy
- 3.3. Market Restrains
- 3.3.1. 4.; Expensive Nature of Incinerators
- 3.4. Market Trends
- 3.4.1. Onshore Segment is Expected to Dominate the Market
- 4. Market Factor Analysis
- 4.1. Porters Five Forces
- 4.2. Supply/Value Chain
- 4.3. PESTEL analysis
- 4.4. Market Entropy
- 4.5. Patent/Trademark Analysis
- 5. Global Wind Turbine Nacelle Industry Analysis, Insights and Forecast, 2019-2031
- 5.1. Market Analysis, Insights and Forecast - by Location of Deployment
- 5.1.1. Onshore
- 5.1.2. Offshore
- 5.2. Market Analysis, Insights and Forecast - by Turbine Capacity
- 5.2.1. Less than 1.5 MW
- 5.2.2. 1.5 to 2 MW
- 5.2.3. 2 to 2.5 MW
- 5.2.4. Greater than 2.5 MW
- 5.3. Market Analysis, Insights and Forecast - by Region
- 5.3.1. North America
- 5.3.2. Europe
- 5.3.3. Asia Pacific
- 5.3.4. South America
- 5.3.5. Middle East and Africa
- 5.1. Market Analysis, Insights and Forecast - by Location of Deployment
- 6. North America Wind Turbine Nacelle Industry Analysis, Insights and Forecast, 2019-2031
- 6.1. Market Analysis, Insights and Forecast - by Location of Deployment
- 6.1.1. Onshore
- 6.1.2. Offshore
- 6.2. Market Analysis, Insights and Forecast - by Turbine Capacity
- 6.2.1. Less than 1.5 MW
- 6.2.2. 1.5 to 2 MW
- 6.2.3. 2 to 2.5 MW
- 6.2.4. Greater than 2.5 MW
- 6.1. Market Analysis, Insights and Forecast - by Location of Deployment
- 7. Europe Wind Turbine Nacelle Industry Analysis, Insights and Forecast, 2019-2031
- 7.1. Market Analysis, Insights and Forecast - by Location of Deployment
- 7.1.1. Onshore
- 7.1.2. Offshore
- 7.2. Market Analysis, Insights and Forecast - by Turbine Capacity
- 7.2.1. Less than 1.5 MW
- 7.2.2. 1.5 to 2 MW
- 7.2.3. 2 to 2.5 MW
- 7.2.4. Greater than 2.5 MW
- 7.1. Market Analysis, Insights and Forecast - by Location of Deployment
- 8. Asia Pacific Wind Turbine Nacelle Industry Analysis, Insights and Forecast, 2019-2031
- 8.1. Market Analysis, Insights and Forecast - by Location of Deployment
- 8.1.1. Onshore
- 8.1.2. Offshore
- 8.2. Market Analysis, Insights and Forecast - by Turbine Capacity
- 8.2.1. Less than 1.5 MW
- 8.2.2. 1.5 to 2 MW
- 8.2.3. 2 to 2.5 MW
- 8.2.4. Greater than 2.5 MW
- 8.1. Market Analysis, Insights and Forecast - by Location of Deployment
- 9. South America Wind Turbine Nacelle Industry Analysis, Insights and Forecast, 2019-2031
- 9.1. Market Analysis, Insights and Forecast - by Location of Deployment
- 9.1.1. Onshore
- 9.1.2. Offshore
- 9.2. Market Analysis, Insights and Forecast - by Turbine Capacity
- 9.2.1. Less than 1.5 MW
- 9.2.2. 1.5 to 2 MW
- 9.2.3. 2 to 2.5 MW
- 9.2.4. Greater than 2.5 MW
- 9.1. Market Analysis, Insights and Forecast - by Location of Deployment
- 10. Middle East and Africa Wind Turbine Nacelle Industry Analysis, Insights and Forecast, 2019-2031
- 10.1. Market Analysis, Insights and Forecast - by Location of Deployment
- 10.1.1. Onshore
- 10.1.2. Offshore
- 10.2. Market Analysis, Insights and Forecast - by Turbine Capacity
- 10.2.1. Less than 1.5 MW
- 10.2.2. 1.5 to 2 MW
- 10.2.3. 2 to 2.5 MW
- 10.2.4. Greater than 2.5 MW
- 10.1. Market Analysis, Insights and Forecast - by Location of Deployment
- 11. North America Wind Turbine Nacelle Industry Analysis, Insights and Forecast, 2019-2031
- 11.1. Market Analysis, Insights and Forecast - By Country/Sub-region
- 11.1.1 United States
- 11.1.2 Canada
- 11.1.3 Mexico
- 12. Europe Wind Turbine Nacelle Industry Analysis, Insights and Forecast, 2019-2031
- 12.1. Market Analysis, Insights and Forecast - By Country/Sub-region
- 12.1.1 Germany
- 12.1.2 United Kingdom
- 12.1.3 France
- 12.1.4 Spain
- 12.1.5 Italy
- 12.1.6 Spain
- 12.1.7 Belgium
- 12.1.8 Netherland
- 12.1.9 Nordics
- 12.1.10 Rest of Europe
- 13. Asia Pacific Wind Turbine Nacelle Industry Analysis, Insights and Forecast, 2019-2031
- 13.1. Market Analysis, Insights and Forecast - By Country/Sub-region
- 13.1.1 China
- 13.1.2 Japan
- 13.1.3 India
- 13.1.4 South Korea
- 13.1.5 Southeast Asia
- 13.1.6 Australia
- 13.1.7 Indonesia
- 13.1.8 Phillipes
- 13.1.9 Singapore
- 13.1.10 Thailandc
- 13.1.11 Rest of Asia Pacific
- 14. South America Wind Turbine Nacelle Industry Analysis, Insights and Forecast, 2019-2031
- 14.1. Market Analysis, Insights and Forecast - By Country/Sub-region
- 14.1.1 Brazil
- 14.1.2 Argentina
- 14.1.3 Peru
- 14.1.4 Chile
- 14.1.5 Colombia
- 14.1.6 Ecuador
- 14.1.7 Venezuela
- 14.1.8 Rest of South America
- 15. MEA Wind Turbine Nacelle Industry Analysis, Insights and Forecast, 2019-2031
- 15.1. Market Analysis, Insights and Forecast - By Country/Sub-region
- 15.1.1 United Arab Emirates
- 15.1.2 Saudi Arabia
- 15.1.3 South Africa
- 15.1.4 Rest of Middle East and Africa
- 16. Competitive Analysis
- 16.1. Global Market Share Analysis 2024
- 16.2. Company Profiles
- 16.2.1 Molded Fiber Glass Companies
- 16.2.1.1. Overview
- 16.2.1.2. Products
- 16.2.1.3. SWOT Analysis
- 16.2.1.4. Recent Developments
- 16.2.1.5. Financials (Based on Availability)
- 16.2.2 Siemens Gamesa Renewable Energy S A
- 16.2.2.1. Overview
- 16.2.2.2. Products
- 16.2.2.3. SWOT Analysis
- 16.2.2.4. Recent Developments
- 16.2.2.5. Financials (Based on Availability)
- 16.2.3 BFG International
- 16.2.3.1. Overview
- 16.2.3.2. Products
- 16.2.3.3. SWOT Analysis
- 16.2.3.4. Recent Developments
- 16.2.3.5. Financials (Based on Availability)
- 16.2.4 Suzlon Energy Limited
- 16.2.4.1. Overview
- 16.2.4.2. Products
- 16.2.4.3. SWOT Analysis
- 16.2.4.4. Recent Developments
- 16.2.4.5. Financials (Based on Availability)
- 16.2.5 Hexcel Corporation
- 16.2.5.1. Overview
- 16.2.5.2. Products
- 16.2.5.3. SWOT Analysis
- 16.2.5.4. Recent Developments
- 16.2.5.5. Financials (Based on Availability)
- 16.2.6 General Electric Company
- 16.2.6.1. Overview
- 16.2.6.2. Products
- 16.2.6.3. SWOT Analysis
- 16.2.6.4. Recent Developments
- 16.2.6.5. Financials (Based on Availability)
- 16.2.7 Nordex SE
- 16.2.7.1. Overview
- 16.2.7.2. Products
- 16.2.7.3. SWOT Analysis
- 16.2.7.4. Recent Developments
- 16.2.7.5. Financials (Based on Availability)
- 16.2.8 ENERCON GmbH
- 16.2.8.1. Overview
- 16.2.8.2. Products
- 16.2.8.3. SWOT Analysis
- 16.2.8.4. Recent Developments
- 16.2.8.5. Financials (Based on Availability)
- 16.2.1 Molded Fiber Glass Companies
List of Figures
- Figure 1: Global Wind Turbine Nacelle Industry Revenue Breakdown (Million, %) by Region 2024 & 2032
- Figure 2: Global Wind Turbine Nacelle Industry Volume Breakdown (Megawatt, %) by Region 2024 & 2032
- Figure 3: North America Wind Turbine Nacelle Industry Revenue (Million), by Country 2024 & 2032
- Figure 4: North America Wind Turbine Nacelle Industry Volume (Megawatt), by Country 2024 & 2032
- Figure 5: North America Wind Turbine Nacelle Industry Revenue Share (%), by Country 2024 & 2032
- Figure 6: North America Wind Turbine Nacelle Industry Volume Share (%), by Country 2024 & 2032
- Figure 7: Europe Wind Turbine Nacelle Industry Revenue (Million), by Country 2024 & 2032
- Figure 8: Europe Wind Turbine Nacelle Industry Volume (Megawatt), by Country 2024 & 2032
- Figure 9: Europe Wind Turbine Nacelle Industry Revenue Share (%), by Country 2024 & 2032
- Figure 10: Europe Wind Turbine Nacelle Industry Volume Share (%), by Country 2024 & 2032
- Figure 11: Asia Pacific Wind Turbine Nacelle Industry Revenue (Million), by Country 2024 & 2032
- Figure 12: Asia Pacific Wind Turbine Nacelle Industry Volume (Megawatt), by Country 2024 & 2032
- Figure 13: Asia Pacific Wind Turbine Nacelle Industry Revenue Share (%), by Country 2024 & 2032
- Figure 14: Asia Pacific Wind Turbine Nacelle Industry Volume Share (%), by Country 2024 & 2032
- Figure 15: South America Wind Turbine Nacelle Industry Revenue (Million), by Country 2024 & 2032
- Figure 16: South America Wind Turbine Nacelle Industry Volume (Megawatt), by Country 2024 & 2032
- Figure 17: South America Wind Turbine Nacelle Industry Revenue Share (%), by Country 2024 & 2032
- Figure 18: South America Wind Turbine Nacelle Industry Volume Share (%), by Country 2024 & 2032
- Figure 19: MEA Wind Turbine Nacelle Industry Revenue (Million), by Country 2024 & 2032
- Figure 20: MEA Wind Turbine Nacelle Industry Volume (Megawatt), by Country 2024 & 2032
- Figure 21: MEA Wind Turbine Nacelle Industry Revenue Share (%), by Country 2024 & 2032
- Figure 22: MEA Wind Turbine Nacelle Industry Volume Share (%), by Country 2024 & 2032
- Figure 23: North America Wind Turbine Nacelle Industry Revenue (Million), by Location of Deployment 2024 & 2032
- Figure 24: North America Wind Turbine Nacelle Industry Volume (Megawatt), by Location of Deployment 2024 & 2032
- Figure 25: North America Wind Turbine Nacelle Industry Revenue Share (%), by Location of Deployment 2024 & 2032
- Figure 26: North America Wind Turbine Nacelle Industry Volume Share (%), by Location of Deployment 2024 & 2032
- Figure 27: North America Wind Turbine Nacelle Industry Revenue (Million), by Turbine Capacity 2024 & 2032
- Figure 28: North America Wind Turbine Nacelle Industry Volume (Megawatt), by Turbine Capacity 2024 & 2032
- Figure 29: North America Wind Turbine Nacelle Industry Revenue Share (%), by Turbine Capacity 2024 & 2032
- Figure 30: North America Wind Turbine Nacelle Industry Volume Share (%), by Turbine Capacity 2024 & 2032
- Figure 31: North America Wind Turbine Nacelle Industry Revenue (Million), by Country 2024 & 2032
- Figure 32: North America Wind Turbine Nacelle Industry Volume (Megawatt), by Country 2024 & 2032
- Figure 33: North America Wind Turbine Nacelle Industry Revenue Share (%), by Country 2024 & 2032
- Figure 34: North America Wind Turbine Nacelle Industry Volume Share (%), by Country 2024 & 2032
- Figure 35: Europe Wind Turbine Nacelle Industry Revenue (Million), by Location of Deployment 2024 & 2032
- Figure 36: Europe Wind Turbine Nacelle Industry Volume (Megawatt), by Location of Deployment 2024 & 2032
- Figure 37: Europe Wind Turbine Nacelle Industry Revenue Share (%), by Location of Deployment 2024 & 2032
- Figure 38: Europe Wind Turbine Nacelle Industry Volume Share (%), by Location of Deployment 2024 & 2032
- Figure 39: Europe Wind Turbine Nacelle Industry Revenue (Million), by Turbine Capacity 2024 & 2032
- Figure 40: Europe Wind Turbine Nacelle Industry Volume (Megawatt), by Turbine Capacity 2024 & 2032
- Figure 41: Europe Wind Turbine Nacelle Industry Revenue Share (%), by Turbine Capacity 2024 & 2032
- Figure 42: Europe Wind Turbine Nacelle Industry Volume Share (%), by Turbine Capacity 2024 & 2032
- Figure 43: Europe Wind Turbine Nacelle Industry Revenue (Million), by Country 2024 & 2032
- Figure 44: Europe Wind Turbine Nacelle Industry Volume (Megawatt), by Country 2024 & 2032
- Figure 45: Europe Wind Turbine Nacelle Industry Revenue Share (%), by Country 2024 & 2032
- Figure 46: Europe Wind Turbine Nacelle Industry Volume Share (%), by Country 2024 & 2032
- Figure 47: Asia Pacific Wind Turbine Nacelle Industry Revenue (Million), by Location of Deployment 2024 & 2032
- Figure 48: Asia Pacific Wind Turbine Nacelle Industry Volume (Megawatt), by Location of Deployment 2024 & 2032
- Figure 49: Asia Pacific Wind Turbine Nacelle Industry Revenue Share (%), by Location of Deployment 2024 & 2032
- Figure 50: Asia Pacific Wind Turbine Nacelle Industry Volume Share (%), by Location of Deployment 2024 & 2032
- Figure 51: Asia Pacific Wind Turbine Nacelle Industry Revenue (Million), by Turbine Capacity 2024 & 2032
- Figure 52: Asia Pacific Wind Turbine Nacelle Industry Volume (Megawatt), by Turbine Capacity 2024 & 2032
- Figure 53: Asia Pacific Wind Turbine Nacelle Industry Revenue Share (%), by Turbine Capacity 2024 & 2032
- Figure 54: Asia Pacific Wind Turbine Nacelle Industry Volume Share (%), by Turbine Capacity 2024 & 2032
- Figure 55: Asia Pacific Wind Turbine Nacelle Industry Revenue (Million), by Country 2024 & 2032
- Figure 56: Asia Pacific Wind Turbine Nacelle Industry Volume (Megawatt), by Country 2024 & 2032
- Figure 57: Asia Pacific Wind Turbine Nacelle Industry Revenue Share (%), by Country 2024 & 2032
- Figure 58: Asia Pacific Wind Turbine Nacelle Industry Volume Share (%), by Country 2024 & 2032
- Figure 59: South America Wind Turbine Nacelle Industry Revenue (Million), by Location of Deployment 2024 & 2032
- Figure 60: South America Wind Turbine Nacelle Industry Volume (Megawatt), by Location of Deployment 2024 & 2032
- Figure 61: South America Wind Turbine Nacelle Industry Revenue Share (%), by Location of Deployment 2024 & 2032
- Figure 62: South America Wind Turbine Nacelle Industry Volume Share (%), by Location of Deployment 2024 & 2032
- Figure 63: South America Wind Turbine Nacelle Industry Revenue (Million), by Turbine Capacity 2024 & 2032
- Figure 64: South America Wind Turbine Nacelle Industry Volume (Megawatt), by Turbine Capacity 2024 & 2032
- Figure 65: South America Wind Turbine Nacelle Industry Revenue Share (%), by Turbine Capacity 2024 & 2032
- Figure 66: South America Wind Turbine Nacelle Industry Volume Share (%), by Turbine Capacity 2024 & 2032
- Figure 67: South America Wind Turbine Nacelle Industry Revenue (Million), by Country 2024 & 2032
- Figure 68: South America Wind Turbine Nacelle Industry Volume (Megawatt), by Country 2024 & 2032
- Figure 69: South America Wind Turbine Nacelle Industry Revenue Share (%), by Country 2024 & 2032
- Figure 70: South America Wind Turbine Nacelle Industry Volume Share (%), by Country 2024 & 2032
- Figure 71: Middle East and Africa Wind Turbine Nacelle Industry Revenue (Million), by Location of Deployment 2024 & 2032
- Figure 72: Middle East and Africa Wind Turbine Nacelle Industry Volume (Megawatt), by Location of Deployment 2024 & 2032
- Figure 73: Middle East and Africa Wind Turbine Nacelle Industry Revenue Share (%), by Location of Deployment 2024 & 2032
- Figure 74: Middle East and Africa Wind Turbine Nacelle Industry Volume Share (%), by Location of Deployment 2024 & 2032
- Figure 75: Middle East and Africa Wind Turbine Nacelle Industry Revenue (Million), by Turbine Capacity 2024 & 2032
- Figure 76: Middle East and Africa Wind Turbine Nacelle Industry Volume (Megawatt), by Turbine Capacity 2024 & 2032
- Figure 77: Middle East and Africa Wind Turbine Nacelle Industry Revenue Share (%), by Turbine Capacity 2024 & 2032
- Figure 78: Middle East and Africa Wind Turbine Nacelle Industry Volume Share (%), by Turbine Capacity 2024 & 2032
- Figure 79: Middle East and Africa Wind Turbine Nacelle Industry Revenue (Million), by Country 2024 & 2032
- Figure 80: Middle East and Africa Wind Turbine Nacelle Industry Volume (Megawatt), by Country 2024 & 2032
- Figure 81: Middle East and Africa Wind Turbine Nacelle Industry Revenue Share (%), by Country 2024 & 2032
- Figure 82: Middle East and Africa Wind Turbine Nacelle Industry Volume Share (%), by Country 2024 & 2032
List of Tables
- Table 1: Global Wind Turbine Nacelle Industry Revenue Million Forecast, by Region 2019 & 2032
- Table 2: Global Wind Turbine Nacelle Industry Volume Megawatt Forecast, by Region 2019 & 2032
- Table 3: Global Wind Turbine Nacelle Industry Revenue Million Forecast, by Location of Deployment 2019 & 2032
- Table 4: Global Wind Turbine Nacelle Industry Volume Megawatt Forecast, by Location of Deployment 2019 & 2032
- Table 5: Global Wind Turbine Nacelle Industry Revenue Million Forecast, by Turbine Capacity 2019 & 2032
- Table 6: Global Wind Turbine Nacelle Industry Volume Megawatt Forecast, by Turbine Capacity 2019 & 2032
- Table 7: Global Wind Turbine Nacelle Industry Revenue Million Forecast, by Region 2019 & 2032
- Table 8: Global Wind Turbine Nacelle Industry Volume Megawatt Forecast, by Region 2019 & 2032
- Table 9: Global Wind Turbine Nacelle Industry Revenue Million Forecast, by Country 2019 & 2032
- Table 10: Global Wind Turbine Nacelle Industry Volume Megawatt Forecast, by Country 2019 & 2032
- Table 11: United States Wind Turbine Nacelle Industry Revenue (Million) Forecast, by Application 2019 & 2032
- Table 12: United States Wind Turbine Nacelle Industry Volume (Megawatt) Forecast, by Application 2019 & 2032
- Table 13: Canada Wind Turbine Nacelle Industry Revenue (Million) Forecast, by Application 2019 & 2032
- Table 14: Canada Wind Turbine Nacelle Industry Volume (Megawatt) Forecast, by Application 2019 & 2032
- Table 15: Mexico Wind Turbine Nacelle Industry Revenue (Million) Forecast, by Application 2019 & 2032
- Table 16: Mexico Wind Turbine Nacelle Industry Volume (Megawatt) Forecast, by Application 2019 & 2032
- Table 17: Global Wind Turbine Nacelle Industry Revenue Million Forecast, by Country 2019 & 2032
- Table 18: Global Wind Turbine Nacelle Industry Volume Megawatt Forecast, by Country 2019 & 2032
- Table 19: Germany Wind Turbine Nacelle Industry Revenue (Million) Forecast, by Application 2019 & 2032
- Table 20: Germany Wind Turbine Nacelle Industry Volume (Megawatt) Forecast, by Application 2019 & 2032
- Table 21: United Kingdom Wind Turbine Nacelle Industry Revenue (Million) Forecast, by Application 2019 & 2032
- Table 22: United Kingdom Wind Turbine Nacelle Industry Volume (Megawatt) Forecast, by Application 2019 & 2032
- Table 23: France Wind Turbine Nacelle Industry Revenue (Million) Forecast, by Application 2019 & 2032
- Table 24: France Wind Turbine Nacelle Industry Volume (Megawatt) Forecast, by Application 2019 & 2032
- Table 25: Spain Wind Turbine Nacelle Industry Revenue (Million) Forecast, by Application 2019 & 2032
- Table 26: Spain Wind Turbine Nacelle Industry Volume (Megawatt) Forecast, by Application 2019 & 2032
- Table 27: Italy Wind Turbine Nacelle Industry Revenue (Million) Forecast, by Application 2019 & 2032
- Table 28: Italy Wind Turbine Nacelle Industry Volume (Megawatt) Forecast, by Application 2019 & 2032
- Table 29: Spain Wind Turbine Nacelle Industry Revenue (Million) Forecast, by Application 2019 & 2032
- Table 30: Spain Wind Turbine Nacelle Industry Volume (Megawatt) Forecast, by Application 2019 & 2032
- Table 31: Belgium Wind Turbine Nacelle Industry Revenue (Million) Forecast, by Application 2019 & 2032
- Table 32: Belgium Wind Turbine Nacelle Industry Volume (Megawatt) Forecast, by Application 2019 & 2032
- Table 33: Netherland Wind Turbine Nacelle Industry Revenue (Million) Forecast, by Application 2019 & 2032
- Table 34: Netherland Wind Turbine Nacelle Industry Volume (Megawatt) Forecast, by Application 2019 & 2032
- Table 35: Nordics Wind Turbine Nacelle Industry Revenue (Million) Forecast, by Application 2019 & 2032
- Table 36: Nordics Wind Turbine Nacelle Industry Volume (Megawatt) Forecast, by Application 2019 & 2032
- Table 37: Rest of Europe Wind Turbine Nacelle Industry Revenue (Million) Forecast, by Application 2019 & 2032
- Table 38: Rest of Europe Wind Turbine Nacelle Industry Volume (Megawatt) Forecast, by Application 2019 & 2032
- Table 39: Global Wind Turbine Nacelle Industry Revenue Million Forecast, by Country 2019 & 2032
- Table 40: Global Wind Turbine Nacelle Industry Volume Megawatt Forecast, by Country 2019 & 2032
- Table 41: China Wind Turbine Nacelle Industry Revenue (Million) Forecast, by Application 2019 & 2032
- Table 42: China Wind Turbine Nacelle Industry Volume (Megawatt) Forecast, by Application 2019 & 2032
- Table 43: Japan Wind Turbine Nacelle Industry Revenue (Million) Forecast, by Application 2019 & 2032
- Table 44: Japan Wind Turbine Nacelle Industry Volume (Megawatt) Forecast, by Application 2019 & 2032
- Table 45: India Wind Turbine Nacelle Industry Revenue (Million) Forecast, by Application 2019 & 2032
- Table 46: India Wind Turbine Nacelle Industry Volume (Megawatt) Forecast, by Application 2019 & 2032
- Table 47: South Korea Wind Turbine Nacelle Industry Revenue (Million) Forecast, by Application 2019 & 2032
- Table 48: South Korea Wind Turbine Nacelle Industry Volume (Megawatt) Forecast, by Application 2019 & 2032
- Table 49: Southeast Asia Wind Turbine Nacelle Industry Revenue (Million) Forecast, by Application 2019 & 2032
- Table 50: Southeast Asia Wind Turbine Nacelle Industry Volume (Megawatt) Forecast, by Application 2019 & 2032
- Table 51: Australia Wind Turbine Nacelle Industry Revenue (Million) Forecast, by Application 2019 & 2032
- Table 52: Australia Wind Turbine Nacelle Industry Volume (Megawatt) Forecast, by Application 2019 & 2032
- Table 53: Indonesia Wind Turbine Nacelle Industry Revenue (Million) Forecast, by Application 2019 & 2032
- Table 54: Indonesia Wind Turbine Nacelle Industry Volume (Megawatt) Forecast, by Application 2019 & 2032
- Table 55: Phillipes Wind Turbine Nacelle Industry Revenue (Million) Forecast, by Application 2019 & 2032
- Table 56: Phillipes Wind Turbine Nacelle Industry Volume (Megawatt) Forecast, by Application 2019 & 2032
- Table 57: Singapore Wind Turbine Nacelle Industry Revenue (Million) Forecast, by Application 2019 & 2032
- Table 58: Singapore Wind Turbine Nacelle Industry Volume (Megawatt) Forecast, by Application 2019 & 2032
- Table 59: Thailandc Wind Turbine Nacelle Industry Revenue (Million) Forecast, by Application 2019 & 2032
- Table 60: Thailandc Wind Turbine Nacelle Industry Volume (Megawatt) Forecast, by Application 2019 & 2032
- Table 61: Rest of Asia Pacific Wind Turbine Nacelle Industry Revenue (Million) Forecast, by Application 2019 & 2032
- Table 62: Rest of Asia Pacific Wind Turbine Nacelle Industry Volume (Megawatt) Forecast, by Application 2019 & 2032
- Table 63: Global Wind Turbine Nacelle Industry Revenue Million Forecast, by Country 2019 & 2032
- Table 64: Global Wind Turbine Nacelle Industry Volume Megawatt Forecast, by Country 2019 & 2032
- Table 65: Brazil Wind Turbine Nacelle Industry Revenue (Million) Forecast, by Application 2019 & 2032
- Table 66: Brazil Wind Turbine Nacelle Industry Volume (Megawatt) Forecast, by Application 2019 & 2032
- Table 67: Argentina Wind Turbine Nacelle Industry Revenue (Million) Forecast, by Application 2019 & 2032
- Table 68: Argentina Wind Turbine Nacelle Industry Volume (Megawatt) Forecast, by Application 2019 & 2032
- Table 69: Peru Wind Turbine Nacelle Industry Revenue (Million) Forecast, by Application 2019 & 2032
- Table 70: Peru Wind Turbine Nacelle Industry Volume (Megawatt) Forecast, by Application 2019 & 2032
- Table 71: Chile Wind Turbine Nacelle Industry Revenue (Million) Forecast, by Application 2019 & 2032
- Table 72: Chile Wind Turbine Nacelle Industry Volume (Megawatt) Forecast, by Application 2019 & 2032
- Table 73: Colombia Wind Turbine Nacelle Industry Revenue (Million) Forecast, by Application 2019 & 2032
- Table 74: Colombia Wind Turbine Nacelle Industry Volume (Megawatt) Forecast, by Application 2019 & 2032
- Table 75: Ecuador Wind Turbine Nacelle Industry Revenue (Million) Forecast, by Application 2019 & 2032
- Table 76: Ecuador Wind Turbine Nacelle Industry Volume (Megawatt) Forecast, by Application 2019 & 2032
- Table 77: Venezuela Wind Turbine Nacelle Industry Revenue (Million) Forecast, by Application 2019 & 2032
- Table 78: Venezuela Wind Turbine Nacelle Industry Volume (Megawatt) Forecast, by Application 2019 & 2032
- Table 79: Rest of South America Wind Turbine Nacelle Industry Revenue (Million) Forecast, by Application 2019 & 2032
- Table 80: Rest of South America Wind Turbine Nacelle Industry Volume (Megawatt) Forecast, by Application 2019 & 2032
- Table 81: Global Wind Turbine Nacelle Industry Revenue Million Forecast, by Country 2019 & 2032
- Table 82: Global Wind Turbine Nacelle Industry Volume Megawatt Forecast, by Country 2019 & 2032
- Table 83: United Arab Emirates Wind Turbine Nacelle Industry Revenue (Million) Forecast, by Application 2019 & 2032
- Table 84: United Arab Emirates Wind Turbine Nacelle Industry Volume (Megawatt) Forecast, by Application 2019 & 2032
- Table 85: Saudi Arabia Wind Turbine Nacelle Industry Revenue (Million) Forecast, by Application 2019 & 2032
- Table 86: Saudi Arabia Wind Turbine Nacelle Industry Volume (Megawatt) Forecast, by Application 2019 & 2032
- Table 87: South Africa Wind Turbine Nacelle Industry Revenue (Million) Forecast, by Application 2019 & 2032
- Table 88: South Africa Wind Turbine Nacelle Industry Volume (Megawatt) Forecast, by Application 2019 & 2032
- Table 89: Rest of Middle East and Africa Wind Turbine Nacelle Industry Revenue (Million) Forecast, by Application 2019 & 2032
- Table 90: Rest of Middle East and Africa Wind Turbine Nacelle Industry Volume (Megawatt) Forecast, by Application 2019 & 2032
- Table 91: Global Wind Turbine Nacelle Industry Revenue Million Forecast, by Location of Deployment 2019 & 2032
- Table 92: Global Wind Turbine Nacelle Industry Volume Megawatt Forecast, by Location of Deployment 2019 & 2032
- Table 93: Global Wind Turbine Nacelle Industry Revenue Million Forecast, by Turbine Capacity 2019 & 2032
- Table 94: Global Wind Turbine Nacelle Industry Volume Megawatt Forecast, by Turbine Capacity 2019 & 2032
- Table 95: Global Wind Turbine Nacelle Industry Revenue Million Forecast, by Country 2019 & 2032
- Table 96: Global Wind Turbine Nacelle Industry Volume Megawatt Forecast, by Country 2019 & 2032
- Table 97: Global Wind Turbine Nacelle Industry Revenue Million Forecast, by Location of Deployment 2019 & 2032
- Table 98: Global Wind Turbine Nacelle Industry Volume Megawatt Forecast, by Location of Deployment 2019 & 2032
- Table 99: Global Wind Turbine Nacelle Industry Revenue Million Forecast, by Turbine Capacity 2019 & 2032
- Table 100: Global Wind Turbine Nacelle Industry Volume Megawatt Forecast, by Turbine Capacity 2019 & 2032
- Table 101: Global Wind Turbine Nacelle Industry Revenue Million Forecast, by Country 2019 & 2032
- Table 102: Global Wind Turbine Nacelle Industry Volume Megawatt Forecast, by Country 2019 & 2032
- Table 103: Global Wind Turbine Nacelle Industry Revenue Million Forecast, by Location of Deployment 2019 & 2032
- Table 104: Global Wind Turbine Nacelle Industry Volume Megawatt Forecast, by Location of Deployment 2019 & 2032
- Table 105: Global Wind Turbine Nacelle Industry Revenue Million Forecast, by Turbine Capacity 2019 & 2032
- Table 106: Global Wind Turbine Nacelle Industry Volume Megawatt Forecast, by Turbine Capacity 2019 & 2032
- Table 107: Global Wind Turbine Nacelle Industry Revenue Million Forecast, by Country 2019 & 2032
- Table 108: Global Wind Turbine Nacelle Industry Volume Megawatt Forecast, by Country 2019 & 2032
- Table 109: Global Wind Turbine Nacelle Industry Revenue Million Forecast, by Location of Deployment 2019 & 2032
- Table 110: Global Wind Turbine Nacelle Industry Volume Megawatt Forecast, by Location of Deployment 2019 & 2032
- Table 111: Global Wind Turbine Nacelle Industry Revenue Million Forecast, by Turbine Capacity 2019 & 2032
- Table 112: Global Wind Turbine Nacelle Industry Volume Megawatt Forecast, by Turbine Capacity 2019 & 2032
- Table 113: Global Wind Turbine Nacelle Industry Revenue Million Forecast, by Country 2019 & 2032
- Table 114: Global Wind Turbine Nacelle Industry Volume Megawatt Forecast, by Country 2019 & 2032
- Table 115: Global Wind Turbine Nacelle Industry Revenue Million Forecast, by Location of Deployment 2019 & 2032
- Table 116: Global Wind Turbine Nacelle Industry Volume Megawatt Forecast, by Location of Deployment 2019 & 2032
- Table 117: Global Wind Turbine Nacelle Industry Revenue Million Forecast, by Turbine Capacity 2019 & 2032
- Table 118: Global Wind Turbine Nacelle Industry Volume Megawatt Forecast, by Turbine Capacity 2019 & 2032
- Table 119: Global Wind Turbine Nacelle Industry Revenue Million Forecast, by Country 2019 & 2032
- Table 120: Global Wind Turbine Nacelle Industry Volume Megawatt Forecast, by Country 2019 & 2032
Frequently Asked Questions
1. What is the projected Compound Annual Growth Rate (CAGR) of the Wind Turbine Nacelle Industry?
The projected CAGR is approximately > 6.10%.
2. Which companies are prominent players in the Wind Turbine Nacelle Industry?
Key companies in the market include Molded Fiber Glass Companies, Siemens Gamesa Renewable Energy S A, BFG International, Suzlon Energy Limited, Hexcel Corporation, General Electric Company, Nordex SE, ENERCON GmbH.
3. What are the main segments of the Wind Turbine Nacelle Industry?
The market segments include Location of Deployment, Turbine Capacity.
4. Can you provide details about the market size?
The market size is estimated to be USD XX Million as of 2022.
5. What are some drivers contributing to market growth?
4.; Increasing Amount of Waste Generation. Growing Concern for Waste Management to Meet the Needs for Sustainable Urban Living4.; Increasing Focus on Non-fossil Fuel Sources of Energy.
6. What are the notable trends driving market growth?
Onshore Segment is Expected to Dominate the Market.
7. Are there any restraints impacting market growth?
4.; Expensive Nature of Incinerators.
8. Can you provide examples of recent developments in the market?
In November 2021, Vestas, the wind turbine manufacturer, presented the first-ever modular nacelle design, which featured customization allowance. The product is claimed to optimize market time, ease the various processes associated with logistics, operation, construction, and maintenance. The manufacturer is also of the opinion that the upcoming product i.e., the modularized nacelle units, can be transported via tunnels, bridge heights, and rail systems, with significantly less requirement for specialized handling.
9. What pricing options are available for accessing the report?
Pricing options include single-user, multi-user, and enterprise licenses priced at USD 4750, USD 5250, and USD 8750 respectively.
10. Is the market size provided in terms of value or volume?
The market size is provided in terms of value, measured in Million and volume, measured in Megawatt.
11. Are there any specific market keywords associated with the report?
Yes, the market keyword associated with the report is "Wind Turbine Nacelle Industry," which aids in identifying and referencing the specific market segment covered.
12. How do I determine which pricing option suits my needs best?
The pricing options vary based on user requirements and access needs. Individual users may opt for single-user licenses, while businesses requiring broader access may choose multi-user or enterprise licenses for cost-effective access to the report.
13. Are there any additional resources or data provided in the Wind Turbine Nacelle Industry report?
While the report offers comprehensive insights, it's advisable to review the specific contents or supplementary materials provided to ascertain if additional resources or data are available.
14. How can I stay updated on further developments or reports in the Wind Turbine Nacelle Industry?
To stay informed about further developments, trends, and reports in the Wind Turbine Nacelle Industry, consider subscribing to industry newsletters, following relevant companies and organizations, or regularly checking reputable industry news sources and publications.
Methodology
Step 1 - Identification of Relevant Samples Size from Population Database


Step 2 - Approaches for Defining Global Market Size (Value, Volume* & Price*)

Note*: In applicable scenarios
Step 3 - Data Sources
Primary Research
- Web Analytics
- Survey Reports
- Research Institute
- Latest Research Reports
- Opinion Leaders
Secondary Research
- Annual Reports
- White Paper
- Latest Press Release
- Industry Association
- Paid Database
- Investor Presentations

Step 4 - Data Triangulation
Involves using different sources of information in order to increase the validity of a study
These sources are likely to be stakeholders in a program - participants, other researchers, program staff, other community members, and so on.
Then we put all data in single framework & apply various statistical tools to find out the dynamic on the market.
During the analysis stage, feedback from the stakeholder groups would be compared to determine areas of agreement as well as areas of divergence
