

Key Insights
The global Agarose Resin Market is poised for significant expansion, projected to grow from a base market size of approximately $680 million in 2025 at a robust Compound Annual Growth Rate (CAGR) of 8.91% through 2033. This growth is propelled by escalating demand across critical applications, primarily protein purification and antibody purification. The increasing prevalence of biopharmaceutical development, fueled by advancements in biotechnology and a growing pipeline of biologics, directly translates to a heightened need for high-purity separation and purification technologies like agarose resins. Furthermore, the expanding research landscape, particularly in academic institutions and contract research organizations (CROs), for drug discovery and development contributes substantially to market expansion. The market is segmented by concentration, with resins in the 2% to 4% and 4% to 6% ranges expected to witness considerable uptake due to their versatility in various purification processes. The pharmaceutical and biopharmaceutical companies segment is anticipated to be the largest end-user, underscoring the critical role of agarose resins in the production of therapeutic proteins and antibodies.
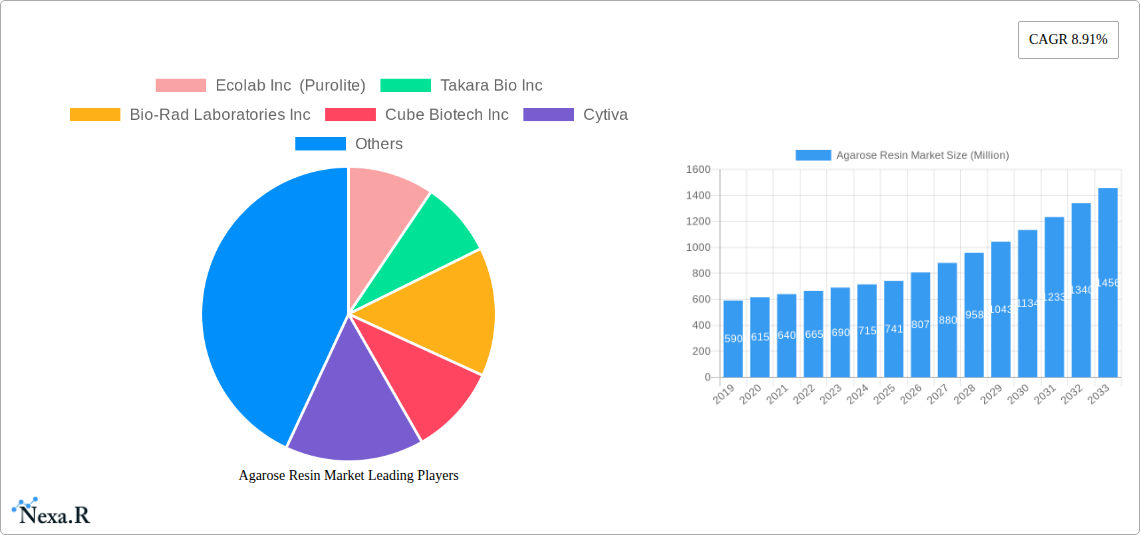
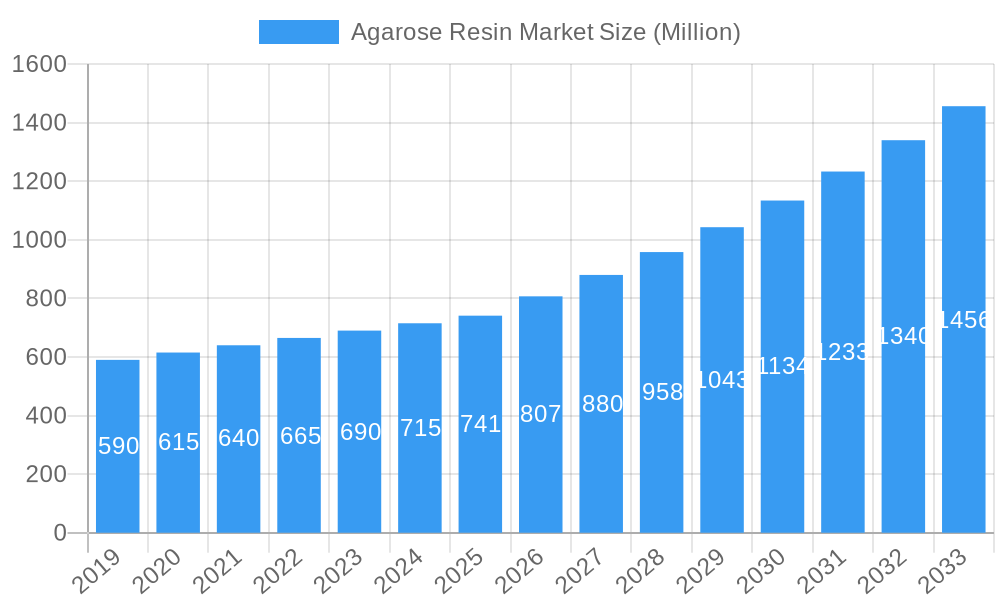
Agarose Resin Market Market Size (In Million)
Several key drivers are shaping the trajectory of the Agarose Resin Market. Increasing investments in biopharmaceutical research and development activities globally, coupled with a rising demand for novel therapeutics, are primary growth catalysts. Advancements in chromatography techniques and the development of specialized agarose resins with enhanced binding capacities and selectivity are also contributing to market growth. The growing emphasis on personalized medicine and the development of complex biologics further necessitate efficient and scalable purification methods. However, certain restraints, such as the high cost associated with advanced agarose resins and the availability of alternative purification technologies, may temper the market's growth to some extent. Despite these challenges, the market is characterized by ongoing innovation, with companies focusing on developing cost-effective and high-performance agarose solutions to meet the evolving needs of the life sciences industry. The Asia Pacific region, led by China and India, is expected to emerge as a significant growth engine due to increasing biopharmaceutical manufacturing capabilities and supportive government initiatives.
Agarose Resin Market Company Market Share
Unveiling the Global Agarose Resin Market: A Comprehensive Analysis (2019-2033)
This in-depth report provides an exhaustive analysis of the Agarose Resin Market, exploring its intricate dynamics, growth trajectories, and future potential. With a focus on critical segments like protein purification agarose resin, antibody purification agarose resin, and immunoprecipitation agarose resin, this report equips industry professionals with actionable insights. We delve into the nuanced interplay of parent and child markets, highlighting the overarching influence of the broader bioprocessing and chromatography consumables landscape on the specialized agarose resin sector. The study period spans from 2019 to 2033, with a base year of 2025 and a forecast period from 2025 to 2033, offering a robust historical perspective from 2019 to 2024. Gain a competitive edge with our detailed examination of market size in Million units, key players, and emerging trends within this vital industry.
Agarose Resin Market Dynamics & Structure
The global Agarose Resin Market is characterized by a moderately concentrated structure, with key players like Ecolab Inc (Purolite), Takara Bio Inc, Bio-Rad Laboratories Inc, Cytiva, and Thermo Fisher Scientific Inc holding significant market shares. Technological innovation is a primary driver, with continuous advancements in resin chemistry and bead size optimization enhancing purification efficiency and throughput. Regulatory frameworks, particularly those governing biopharmaceutical manufacturing, influence product development and quality standards. Competitive product substitutes, such as synthetic polymer resins, present a moderate challenge, though agarose's biocompatibility and established efficacy in sensitive biological applications maintain its dominance. End-user demographics are increasingly shifting towards large pharmaceutical and biopharmaceutical companies, driving demand for high-volume, high-purity solutions. Mergers and acquisitions (M&A) are a growing trend, with companies seeking to expand their product portfolios and market reach. For instance, the recent acquisition of Repligen Corporation by Ecolab Inc (Purolite) signals consolidation efforts aimed at capturing a larger share of the monoclonal antibody purification resin segment. Innovation barriers include the cost of R&D for novel resin chemistries and the stringent validation processes required in the pharmaceutical industry.
- Market Concentration: Moderately concentrated, with a few dominant players.
- Technological Innovation: Driven by advancements in resin bead size, pore size, and surface chemistry for improved binding capacity and selectivity.
- Regulatory Influence: Stringent quality control and compliance requirements from bodies like the FDA and EMA impact product development.
- Competitive Landscape: Presence of both agarose and synthetic polymer-based resins, with agarose retaining a strong niche.
- End-User Evolution: Increasing reliance on outsourced biomanufacturing and a growing demand for specialized resins.
- M&A Activity: Strategic acquisitions to strengthen market position and product offerings.
Agarose Resin Market Growth Trends & Insights
The Agarose Resin Market is poised for robust growth, driven by the burgeoning biopharmaceutical industry and the increasing complexity of therapeutic molecules. Projections indicate a Compound Annual Growth Rate (CAGR) of approximately 7.5% from 2025 to 2033, with the market size expected to reach USD XXX Million units by 2033. This expansion is fueled by the escalating demand for protein purification resins and antibody purification resins, essential components in the development and manufacturing of biologics, vaccines, and gene therapies. The adoption rates for high-performance agarose resins are accelerating as researchers and manufacturers seek to improve downstream processing efficiency, reduce manufacturing costs, and ensure the highest purity of therapeutic products. Technological disruptions, such as the development of novel agarose matrices with enhanced binding capacities and selectivity, are significantly impacting market dynamics. Consumer behavior shifts are evident, with end-users increasingly prioritizing resins that offer improved scalability, reproducible results, and regulatory compliance. The growing prevalence of chronic diseases and the continuous pipeline of new biologic drugs are significant tailwinds for the agarose bead chromatography sector. Furthermore, the expanding applications in diagnostics and personalized medicine are creating new avenues for market penetration. The focus on sustainability within the biopharmaceutical industry also encourages the development of more environmentally friendly purification processes, which can be facilitated by optimized agarose resin utilization. The market penetration of specialized agarose resins is expected to rise as their unique benefits in purifying sensitive biomolecules become more widely recognized and adopted across various research and industrial applications. The increasing investment in biopharmaceutical R&D globally is a direct catalyst for sustained growth in the chromatography resins market, with agarose playing a pivotal role.
Dominant Regions, Countries, or Segments in Agarose Resin Market
The North America region is currently the dominant force in the Agarose Resin Market, propelled by its advanced pharmaceutical and biotechnology infrastructure, significant R&D investments, and a strong presence of leading biopharmaceutical companies. Within this region, the United States leads the market, driven by substantial government funding for life sciences research and a well-established ecosystem for drug discovery and development. The Pharmaceutical and Biopharmaceutical Companies segment constitutes the largest end-user base, accounting for an estimated 65% of the market share in 2025. This dominance is attributed to the extensive use of agarose resins in the large-scale manufacturing of monoclonal antibodies, recombinant proteins, and other biologics.
Key Drivers for North American Dominance:
- High R&D Expenditure: Significant investments in biopharmaceutical research and development foster innovation and demand for advanced purification tools.
- Presence of Major Biopharma Players: Home to a substantial number of global pharmaceutical and biotechnology giants.
- Favorable Regulatory Environment: A streamlined and supportive regulatory framework for drug approval and manufacturing processes.
- Technological Advancements: Early adoption and development of cutting-edge chromatography technologies.
- Strong Academic Research: Robust academic institutions contributing to fundamental research and the training of skilled professionals.
In terms of product segments, Antibody Purification is a leading application, holding a substantial market share due to the exponential growth in the development and production of antibody-based therapeutics. The demand for high-resolution purification to ensure the safety and efficacy of these complex molecules directly fuels the need for specialized agarose resins. The 4% to 6% concentration segment of agarose resins is also experiencing significant growth, offering an optimal balance between binding capacity and flow rate for a wide range of protein and antibody purification applications. The increasing complexity of biopharmaceuticals and the need for highly specific purification methods are driving the demand for resins with tailored pore sizes and binding characteristics.
Agarose Resin Market Product Landscape
The Agarose Resin Market product landscape is defined by a continuous stream of innovations focused on enhancing purification performance. Manufacturers are developing agarose beads with precisely controlled particle sizes and pore structures, leading to improved binding capacities, higher resolution, and faster flow rates. Key product categories include affinity chromatography resins, ion-exchange resins, and hydrophobic interaction chromatography resins, all utilizing agarose as a base matrix. Unique selling propositions often revolve around specialized ligand chemistries for targeted biomolecule capture and improved robustness for large-scale bioprocessing. Technological advancements are enabling the creation of resins with superior chemical and mechanical stability, crucial for repeated use in manufacturing environments.
Key Drivers, Barriers & Challenges in Agarose Resin Market
Key Drivers:
- Growing Biopharmaceutical Industry: The expanding pipeline of biologic drugs and vaccines directly drives demand for purification media.
- Technological Advancements: Development of higher-performance resins with improved binding capacity and selectivity.
- Increasing R&D Investment: Global investment in life sciences research fuels the need for advanced chromatography solutions.
- Demand for High Purity: Stringent regulatory requirements necessitate highly effective purification processes.
- Rise of Personalized Medicine: The need for specialized purification of smaller batches of complex biomolecules.
Key Barriers & Challenges:
- High Cost of Production: The manufacturing of high-quality agarose resins can be expensive.
- Competition from Synthetic Resins: While agarose has unique advantages, synthetic alternatives offer cost-competitiveness in some applications.
- Regulatory Hurdles: Long and complex validation processes for new resins in pharmaceutical manufacturing.
- Supply Chain Disruptions: Potential for disruptions in the supply of raw materials or finished products, impacting availability.
- Skilled Workforce Shortage: A need for highly trained personnel to operate and maintain complex purification systems.
Emerging Opportunities in Agarose Resin Market
Emerging opportunities in the Agarose Resin Market lie in the development of novel affinity ligands for the purification of emerging therapeutic modalities like gene therapy vectors and cell-based therapies. Untapped markets in developing economies with growing biopharmaceutical sectors present significant potential for market expansion. Innovative applications in diagnostics, food safety testing, and environmental monitoring, beyond traditional biopharma, offer avenues for diversification. Evolving consumer preferences for sustainable and environmentally friendly purification processes are also creating opportunities for the development of greener agarose resin production and utilization methods. The increasing focus on single-use chromatography systems also presents an opportunity for specialized disposable agarose resin cartridges.
Growth Accelerators in the Agarose Resin Market Industry
Long-term growth in the Agarose Resin Market is being accelerated by groundbreaking technological breakthroughs in resin synthesis and functionalization, leading to unprecedented purification efficiencies. Strategic partnerships between resin manufacturers and biopharmaceutical companies are fostering co-development of tailor-made purification solutions, driving innovation and market penetration. Market expansion strategies, including entering emerging geographical markets and broadening application areas beyond traditional drug discovery, are also key growth accelerators. The increasing outsourcing of biopharmaceutical manufacturing to Contract Development and Manufacturing Organizations (CDMOs) further amplifies the demand for high-performance chromatography resins.
Key Players Shaping the Agarose Resin Market Market
- Ecolab Inc (Purolite)
- Takara Bio Inc
- Bio-Rad Laboratories Inc
- Cube Biotech Inc
- Cytiva
- Agarose Beads Technologies
- Merck KGaA
- Thermo Fisher Scientific Inc
- Bio-Works
- Tosoh Bioscience LLC
- Repligen Corporation
- Kaneka Corporation
Notable Milestones in Agarose Resin Market Sector
- April 2024: Agarose Beads Technologies received halal certification for some of its agarose beads used in the biopharmaceutical and bioprocessing industries, ensuring a strong commitment to high quality and customer satisfaction.
- February 2024: Purolite (Ecolab Inc) and Repligen Corporation introduced a new 70-micrometer agarose-based affinity resin, Praesto CH1, developed to purify monoclonal antibodies, including bispecifics and recombinant antibody fragments.
In-Depth Agarose Resin Market Market Outlook
The future outlook for the Agarose Resin Market is exceptionally promising, driven by the sustained growth in the biopharmaceutical sector and continuous advancements in purification technologies. The market will likely witness a surge in demand for highly specific and efficient agarose resins capable of handling complex biomolecules and novel therapeutic modalities. Strategic collaborations and investments in R&D will be pivotal in unlocking new applications and enhancing product performance. Emerging markets and evolving patient needs for advanced treatments will further fuel market expansion. The industry's commitment to quality, sustainability, and innovation will define its trajectory, ensuring the continued relevance and growth of agarose resins in critical biological purification processes.
Agarose Resin Market Segmentation
-
1. Concentration
- 1.1. 2% to 4%
- 1.2. 4% to 6%
- 1.3. 6% to 8%
- 1.4. More than 8%
-
2. Application
- 2.1. Protein Purification
- 2.2. Antibody Purification
- 2.3. Immunoprecipitation
- 2.4. Others
-
3. End User
- 3.1. Pharmaceutical and Biopharmaceutical Companies
- 3.2. Research Laboratories
- 3.3. Other End Users
Agarose Resin Market Segmentation By Geography
-
1. North America
- 1.1. United States
- 1.2. Canada
- 1.3. Mexico
-
2. Europe
- 2.1. Germany
- 2.2. United Kingdom
- 2.3. France
- 2.4. Italy
- 2.5. Spain
- 2.6. Rest of Europe
-
3. Asia Pacific
- 3.1. China
- 3.2. Japan
- 3.3. India
- 3.4. Australia
- 3.5. South Korea
- 3.6. Rest of Asia Pacific
-
4. Middle East and Africa
- 4.1. GCC
- 4.2. South Africa
- 4.3. Rest of Middle East and Africa
-
5. South America
- 5.1. Brazil
- 5.2. Argentina
- 5.3. Rest of South America
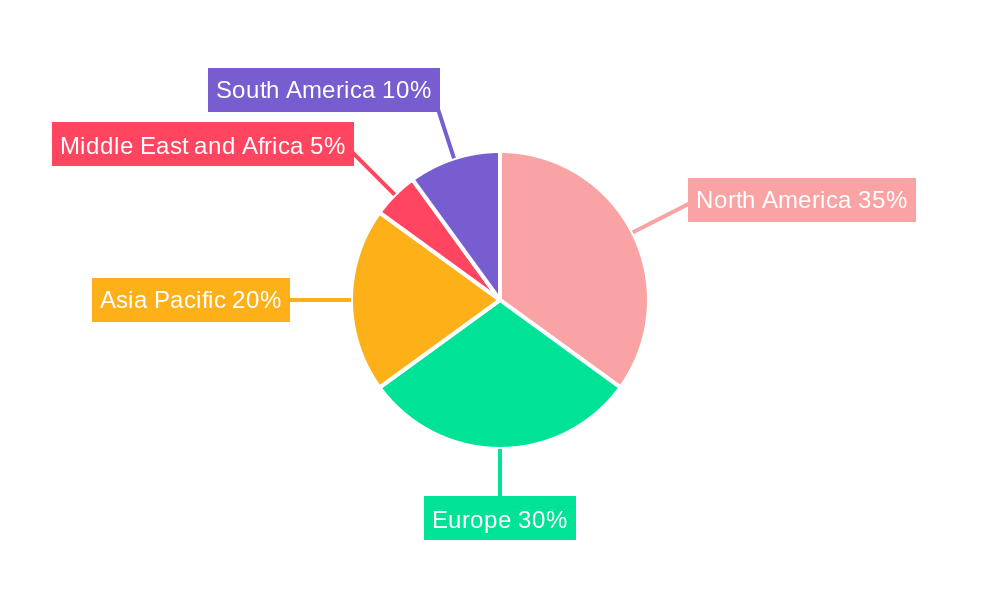
Agarose Resin Market Regional Market Share
Geographic Coverage of Agarose Resin Market
Agarose Resin Market REPORT HIGHLIGHTS
| Aspects | Details |
|---|---|
| Study Period | 2020-2034 |
| Base Year | 2025 |
| Estimated Year | 2026 |
| Forecast Period | 2026-2034 |
| Historical Period | 2020-2025 |
| Growth Rate | CAGR of 8.91% from 2020-2034 |
| Segmentation |
|
Table of Contents
- 1. Introduction
- 1.1. Research Scope
- 1.2. Market Segmentation
- 1.3. Research Objective
- 1.4. Definitions and Assumptions
- 2. Executive Summary
- 2.1. Market Snapshot
- 3. Market Dynamics
- 3.1. Market Drivers
- 3.2. Market Restrains
- 3.3. Market Trends
- 3.4. Market Opportunities
- 4. Market Factor Analysis
- 4.1. Porters Five Forces
- 4.1.1. Bargaining Power of Suppliers
- 4.1.2. Bargaining Power of Buyers
- 4.1.3. Threat of New Entrants
- 4.1.4. Threat of Substitutes
- 4.1.5. Competitive Rivalry
- 4.2. PESTEL analysis
- 4.3. BCG Analysis
- 4.3.1. Stars (High Growth, High Market Share)
- 4.3.2. Cash Cows (Low Growth, High Market Share)
- 4.3.3. Question Mark (High Growth, Low Market Share)
- 4.3.4. Dogs (Low Growth, Low Market Share)
- 4.4. Ansoff Matrix Analysis
- 4.5. Supply Chain Analysis
- 4.6. Regulatory Landscape
- 4.7. Current Market Potential and Opportunity Assessment (TAM–SAM–SOM Framework)
- 4.8. NRP Analyst Note
- 4.1. Porters Five Forces
- 5. Market Analysis, Insights and Forecast 2021-2033
- 5.1. Market Analysis, Insights and Forecast - by Concentration
- 5.1.1. 2% to 4%
- 5.1.2. 4% to 6%
- 5.1.3. 6% to 8%
- 5.1.4. More than 8%
- 5.2. Market Analysis, Insights and Forecast - by Application
- 5.2.1. Protein Purification
- 5.2.2. Antibody Purification
- 5.2.3. Immunoprecipitation
- 5.2.4. Others
- 5.3. Market Analysis, Insights and Forecast - by End User
- 5.3.1. Pharmaceutical and Biopharmaceutical Companies
- 5.3.2. Research Laboratories
- 5.3.3. Other End Users
- 5.4. Market Analysis, Insights and Forecast - by Region
- 5.4.1. North America
- 5.4.2. Europe
- 5.4.3. Asia Pacific
- 5.4.4. Middle East and Africa
- 5.4.5. South America
- 5.1. Market Analysis, Insights and Forecast - by Concentration
- 6. Global Agarose Resin Market Analysis, Insights and Forecast, 2021-2033
- 6.1. Market Analysis, Insights and Forecast - by Concentration
- 6.1.1. 2% to 4%
- 6.1.2. 4% to 6%
- 6.1.3. 6% to 8%
- 6.1.4. More than 8%
- 6.2. Market Analysis, Insights and Forecast - by Application
- 6.2.1. Protein Purification
- 6.2.2. Antibody Purification
- 6.2.3. Immunoprecipitation
- 6.2.4. Others
- 6.3. Market Analysis, Insights and Forecast - by End User
- 6.3.1. Pharmaceutical and Biopharmaceutical Companies
- 6.3.2. Research Laboratories
- 6.3.3. Other End Users
- 6.1. Market Analysis, Insights and Forecast - by Concentration
- 7. North America Agarose Resin Market Analysis, Insights and Forecast, 2020-2032
- 7.1. Market Analysis, Insights and Forecast - by Concentration
- 7.1.1. 2% to 4%
- 7.1.2. 4% to 6%
- 7.1.3. 6% to 8%
- 7.1.4. More than 8%
- 7.2. Market Analysis, Insights and Forecast - by Application
- 7.2.1. Protein Purification
- 7.2.2. Antibody Purification
- 7.2.3. Immunoprecipitation
- 7.2.4. Others
- 7.3. Market Analysis, Insights and Forecast - by End User
- 7.3.1. Pharmaceutical and Biopharmaceutical Companies
- 7.3.2. Research Laboratories
- 7.3.3. Other End Users
- 7.1. Market Analysis, Insights and Forecast - by Concentration
- 8. Europe Agarose Resin Market Analysis, Insights and Forecast, 2020-2032
- 8.1. Market Analysis, Insights and Forecast - by Concentration
- 8.1.1. 2% to 4%
- 8.1.2. 4% to 6%
- 8.1.3. 6% to 8%
- 8.1.4. More than 8%
- 8.2. Market Analysis, Insights and Forecast - by Application
- 8.2.1. Protein Purification
- 8.2.2. Antibody Purification
- 8.2.3. Immunoprecipitation
- 8.2.4. Others
- 8.3. Market Analysis, Insights and Forecast - by End User
- 8.3.1. Pharmaceutical and Biopharmaceutical Companies
- 8.3.2. Research Laboratories
- 8.3.3. Other End Users
- 8.1. Market Analysis, Insights and Forecast - by Concentration
- 9. Asia Pacific Agarose Resin Market Analysis, Insights and Forecast, 2020-2032
- 9.1. Market Analysis, Insights and Forecast - by Concentration
- 9.1.1. 2% to 4%
- 9.1.2. 4% to 6%
- 9.1.3. 6% to 8%
- 9.1.4. More than 8%
- 9.2. Market Analysis, Insights and Forecast - by Application
- 9.2.1. Protein Purification
- 9.2.2. Antibody Purification
- 9.2.3. Immunoprecipitation
- 9.2.4. Others
- 9.3. Market Analysis, Insights and Forecast - by End User
- 9.3.1. Pharmaceutical and Biopharmaceutical Companies
- 9.3.2. Research Laboratories
- 9.3.3. Other End Users
- 9.1. Market Analysis, Insights and Forecast - by Concentration
- 10. Middle East and Africa Agarose Resin Market Analysis, Insights and Forecast, 2020-2032
- 10.1. Market Analysis, Insights and Forecast - by Concentration
- 10.1.1. 2% to 4%
- 10.1.2. 4% to 6%
- 10.1.3. 6% to 8%
- 10.1.4. More than 8%
- 10.2. Market Analysis, Insights and Forecast - by Application
- 10.2.1. Protein Purification
- 10.2.2. Antibody Purification
- 10.2.3. Immunoprecipitation
- 10.2.4. Others
- 10.3. Market Analysis, Insights and Forecast - by End User
- 10.3.1. Pharmaceutical and Biopharmaceutical Companies
- 10.3.2. Research Laboratories
- 10.3.3. Other End Users
- 10.1. Market Analysis, Insights and Forecast - by Concentration
- 11. South America Agarose Resin Market Analysis, Insights and Forecast, 2020-2032
- 11.1. Market Analysis, Insights and Forecast - by Concentration
- 11.1.1. 2% to 4%
- 11.1.2. 4% to 6%
- 11.1.3. 6% to 8%
- 11.1.4. More than 8%
- 11.2. Market Analysis, Insights and Forecast - by Application
- 11.2.1. Protein Purification
- 11.2.2. Antibody Purification
- 11.2.3. Immunoprecipitation
- 11.2.4. Others
- 11.3. Market Analysis, Insights and Forecast - by End User
- 11.3.1. Pharmaceutical and Biopharmaceutical Companies
- 11.3.2. Research Laboratories
- 11.3.3. Other End Users
- 11.1. Market Analysis, Insights and Forecast - by Concentration
- 12. Competitive Analysis
- 12.1. Company Profiles
- 12.1.1 Ecolab Inc (Purolite)
- 12.1.1.1. Company Overview
- 12.1.1.2. Products
- 12.1.1.3. Company Financials
- 12.1.1.4. SWOT Analysis
- 12.1.2 Takara Bio Inc
- 12.1.2.1. Company Overview
- 12.1.2.2. Products
- 12.1.2.3. Company Financials
- 12.1.2.4. SWOT Analysis
- 12.1.3 Bio-Rad Laboratories Inc
- 12.1.3.1. Company Overview
- 12.1.3.2. Products
- 12.1.3.3. Company Financials
- 12.1.3.4. SWOT Analysis
- 12.1.4 Cube Biotech Inc
- 12.1.4.1. Company Overview
- 12.1.4.2. Products
- 12.1.4.3. Company Financials
- 12.1.4.4. SWOT Analysis
- 12.1.5 Cytiva
- 12.1.5.1. Company Overview
- 12.1.5.2. Products
- 12.1.5.3. Company Financials
- 12.1.5.4. SWOT Analysis
- 12.1.6 Agarose Beads Technologies
- 12.1.6.1. Company Overview
- 12.1.6.2. Products
- 12.1.6.3. Company Financials
- 12.1.6.4. SWOT Analysis
- 12.1.7 Merck KGaA
- 12.1.7.1. Company Overview
- 12.1.7.2. Products
- 12.1.7.3. Company Financials
- 12.1.7.4. SWOT Analysis
- 12.1.8 Thermo Fisher Scientific Inc
- 12.1.8.1. Company Overview
- 12.1.8.2. Products
- 12.1.8.3. Company Financials
- 12.1.8.4. SWOT Analysis
- 12.1.9 Bio-Works
- 12.1.9.1. Company Overview
- 12.1.9.2. Products
- 12.1.9.3. Company Financials
- 12.1.9.4. SWOT Analysis
- 12.1.10 Tosoh Bioscience LLC
- 12.1.10.1. Company Overview
- 12.1.10.2. Products
- 12.1.10.3. Company Financials
- 12.1.10.4. SWOT Analysis
- 12.1.11 Repligen Corporation
- 12.1.11.1. Company Overview
- 12.1.11.2. Products
- 12.1.11.3. Company Financials
- 12.1.11.4. SWOT Analysis
- 12.1.12 Kaneka Corporation*List Not Exhaustive
- 12.1.12.1. Company Overview
- 12.1.12.2. Products
- 12.1.12.3. Company Financials
- 12.1.12.4. SWOT Analysis
- 12.1.1 Ecolab Inc (Purolite)
- 12.2. Market Entropy
- 12.2.1 Company's Key Areas Served
- 12.2.2 Recent Developments
- 12.3. Company Market Share Analysis 2025
- 12.3.1 Top 5 Companies Market Share Analysis
- 12.3.2 Top 3 Companies Market Share Analysis
- 12.4. List of Potential Customers
- 13. Research Methodology
List of Figures
- Figure 1: Global Agarose Resin Market Revenue Breakdown (Million, %) by Region 2025 & 2033
- Figure 2: Global Agarose Resin Market Volume Breakdown (Billion, %) by Region 2025 & 2033
- Figure 3: North America Agarose Resin Market Revenue (Million), by Concentration 2025 & 2033
- Figure 4: North America Agarose Resin Market Volume (Billion), by Concentration 2025 & 2033
- Figure 5: North America Agarose Resin Market Revenue Share (%), by Concentration 2025 & 2033
- Figure 6: North America Agarose Resin Market Volume Share (%), by Concentration 2025 & 2033
- Figure 7: North America Agarose Resin Market Revenue (Million), by Application 2025 & 2033
- Figure 8: North America Agarose Resin Market Volume (Billion), by Application 2025 & 2033
- Figure 9: North America Agarose Resin Market Revenue Share (%), by Application 2025 & 2033
- Figure 10: North America Agarose Resin Market Volume Share (%), by Application 2025 & 2033
- Figure 11: North America Agarose Resin Market Revenue (Million), by End User 2025 & 2033
- Figure 12: North America Agarose Resin Market Volume (Billion), by End User 2025 & 2033
- Figure 13: North America Agarose Resin Market Revenue Share (%), by End User 2025 & 2033
- Figure 14: North America Agarose Resin Market Volume Share (%), by End User 2025 & 2033
- Figure 15: North America Agarose Resin Market Revenue (Million), by Country 2025 & 2033
- Figure 16: North America Agarose Resin Market Volume (Billion), by Country 2025 & 2033
- Figure 17: North America Agarose Resin Market Revenue Share (%), by Country 2025 & 2033
- Figure 18: North America Agarose Resin Market Volume Share (%), by Country 2025 & 2033
- Figure 19: Europe Agarose Resin Market Revenue (Million), by Concentration 2025 & 2033
- Figure 20: Europe Agarose Resin Market Volume (Billion), by Concentration 2025 & 2033
- Figure 21: Europe Agarose Resin Market Revenue Share (%), by Concentration 2025 & 2033
- Figure 22: Europe Agarose Resin Market Volume Share (%), by Concentration 2025 & 2033
- Figure 23: Europe Agarose Resin Market Revenue (Million), by Application 2025 & 2033
- Figure 24: Europe Agarose Resin Market Volume (Billion), by Application 2025 & 2033
- Figure 25: Europe Agarose Resin Market Revenue Share (%), by Application 2025 & 2033
- Figure 26: Europe Agarose Resin Market Volume Share (%), by Application 2025 & 2033
- Figure 27: Europe Agarose Resin Market Revenue (Million), by End User 2025 & 2033
- Figure 28: Europe Agarose Resin Market Volume (Billion), by End User 2025 & 2033
- Figure 29: Europe Agarose Resin Market Revenue Share (%), by End User 2025 & 2033
- Figure 30: Europe Agarose Resin Market Volume Share (%), by End User 2025 & 2033
- Figure 31: Europe Agarose Resin Market Revenue (Million), by Country 2025 & 2033
- Figure 32: Europe Agarose Resin Market Volume (Billion), by Country 2025 & 2033
- Figure 33: Europe Agarose Resin Market Revenue Share (%), by Country 2025 & 2033
- Figure 34: Europe Agarose Resin Market Volume Share (%), by Country 2025 & 2033
- Figure 35: Asia Pacific Agarose Resin Market Revenue (Million), by Concentration 2025 & 2033
- Figure 36: Asia Pacific Agarose Resin Market Volume (Billion), by Concentration 2025 & 2033
- Figure 37: Asia Pacific Agarose Resin Market Revenue Share (%), by Concentration 2025 & 2033
- Figure 38: Asia Pacific Agarose Resin Market Volume Share (%), by Concentration 2025 & 2033
- Figure 39: Asia Pacific Agarose Resin Market Revenue (Million), by Application 2025 & 2033
- Figure 40: Asia Pacific Agarose Resin Market Volume (Billion), by Application 2025 & 2033
- Figure 41: Asia Pacific Agarose Resin Market Revenue Share (%), by Application 2025 & 2033
- Figure 42: Asia Pacific Agarose Resin Market Volume Share (%), by Application 2025 & 2033
- Figure 43: Asia Pacific Agarose Resin Market Revenue (Million), by End User 2025 & 2033
- Figure 44: Asia Pacific Agarose Resin Market Volume (Billion), by End User 2025 & 2033
- Figure 45: Asia Pacific Agarose Resin Market Revenue Share (%), by End User 2025 & 2033
- Figure 46: Asia Pacific Agarose Resin Market Volume Share (%), by End User 2025 & 2033
- Figure 47: Asia Pacific Agarose Resin Market Revenue (Million), by Country 2025 & 2033
- Figure 48: Asia Pacific Agarose Resin Market Volume (Billion), by Country 2025 & 2033
- Figure 49: Asia Pacific Agarose Resin Market Revenue Share (%), by Country 2025 & 2033
- Figure 50: Asia Pacific Agarose Resin Market Volume Share (%), by Country 2025 & 2033
- Figure 51: Middle East and Africa Agarose Resin Market Revenue (Million), by Concentration 2025 & 2033
- Figure 52: Middle East and Africa Agarose Resin Market Volume (Billion), by Concentration 2025 & 2033
- Figure 53: Middle East and Africa Agarose Resin Market Revenue Share (%), by Concentration 2025 & 2033
- Figure 54: Middle East and Africa Agarose Resin Market Volume Share (%), by Concentration 2025 & 2033
- Figure 55: Middle East and Africa Agarose Resin Market Revenue (Million), by Application 2025 & 2033
- Figure 56: Middle East and Africa Agarose Resin Market Volume (Billion), by Application 2025 & 2033
- Figure 57: Middle East and Africa Agarose Resin Market Revenue Share (%), by Application 2025 & 2033
- Figure 58: Middle East and Africa Agarose Resin Market Volume Share (%), by Application 2025 & 2033
- Figure 59: Middle East and Africa Agarose Resin Market Revenue (Million), by End User 2025 & 2033
- Figure 60: Middle East and Africa Agarose Resin Market Volume (Billion), by End User 2025 & 2033
- Figure 61: Middle East and Africa Agarose Resin Market Revenue Share (%), by End User 2025 & 2033
- Figure 62: Middle East and Africa Agarose Resin Market Volume Share (%), by End User 2025 & 2033
- Figure 63: Middle East and Africa Agarose Resin Market Revenue (Million), by Country 2025 & 2033
- Figure 64: Middle East and Africa Agarose Resin Market Volume (Billion), by Country 2025 & 2033
- Figure 65: Middle East and Africa Agarose Resin Market Revenue Share (%), by Country 2025 & 2033
- Figure 66: Middle East and Africa Agarose Resin Market Volume Share (%), by Country 2025 & 2033
- Figure 67: South America Agarose Resin Market Revenue (Million), by Concentration 2025 & 2033
- Figure 68: South America Agarose Resin Market Volume (Billion), by Concentration 2025 & 2033
- Figure 69: South America Agarose Resin Market Revenue Share (%), by Concentration 2025 & 2033
- Figure 70: South America Agarose Resin Market Volume Share (%), by Concentration 2025 & 2033
- Figure 71: South America Agarose Resin Market Revenue (Million), by Application 2025 & 2033
- Figure 72: South America Agarose Resin Market Volume (Billion), by Application 2025 & 2033
- Figure 73: South America Agarose Resin Market Revenue Share (%), by Application 2025 & 2033
- Figure 74: South America Agarose Resin Market Volume Share (%), by Application 2025 & 2033
- Figure 75: South America Agarose Resin Market Revenue (Million), by End User 2025 & 2033
- Figure 76: South America Agarose Resin Market Volume (Billion), by End User 2025 & 2033
- Figure 77: South America Agarose Resin Market Revenue Share (%), by End User 2025 & 2033
- Figure 78: South America Agarose Resin Market Volume Share (%), by End User 2025 & 2033
- Figure 79: South America Agarose Resin Market Revenue (Million), by Country 2025 & 2033
- Figure 80: South America Agarose Resin Market Volume (Billion), by Country 2025 & 2033
- Figure 81: South America Agarose Resin Market Revenue Share (%), by Country 2025 & 2033
- Figure 82: South America Agarose Resin Market Volume Share (%), by Country 2025 & 2033
List of Tables
- Table 1: Global Agarose Resin Market Revenue Million Forecast, by Concentration 2020 & 2033
- Table 2: Global Agarose Resin Market Volume Billion Forecast, by Concentration 2020 & 2033
- Table 3: Global Agarose Resin Market Revenue Million Forecast, by Application 2020 & 2033
- Table 4: Global Agarose Resin Market Volume Billion Forecast, by Application 2020 & 2033
- Table 5: Global Agarose Resin Market Revenue Million Forecast, by End User 2020 & 2033
- Table 6: Global Agarose Resin Market Volume Billion Forecast, by End User 2020 & 2033
- Table 7: Global Agarose Resin Market Revenue Million Forecast, by Region 2020 & 2033
- Table 8: Global Agarose Resin Market Volume Billion Forecast, by Region 2020 & 2033
- Table 9: Global Agarose Resin Market Revenue Million Forecast, by Concentration 2020 & 2033
- Table 10: Global Agarose Resin Market Volume Billion Forecast, by Concentration 2020 & 2033
- Table 11: Global Agarose Resin Market Revenue Million Forecast, by Application 2020 & 2033
- Table 12: Global Agarose Resin Market Volume Billion Forecast, by Application 2020 & 2033
- Table 13: Global Agarose Resin Market Revenue Million Forecast, by End User 2020 & 2033
- Table 14: Global Agarose Resin Market Volume Billion Forecast, by End User 2020 & 2033
- Table 15: Global Agarose Resin Market Revenue Million Forecast, by Country 2020 & 2033
- Table 16: Global Agarose Resin Market Volume Billion Forecast, by Country 2020 & 2033
- Table 17: United States Agarose Resin Market Revenue (Million) Forecast, by Application 2020 & 2033
- Table 18: United States Agarose Resin Market Volume (Billion) Forecast, by Application 2020 & 2033
- Table 19: Canada Agarose Resin Market Revenue (Million) Forecast, by Application 2020 & 2033
- Table 20: Canada Agarose Resin Market Volume (Billion) Forecast, by Application 2020 & 2033
- Table 21: Mexico Agarose Resin Market Revenue (Million) Forecast, by Application 2020 & 2033
- Table 22: Mexico Agarose Resin Market Volume (Billion) Forecast, by Application 2020 & 2033
- Table 23: Global Agarose Resin Market Revenue Million Forecast, by Concentration 2020 & 2033
- Table 24: Global Agarose Resin Market Volume Billion Forecast, by Concentration 2020 & 2033
- Table 25: Global Agarose Resin Market Revenue Million Forecast, by Application 2020 & 2033
- Table 26: Global Agarose Resin Market Volume Billion Forecast, by Application 2020 & 2033
- Table 27: Global Agarose Resin Market Revenue Million Forecast, by End User 2020 & 2033
- Table 28: Global Agarose Resin Market Volume Billion Forecast, by End User 2020 & 2033
- Table 29: Global Agarose Resin Market Revenue Million Forecast, by Country 2020 & 2033
- Table 30: Global Agarose Resin Market Volume Billion Forecast, by Country 2020 & 2033
- Table 31: Germany Agarose Resin Market Revenue (Million) Forecast, by Application 2020 & 2033
- Table 32: Germany Agarose Resin Market Volume (Billion) Forecast, by Application 2020 & 2033
- Table 33: United Kingdom Agarose Resin Market Revenue (Million) Forecast, by Application 2020 & 2033
- Table 34: United Kingdom Agarose Resin Market Volume (Billion) Forecast, by Application 2020 & 2033
- Table 35: France Agarose Resin Market Revenue (Million) Forecast, by Application 2020 & 2033
- Table 36: France Agarose Resin Market Volume (Billion) Forecast, by Application 2020 & 2033
- Table 37: Italy Agarose Resin Market Revenue (Million) Forecast, by Application 2020 & 2033
- Table 38: Italy Agarose Resin Market Volume (Billion) Forecast, by Application 2020 & 2033
- Table 39: Spain Agarose Resin Market Revenue (Million) Forecast, by Application 2020 & 2033
- Table 40: Spain Agarose Resin Market Volume (Billion) Forecast, by Application 2020 & 2033
- Table 41: Rest of Europe Agarose Resin Market Revenue (Million) Forecast, by Application 2020 & 2033
- Table 42: Rest of Europe Agarose Resin Market Volume (Billion) Forecast, by Application 2020 & 2033
- Table 43: Global Agarose Resin Market Revenue Million Forecast, by Concentration 2020 & 2033
- Table 44: Global Agarose Resin Market Volume Billion Forecast, by Concentration 2020 & 2033
- Table 45: Global Agarose Resin Market Revenue Million Forecast, by Application 2020 & 2033
- Table 46: Global Agarose Resin Market Volume Billion Forecast, by Application 2020 & 2033
- Table 47: Global Agarose Resin Market Revenue Million Forecast, by End User 2020 & 2033
- Table 48: Global Agarose Resin Market Volume Billion Forecast, by End User 2020 & 2033
- Table 49: Global Agarose Resin Market Revenue Million Forecast, by Country 2020 & 2033
- Table 50: Global Agarose Resin Market Volume Billion Forecast, by Country 2020 & 2033
- Table 51: China Agarose Resin Market Revenue (Million) Forecast, by Application 2020 & 2033
- Table 52: China Agarose Resin Market Volume (Billion) Forecast, by Application 2020 & 2033
- Table 53: Japan Agarose Resin Market Revenue (Million) Forecast, by Application 2020 & 2033
- Table 54: Japan Agarose Resin Market Volume (Billion) Forecast, by Application 2020 & 2033
- Table 55: India Agarose Resin Market Revenue (Million) Forecast, by Application 2020 & 2033
- Table 56: India Agarose Resin Market Volume (Billion) Forecast, by Application 2020 & 2033
- Table 57: Australia Agarose Resin Market Revenue (Million) Forecast, by Application 2020 & 2033
- Table 58: Australia Agarose Resin Market Volume (Billion) Forecast, by Application 2020 & 2033
- Table 59: South Korea Agarose Resin Market Revenue (Million) Forecast, by Application 2020 & 2033
- Table 60: South Korea Agarose Resin Market Volume (Billion) Forecast, by Application 2020 & 2033
- Table 61: Rest of Asia Pacific Agarose Resin Market Revenue (Million) Forecast, by Application 2020 & 2033
- Table 62: Rest of Asia Pacific Agarose Resin Market Volume (Billion) Forecast, by Application 2020 & 2033
- Table 63: Global Agarose Resin Market Revenue Million Forecast, by Concentration 2020 & 2033
- Table 64: Global Agarose Resin Market Volume Billion Forecast, by Concentration 2020 & 2033
- Table 65: Global Agarose Resin Market Revenue Million Forecast, by Application 2020 & 2033
- Table 66: Global Agarose Resin Market Volume Billion Forecast, by Application 2020 & 2033
- Table 67: Global Agarose Resin Market Revenue Million Forecast, by End User 2020 & 2033
- Table 68: Global Agarose Resin Market Volume Billion Forecast, by End User 2020 & 2033
- Table 69: Global Agarose Resin Market Revenue Million Forecast, by Country 2020 & 2033
- Table 70: Global Agarose Resin Market Volume Billion Forecast, by Country 2020 & 2033
- Table 71: GCC Agarose Resin Market Revenue (Million) Forecast, by Application 2020 & 2033
- Table 72: GCC Agarose Resin Market Volume (Billion) Forecast, by Application 2020 & 2033
- Table 73: South Africa Agarose Resin Market Revenue (Million) Forecast, by Application 2020 & 2033
- Table 74: South Africa Agarose Resin Market Volume (Billion) Forecast, by Application 2020 & 2033
- Table 75: Rest of Middle East and Africa Agarose Resin Market Revenue (Million) Forecast, by Application 2020 & 2033
- Table 76: Rest of Middle East and Africa Agarose Resin Market Volume (Billion) Forecast, by Application 2020 & 2033
- Table 77: Global Agarose Resin Market Revenue Million Forecast, by Concentration 2020 & 2033
- Table 78: Global Agarose Resin Market Volume Billion Forecast, by Concentration 2020 & 2033
- Table 79: Global Agarose Resin Market Revenue Million Forecast, by Application 2020 & 2033
- Table 80: Global Agarose Resin Market Volume Billion Forecast, by Application 2020 & 2033
- Table 81: Global Agarose Resin Market Revenue Million Forecast, by End User 2020 & 2033
- Table 82: Global Agarose Resin Market Volume Billion Forecast, by End User 2020 & 2033
- Table 83: Global Agarose Resin Market Revenue Million Forecast, by Country 2020 & 2033
- Table 84: Global Agarose Resin Market Volume Billion Forecast, by Country 2020 & 2033
- Table 85: Brazil Agarose Resin Market Revenue (Million) Forecast, by Application 2020 & 2033
- Table 86: Brazil Agarose Resin Market Volume (Billion) Forecast, by Application 2020 & 2033
- Table 87: Argentina Agarose Resin Market Revenue (Million) Forecast, by Application 2020 & 2033
- Table 88: Argentina Agarose Resin Market Volume (Billion) Forecast, by Application 2020 & 2033
- Table 89: Rest of South America Agarose Resin Market Revenue (Million) Forecast, by Application 2020 & 2033
- Table 90: Rest of South America Agarose Resin Market Volume (Billion) Forecast, by Application 2020 & 2033
Frequently Asked Questions
1. What is the projected Compound Annual Growth Rate (CAGR) of the Agarose Resin Market?
The projected CAGR is approximately 8.91%.
2. Which companies are prominent players in the Agarose Resin Market?
Key companies in the market include Ecolab Inc (Purolite), Takara Bio Inc, Bio-Rad Laboratories Inc, Cube Biotech Inc, Cytiva, Agarose Beads Technologies, Merck KGaA, Thermo Fisher Scientific Inc, Bio-Works, Tosoh Bioscience LLC, Repligen Corporation, Kaneka Corporation*List Not Exhaustive.
3. What are the main segments of the Agarose Resin Market?
The market segments include Concentration, Application, End User.
4. Can you provide details about the market size?
The market size is estimated to be USD 0.68 Million as of 2022.
5. What are some drivers contributing to market growth?
Rising Applications of Agarose Resin in Biopharmaceutical Industry; Surging Research and Development Activities.
6. What are the notable trends driving market growth?
Protein Purification Segment is Expected to Hold a Highest Share of the Market.
7. Are there any restraints impacting market growth?
Rising Applications of Agarose Resin in Biopharmaceutical Industry; Surging Research and Development Activities.
8. Can you provide examples of recent developments in the market?
In April 2024, Agarose Beads Technologies received halal certification for some of its agarose beads used in the biopharmaceutical and bioprocessing industries, ensuring a strong commitment to high quality and customer satisfaction.
9. What pricing options are available for accessing the report?
Pricing options include single-user, multi-user, and enterprise licenses priced at USD 4750, USD 5250, and USD 8750 respectively.
10. Is the market size provided in terms of value or volume?
The market size is provided in terms of value, measured in Million and volume, measured in Billion.
11. Are there any specific market keywords associated with the report?
Yes, the market keyword associated with the report is "Agarose Resin Market," which aids in identifying and referencing the specific market segment covered.
12. How do I determine which pricing option suits my needs best?
The pricing options vary based on user requirements and access needs. Individual users may opt for single-user licenses, while businesses requiring broader access may choose multi-user or enterprise licenses for cost-effective access to the report.
13. Are there any additional resources or data provided in the Agarose Resin Market report?
While the report offers comprehensive insights, it's advisable to review the specific contents or supplementary materials provided to ascertain if additional resources or data are available.
14. How can I stay updated on further developments or reports in the Agarose Resin Market?
To stay informed about further developments, trends, and reports in the Agarose Resin Market, consider subscribing to industry newsletters, following relevant companies and organizations, or regularly checking reputable industry news sources and publications.
Methodology
Step 1 - Identification of Relevant Samples Size from Population Database


Step 2 - Approaches for Defining Global Market Size (Value, Volume* & Price*)

Note*: In applicable scenarios
Step 3 - Data Sources
Primary Research
- Web Analytics
- Survey Reports
- Research Institute
- Latest Research Reports
- Opinion Leaders
Secondary Research
- Annual Reports
- White Paper
- Latest Press Release
- Industry Association
- Paid Database
- Investor Presentations

Step 4 - Data Triangulation
Involves using different sources of information in order to increase the validity of a study
These sources are likely to be stakeholders in a program - participants, other researchers, program staff, other community members, and so on.
Then we put all data in single framework & apply various statistical tools to find out the dynamic on the market.
During the analysis stage, feedback from the stakeholder groups would be compared to determine areas of agreement as well as areas of divergence