

Key Insights
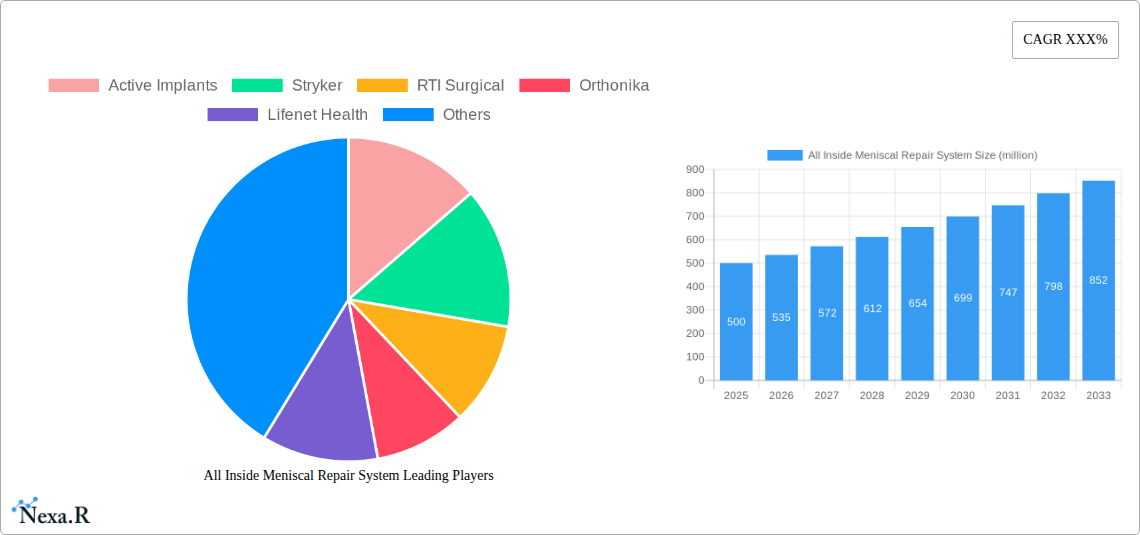
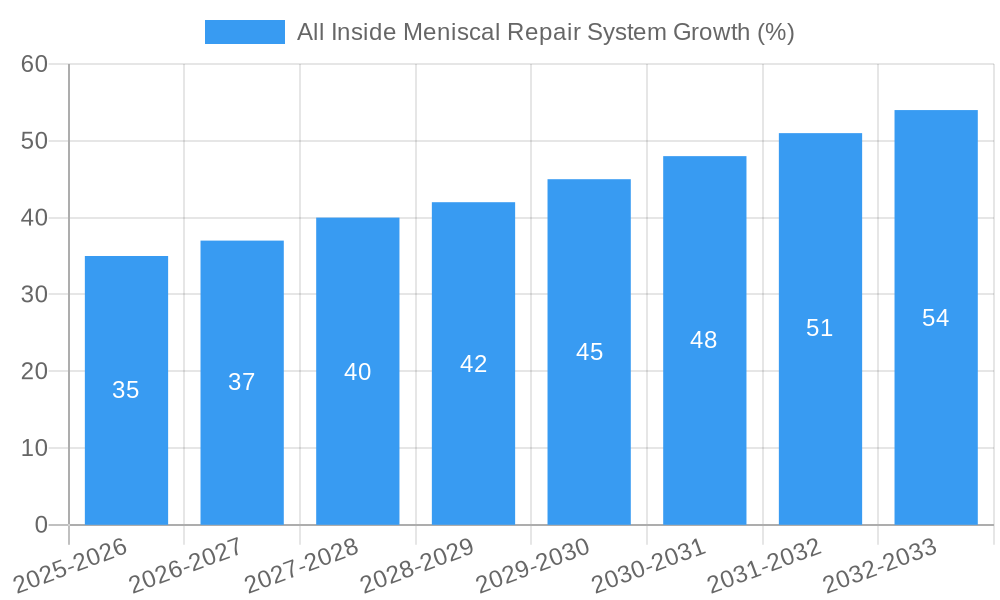
The global market for All-Inside Meniscal Repair Systems is experiencing robust growth, driven by an aging population, increasing incidence of sports injuries, and advancements in minimally invasive surgical techniques. The market's value in 2025 is estimated at $500 million, reflecting a significant increase from previous years. A Compound Annual Growth Rate (CAGR) of 7% is projected from 2025 to 2033, indicating sustained expansion. Key drivers include the rising prevalence of knee injuries, particularly meniscus tears, among athletes and the general population. The preference for less invasive procedures, offering faster recovery times and reduced hospital stays, significantly boosts the demand for All-Inside Meniscal Repair Systems. Technological advancements leading to improved implant designs, enhanced biocompatibility, and better surgical tools further contribute to market growth. However, the market faces some restraints, including the high cost of these systems, the need for specialized surgical skills, and potential complications associated with the procedure.
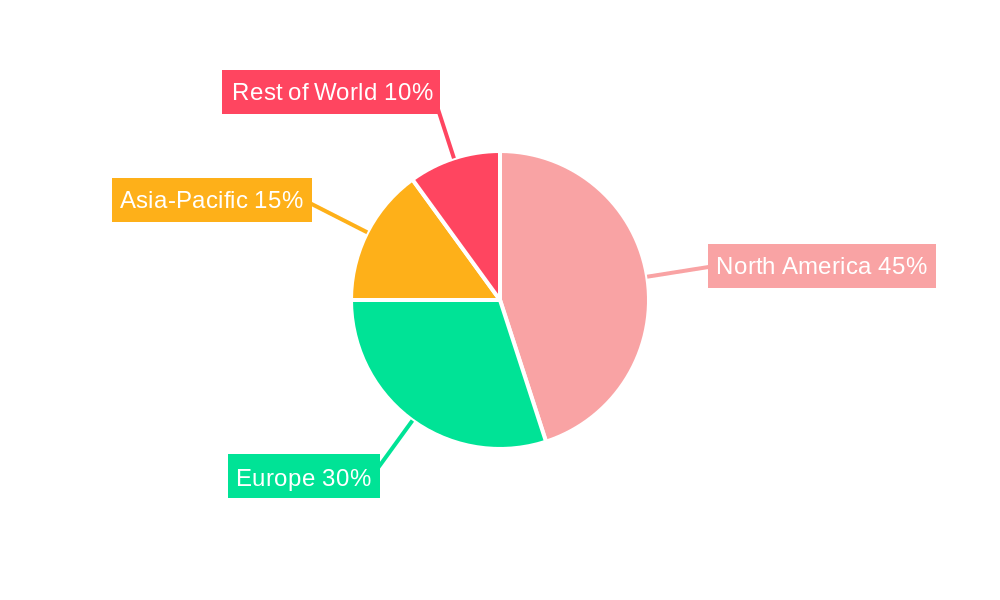
Market segmentation reveals significant opportunities within specific regions and product types. North America currently holds a dominant market share due to its advanced healthcare infrastructure and higher adoption rates. However, Asia-Pacific is poised for significant growth due to rising healthcare expenditure and increasing awareness of minimally invasive surgical techniques. Key players like Active Implants, Stryker, RTI Surgical, Orthonika, Lifenet Health, Zimmer Biomet, Biofixt, and Wuxi Betta Medical Technology are actively engaged in research and development, competitive pricing strategies, and strategic partnerships to enhance their market position. The competitive landscape is characterized by both established medical device companies and emerging players focused on innovation. Future growth will depend on the successful integration of new technologies, the development of more cost-effective solutions, and the expansion of market access in emerging economies.
All Inside Meniscal Repair System Market Report: 2019-2033
This comprehensive report provides a detailed analysis of the All Inside Meniscal Repair System market, offering invaluable insights for industry professionals, investors, and strategic decision-makers. The study covers the period from 2019 to 2033, with 2025 serving as the base and estimated year. The report leverages extensive data analysis and expert insights to forecast market trends and identify lucrative opportunities within this dynamic sector. This report focuses on the parent market of Orthopedic Implants and the child market of Meniscal Repair Devices.
All Inside Meniscal Repair System Market Dynamics & Structure
This section analyzes the competitive landscape, technological advancements, and regulatory influences shaping the All Inside Meniscal Repair System market. The market is moderately fragmented, with key players vying for market share through innovation and strategic partnerships.
- Market Concentration: The market exhibits moderate concentration, with the top five players holding an estimated xx% market share in 2025. This is expected to slightly decrease to xx% by 2033 due to increasing competition from smaller players.
- Technological Innovation: Continuous advancements in biomaterials, minimally invasive surgical techniques, and improved implant designs drive market growth. However, challenges remain in developing systems that offer superior biocompatibility and long-term durability.
- Regulatory Frameworks: Stringent regulatory approvals (e.g., FDA clearance) pose a significant barrier to market entry, favouring established players. However, harmonization of global regulatory standards is predicted to ease entry for some players by 2030.
- Competitive Product Substitutes: Traditional open meniscectomy procedures and other less invasive repair techniques are significant substitutes but All Inside Meniscal Repair Systems offer advantages in terms of quicker recovery times and improved patient outcomes, thus boosting demand.
- End-User Demographics: The aging population and increasing prevalence of sports-related injuries contribute significantly to rising demand for meniscal repair procedures and consequently for All Inside Meniscal Repair Systems.
- M&A Trends: The market has witnessed a moderate number of mergers and acquisitions (M&A) deals (xx deals between 2019 and 2024) primarily focused on strengthening product portfolios and expanding geographical reach. This activity is expected to increase modestly by 2033.
All Inside Meniscal Repair System Growth Trends & Insights
The All Inside Meniscal Repair System market has exhibited robust growth during the historical period (2019-2024), driven by technological advancements and increasing adoption rates. The market size is projected to reach $xx million in 2025 and is expected to expand at a CAGR of xx% from 2025 to 2033, reaching $xx million by the end of the forecast period. This growth is largely attributed to:
- Rising prevalence of sports-related knee injuries, especially among younger populations.
- Increased awareness among healthcare professionals and patients about minimally invasive surgical techniques.
- Favorable reimbursement policies in several developed markets.
- Technological advancements that improve the efficacy and safety of these systems.
- Growing demand for faster recovery times and improved patient outcomes.
Dominant Regions, Countries, or Segments in All Inside Meniscal Repair System
North America currently dominates the All Inside Meniscal Repair System market, accounting for an estimated xx% of the global market share in 2025. This dominance is attributable to several factors:
- High prevalence of sports injuries: The high participation rates in sports and recreational activities in North America contribute to a larger patient pool requiring meniscal repair procedures.
- Well-established healthcare infrastructure: The region boasts advanced healthcare infrastructure and skilled medical professionals capable of performing complex surgical procedures.
- High disposable income and health insurance coverage: A significant proportion of the population has health insurance coverage, facilitating access to advanced medical treatments.
- Technological advancements and early adoption: North American markets are known for their early adoption of cutting-edge medical technologies.
Europe is anticipated to exhibit strong growth in the forecast period, driven by increased healthcare spending and a growing awareness of minimally invasive surgical options. Asia-Pacific is expected to witness a faster growth rate, albeit from a smaller base, due to rising disposable incomes and increasing healthcare expenditure in developing economies within the region.
All Inside Meniscal Repair System Product Landscape
All Inside Meniscal Repair Systems offer a range of innovative features, including biocompatible materials, enhanced fixation mechanisms, and improved surgical techniques that result in reduced surgical time, quicker recovery, and minimal complications. Product differentiation is primarily driven by unique material compositions, suture configurations, and ease of use during the surgical procedure. Key advancements include the incorporation of advanced biomaterials to improve integration with the native meniscus tissue and reduce the risk of rejection.
Key Drivers, Barriers & Challenges in All Inside Meniscal Repair System
Key Drivers:
- The increasing prevalence of knee injuries due to the rising global population and growing participation in sports and recreational activities.
- Technological advancements leading to improved implant designs, surgical techniques, and patient outcomes.
- Favorable reimbursement policies in many developed and developing economies.
- Growing awareness among healthcare professionals and patients about the benefits of minimally invasive surgery.
Key Challenges and Restraints:
- High cost of implants, limiting accessibility in lower-income countries and regions.
- The complexities of surgical procedures associated with All Inside Meniscal Repair Systems may lead to increased risk, and necessitates specialized training.
- Stringent regulatory requirements in many regions, delaying market access for new products.
- Potential for complications such as implant failure or infection.
Emerging Opportunities in All Inside Meniscal Repair System
- Expansion into untapped markets in emerging economies.
- Development of novel biomaterials and implant designs to enhance biocompatibility and durability.
- Integration of advanced imaging technologies to improve surgical accuracy and precision.
- Growing demand for personalized medicine approaches in meniscal repair.
Growth Accelerators in the All Inside Meniscal Repair System Industry
Strategic partnerships between device manufacturers and healthcare providers are accelerating growth by facilitating faster product adoption, improved clinical outcomes, and increased market access. Further technological innovation focused on enhancing biocompatibility, implant longevity, and minimally invasive surgical techniques will fuel market expansion. Investment in research and development focused on understanding the long-term effects of these implants on patient health will further enhance market confidence and future growth.
Key Players Shaping the All Inside Meniscal Repair System Market
- Active Implants
- Stryker
- RTI Surgical
- Orthonika
- Lifenet Health
- Zimmer Biomet
- Biofixt
- Wuxi Betta Medical Technology
Notable Milestones in All Inside Meniscal Repair System Sector
- 2020: Active Implants launched a new generation of All Inside Meniscal Repair System featuring improved biocompatibility.
- 2022: Stryker acquired a smaller competitor, expanding its product portfolio in this segment.
- 2023: FDA approves a novel All Inside Meniscal Repair System with enhanced fixation capabilities. (Note: Specific dates may vary depending on actual releases)
In-Depth All Inside Meniscal Repair System Market Outlook
The All Inside Meniscal Repair System market is poised for continued growth driven by technological advancements, increasing prevalence of knee injuries, and rising healthcare expenditure globally. Strategic partnerships, focused R&D efforts, and expansion into emerging markets will further shape market dynamics. This presents substantial opportunities for established players to expand market share and for new entrants to establish themselves in this promising sector. The long-term forecast suggests sustained growth, with the potential for significant market expansion by 2033.
All Inside Meniscal Repair System Segmentation
-
1. Application
- 1.1. Hospitals
- 1.2. Clinics
- 1.3. Others
-
2. Type
- 2.1. Allograft
- 2.2. Synthetic Grafting
- 2.3. Xenograft
All Inside Meniscal Repair System Segmentation By Geography
-
1. North America
- 1.1. United States
- 1.2. Canada
- 1.3. Mexico
-
2. South America
- 2.1. Brazil
- 2.2. Argentina
- 2.3. Rest of South America
-
3. Europe
- 3.1. United Kingdom
- 3.2. Germany
- 3.3. France
- 3.4. Italy
- 3.5. Spain
- 3.6. Russia
- 3.7. Benelux
- 3.8. Nordics
- 3.9. Rest of Europe
-
4. Middle East & Africa
- 4.1. Turkey
- 4.2. Israel
- 4.3. GCC
- 4.4. North Africa
- 4.5. South Africa
- 4.6. Rest of Middle East & Africa
-
5. Asia Pacific
- 5.1. China
- 5.2. India
- 5.3. Japan
- 5.4. South Korea
- 5.5. ASEAN
- 5.6. Oceania
- 5.7. Rest of Asia Pacific
All Inside Meniscal Repair System REPORT HIGHLIGHTS
| Aspects | Details |
|---|---|
| Study Period | 2019-2033 |
| Base Year | 2024 |
| Estimated Year | 2025 |
| Forecast Period | 2025-2033 |
| Historical Period | 2019-2024 |
| Growth Rate | CAGR of XXX% from 2019-2033 |
| Segmentation |
|
Table of Contents
- 1. Introduction
- 1.1. Research Scope
- 1.2. Market Segmentation
- 1.3. Research Methodology
- 1.4. Definitions and Assumptions
- 2. Executive Summary
- 2.1. Introduction
- 3. Market Dynamics
- 3.1. Introduction
- 3.2. Market Drivers
- 3.3. Market Restrains
- 3.4. Market Trends
- 4. Market Factor Analysis
- 4.1. Porters Five Forces
- 4.2. Supply/Value Chain
- 4.3. PESTEL analysis
- 4.4. Market Entropy
- 4.5. Patent/Trademark Analysis
- 5. Global All Inside Meniscal Repair System Analysis, Insights and Forecast, 2019-2031
- 5.1. Market Analysis, Insights and Forecast - by Application
- 5.1.1. Hospitals
- 5.1.2. Clinics
- 5.1.3. Others
- 5.2. Market Analysis, Insights and Forecast - by Type
- 5.2.1. Allograft
- 5.2.2. Synthetic Grafting
- 5.2.3. Xenograft
- 5.3. Market Analysis, Insights and Forecast - by Region
- 5.3.1. North America
- 5.3.2. South America
- 5.3.3. Europe
- 5.3.4. Middle East & Africa
- 5.3.5. Asia Pacific
- 5.1. Market Analysis, Insights and Forecast - by Application
- 6. North America All Inside Meniscal Repair System Analysis, Insights and Forecast, 2019-2031
- 6.1. Market Analysis, Insights and Forecast - by Application
- 6.1.1. Hospitals
- 6.1.2. Clinics
- 6.1.3. Others
- 6.2. Market Analysis, Insights and Forecast - by Type
- 6.2.1. Allograft
- 6.2.2. Synthetic Grafting
- 6.2.3. Xenograft
- 6.1. Market Analysis, Insights and Forecast - by Application
- 7. South America All Inside Meniscal Repair System Analysis, Insights and Forecast, 2019-2031
- 7.1. Market Analysis, Insights and Forecast - by Application
- 7.1.1. Hospitals
- 7.1.2. Clinics
- 7.1.3. Others
- 7.2. Market Analysis, Insights and Forecast - by Type
- 7.2.1. Allograft
- 7.2.2. Synthetic Grafting
- 7.2.3. Xenograft
- 7.1. Market Analysis, Insights and Forecast - by Application
- 8. Europe All Inside Meniscal Repair System Analysis, Insights and Forecast, 2019-2031
- 8.1. Market Analysis, Insights and Forecast - by Application
- 8.1.1. Hospitals
- 8.1.2. Clinics
- 8.1.3. Others
- 8.2. Market Analysis, Insights and Forecast - by Type
- 8.2.1. Allograft
- 8.2.2. Synthetic Grafting
- 8.2.3. Xenograft
- 8.1. Market Analysis, Insights and Forecast - by Application
- 9. Middle East & Africa All Inside Meniscal Repair System Analysis, Insights and Forecast, 2019-2031
- 9.1. Market Analysis, Insights and Forecast - by Application
- 9.1.1. Hospitals
- 9.1.2. Clinics
- 9.1.3. Others
- 9.2. Market Analysis, Insights and Forecast - by Type
- 9.2.1. Allograft
- 9.2.2. Synthetic Grafting
- 9.2.3. Xenograft
- 9.1. Market Analysis, Insights and Forecast - by Application
- 10. Asia Pacific All Inside Meniscal Repair System Analysis, Insights and Forecast, 2019-2031
- 10.1. Market Analysis, Insights and Forecast - by Application
- 10.1.1. Hospitals
- 10.1.2. Clinics
- 10.1.3. Others
- 10.2. Market Analysis, Insights and Forecast - by Type
- 10.2.1. Allograft
- 10.2.2. Synthetic Grafting
- 10.2.3. Xenograft
- 10.1. Market Analysis, Insights and Forecast - by Application
- 11. Competitive Analysis
- 11.1. Global Market Share Analysis 2024
- 11.2. Company Profiles
- 11.2.1 Active Implants
- 11.2.1.1. Overview
- 11.2.1.2. Products
- 11.2.1.3. SWOT Analysis
- 11.2.1.4. Recent Developments
- 11.2.1.5. Financials (Based on Availability)
- 11.2.2 Stryker
- 11.2.2.1. Overview
- 11.2.2.2. Products
- 11.2.2.3. SWOT Analysis
- 11.2.2.4. Recent Developments
- 11.2.2.5. Financials (Based on Availability)
- 11.2.3 RTI Surgical
- 11.2.3.1. Overview
- 11.2.3.2. Products
- 11.2.3.3. SWOT Analysis
- 11.2.3.4. Recent Developments
- 11.2.3.5. Financials (Based on Availability)
- 11.2.4 Orthonika
- 11.2.4.1. Overview
- 11.2.4.2. Products
- 11.2.4.3. SWOT Analysis
- 11.2.4.4. Recent Developments
- 11.2.4.5. Financials (Based on Availability)
- 11.2.5 Lifenet Health
- 11.2.5.1. Overview
- 11.2.5.2. Products
- 11.2.5.3. SWOT Analysis
- 11.2.5.4. Recent Developments
- 11.2.5.5. Financials (Based on Availability)
- 11.2.6 Zimmer
- 11.2.6.1. Overview
- 11.2.6.2. Products
- 11.2.6.3. SWOT Analysis
- 11.2.6.4. Recent Developments
- 11.2.6.5. Financials (Based on Availability)
- 11.2.7 Biofixt
- 11.2.7.1. Overview
- 11.2.7.2. Products
- 11.2.7.3. SWOT Analysis
- 11.2.7.4. Recent Developments
- 11.2.7.5. Financials (Based on Availability)
- 11.2.8 Wuxi Betta Medical Technology
- 11.2.8.1. Overview
- 11.2.8.2. Products
- 11.2.8.3. SWOT Analysis
- 11.2.8.4. Recent Developments
- 11.2.8.5. Financials (Based on Availability)
- 11.2.1 Active Implants
List of Figures
- Figure 1: Global All Inside Meniscal Repair System Revenue Breakdown (million, %) by Region 2024 & 2032
- Figure 2: Global All Inside Meniscal Repair System Volume Breakdown (K, %) by Region 2024 & 2032
- Figure 3: North America All Inside Meniscal Repair System Revenue (million), by Application 2024 & 2032
- Figure 4: North America All Inside Meniscal Repair System Volume (K), by Application 2024 & 2032
- Figure 5: North America All Inside Meniscal Repair System Revenue Share (%), by Application 2024 & 2032
- Figure 6: North America All Inside Meniscal Repair System Volume Share (%), by Application 2024 & 2032
- Figure 7: North America All Inside Meniscal Repair System Revenue (million), by Type 2024 & 2032
- Figure 8: North America All Inside Meniscal Repair System Volume (K), by Type 2024 & 2032
- Figure 9: North America All Inside Meniscal Repair System Revenue Share (%), by Type 2024 & 2032
- Figure 10: North America All Inside Meniscal Repair System Volume Share (%), by Type 2024 & 2032
- Figure 11: North America All Inside Meniscal Repair System Revenue (million), by Country 2024 & 2032
- Figure 12: North America All Inside Meniscal Repair System Volume (K), by Country 2024 & 2032
- Figure 13: North America All Inside Meniscal Repair System Revenue Share (%), by Country 2024 & 2032
- Figure 14: North America All Inside Meniscal Repair System Volume Share (%), by Country 2024 & 2032
- Figure 15: South America All Inside Meniscal Repair System Revenue (million), by Application 2024 & 2032
- Figure 16: South America All Inside Meniscal Repair System Volume (K), by Application 2024 & 2032
- Figure 17: South America All Inside Meniscal Repair System Revenue Share (%), by Application 2024 & 2032
- Figure 18: South America All Inside Meniscal Repair System Volume Share (%), by Application 2024 & 2032
- Figure 19: South America All Inside Meniscal Repair System Revenue (million), by Type 2024 & 2032
- Figure 20: South America All Inside Meniscal Repair System Volume (K), by Type 2024 & 2032
- Figure 21: South America All Inside Meniscal Repair System Revenue Share (%), by Type 2024 & 2032
- Figure 22: South America All Inside Meniscal Repair System Volume Share (%), by Type 2024 & 2032
- Figure 23: South America All Inside Meniscal Repair System Revenue (million), by Country 2024 & 2032
- Figure 24: South America All Inside Meniscal Repair System Volume (K), by Country 2024 & 2032
- Figure 25: South America All Inside Meniscal Repair System Revenue Share (%), by Country 2024 & 2032
- Figure 26: South America All Inside Meniscal Repair System Volume Share (%), by Country 2024 & 2032
- Figure 27: Europe All Inside Meniscal Repair System Revenue (million), by Application 2024 & 2032
- Figure 28: Europe All Inside Meniscal Repair System Volume (K), by Application 2024 & 2032
- Figure 29: Europe All Inside Meniscal Repair System Revenue Share (%), by Application 2024 & 2032
- Figure 30: Europe All Inside Meniscal Repair System Volume Share (%), by Application 2024 & 2032
- Figure 31: Europe All Inside Meniscal Repair System Revenue (million), by Type 2024 & 2032
- Figure 32: Europe All Inside Meniscal Repair System Volume (K), by Type 2024 & 2032
- Figure 33: Europe All Inside Meniscal Repair System Revenue Share (%), by Type 2024 & 2032
- Figure 34: Europe All Inside Meniscal Repair System Volume Share (%), by Type 2024 & 2032
- Figure 35: Europe All Inside Meniscal Repair System Revenue (million), by Country 2024 & 2032
- Figure 36: Europe All Inside Meniscal Repair System Volume (K), by Country 2024 & 2032
- Figure 37: Europe All Inside Meniscal Repair System Revenue Share (%), by Country 2024 & 2032
- Figure 38: Europe All Inside Meniscal Repair System Volume Share (%), by Country 2024 & 2032
- Figure 39: Middle East & Africa All Inside Meniscal Repair System Revenue (million), by Application 2024 & 2032
- Figure 40: Middle East & Africa All Inside Meniscal Repair System Volume (K), by Application 2024 & 2032
- Figure 41: Middle East & Africa All Inside Meniscal Repair System Revenue Share (%), by Application 2024 & 2032
- Figure 42: Middle East & Africa All Inside Meniscal Repair System Volume Share (%), by Application 2024 & 2032
- Figure 43: Middle East & Africa All Inside Meniscal Repair System Revenue (million), by Type 2024 & 2032
- Figure 44: Middle East & Africa All Inside Meniscal Repair System Volume (K), by Type 2024 & 2032
- Figure 45: Middle East & Africa All Inside Meniscal Repair System Revenue Share (%), by Type 2024 & 2032
- Figure 46: Middle East & Africa All Inside Meniscal Repair System Volume Share (%), by Type 2024 & 2032
- Figure 47: Middle East & Africa All Inside Meniscal Repair System Revenue (million), by Country 2024 & 2032
- Figure 48: Middle East & Africa All Inside Meniscal Repair System Volume (K), by Country 2024 & 2032
- Figure 49: Middle East & Africa All Inside Meniscal Repair System Revenue Share (%), by Country 2024 & 2032
- Figure 50: Middle East & Africa All Inside Meniscal Repair System Volume Share (%), by Country 2024 & 2032
- Figure 51: Asia Pacific All Inside Meniscal Repair System Revenue (million), by Application 2024 & 2032
- Figure 52: Asia Pacific All Inside Meniscal Repair System Volume (K), by Application 2024 & 2032
- Figure 53: Asia Pacific All Inside Meniscal Repair System Revenue Share (%), by Application 2024 & 2032
- Figure 54: Asia Pacific All Inside Meniscal Repair System Volume Share (%), by Application 2024 & 2032
- Figure 55: Asia Pacific All Inside Meniscal Repair System Revenue (million), by Type 2024 & 2032
- Figure 56: Asia Pacific All Inside Meniscal Repair System Volume (K), by Type 2024 & 2032
- Figure 57: Asia Pacific All Inside Meniscal Repair System Revenue Share (%), by Type 2024 & 2032
- Figure 58: Asia Pacific All Inside Meniscal Repair System Volume Share (%), by Type 2024 & 2032
- Figure 59: Asia Pacific All Inside Meniscal Repair System Revenue (million), by Country 2024 & 2032
- Figure 60: Asia Pacific All Inside Meniscal Repair System Volume (K), by Country 2024 & 2032
- Figure 61: Asia Pacific All Inside Meniscal Repair System Revenue Share (%), by Country 2024 & 2032
- Figure 62: Asia Pacific All Inside Meniscal Repair System Volume Share (%), by Country 2024 & 2032
List of Tables
- Table 1: Global All Inside Meniscal Repair System Revenue million Forecast, by Region 2019 & 2032
- Table 2: Global All Inside Meniscal Repair System Volume K Forecast, by Region 2019 & 2032
- Table 3: Global All Inside Meniscal Repair System Revenue million Forecast, by Application 2019 & 2032
- Table 4: Global All Inside Meniscal Repair System Volume K Forecast, by Application 2019 & 2032
- Table 5: Global All Inside Meniscal Repair System Revenue million Forecast, by Type 2019 & 2032
- Table 6: Global All Inside Meniscal Repair System Volume K Forecast, by Type 2019 & 2032
- Table 7: Global All Inside Meniscal Repair System Revenue million Forecast, by Region 2019 & 2032
- Table 8: Global All Inside Meniscal Repair System Volume K Forecast, by Region 2019 & 2032
- Table 9: Global All Inside Meniscal Repair System Revenue million Forecast, by Application 2019 & 2032
- Table 10: Global All Inside Meniscal Repair System Volume K Forecast, by Application 2019 & 2032
- Table 11: Global All Inside Meniscal Repair System Revenue million Forecast, by Type 2019 & 2032
- Table 12: Global All Inside Meniscal Repair System Volume K Forecast, by Type 2019 & 2032
- Table 13: Global All Inside Meniscal Repair System Revenue million Forecast, by Country 2019 & 2032
- Table 14: Global All Inside Meniscal Repair System Volume K Forecast, by Country 2019 & 2032
- Table 15: United States All Inside Meniscal Repair System Revenue (million) Forecast, by Application 2019 & 2032
- Table 16: United States All Inside Meniscal Repair System Volume (K) Forecast, by Application 2019 & 2032
- Table 17: Canada All Inside Meniscal Repair System Revenue (million) Forecast, by Application 2019 & 2032
- Table 18: Canada All Inside Meniscal Repair System Volume (K) Forecast, by Application 2019 & 2032
- Table 19: Mexico All Inside Meniscal Repair System Revenue (million) Forecast, by Application 2019 & 2032
- Table 20: Mexico All Inside Meniscal Repair System Volume (K) Forecast, by Application 2019 & 2032
- Table 21: Global All Inside Meniscal Repair System Revenue million Forecast, by Application 2019 & 2032
- Table 22: Global All Inside Meniscal Repair System Volume K Forecast, by Application 2019 & 2032
- Table 23: Global All Inside Meniscal Repair System Revenue million Forecast, by Type 2019 & 2032
- Table 24: Global All Inside Meniscal Repair System Volume K Forecast, by Type 2019 & 2032
- Table 25: Global All Inside Meniscal Repair System Revenue million Forecast, by Country 2019 & 2032
- Table 26: Global All Inside Meniscal Repair System Volume K Forecast, by Country 2019 & 2032
- Table 27: Brazil All Inside Meniscal Repair System Revenue (million) Forecast, by Application 2019 & 2032
- Table 28: Brazil All Inside Meniscal Repair System Volume (K) Forecast, by Application 2019 & 2032
- Table 29: Argentina All Inside Meniscal Repair System Revenue (million) Forecast, by Application 2019 & 2032
- Table 30: Argentina All Inside Meniscal Repair System Volume (K) Forecast, by Application 2019 & 2032
- Table 31: Rest of South America All Inside Meniscal Repair System Revenue (million) Forecast, by Application 2019 & 2032
- Table 32: Rest of South America All Inside Meniscal Repair System Volume (K) Forecast, by Application 2019 & 2032
- Table 33: Global All Inside Meniscal Repair System Revenue million Forecast, by Application 2019 & 2032
- Table 34: Global All Inside Meniscal Repair System Volume K Forecast, by Application 2019 & 2032
- Table 35: Global All Inside Meniscal Repair System Revenue million Forecast, by Type 2019 & 2032
- Table 36: Global All Inside Meniscal Repair System Volume K Forecast, by Type 2019 & 2032
- Table 37: Global All Inside Meniscal Repair System Revenue million Forecast, by Country 2019 & 2032
- Table 38: Global All Inside Meniscal Repair System Volume K Forecast, by Country 2019 & 2032
- Table 39: United Kingdom All Inside Meniscal Repair System Revenue (million) Forecast, by Application 2019 & 2032
- Table 40: United Kingdom All Inside Meniscal Repair System Volume (K) Forecast, by Application 2019 & 2032
- Table 41: Germany All Inside Meniscal Repair System Revenue (million) Forecast, by Application 2019 & 2032
- Table 42: Germany All Inside Meniscal Repair System Volume (K) Forecast, by Application 2019 & 2032
- Table 43: France All Inside Meniscal Repair System Revenue (million) Forecast, by Application 2019 & 2032
- Table 44: France All Inside Meniscal Repair System Volume (K) Forecast, by Application 2019 & 2032
- Table 45: Italy All Inside Meniscal Repair System Revenue (million) Forecast, by Application 2019 & 2032
- Table 46: Italy All Inside Meniscal Repair System Volume (K) Forecast, by Application 2019 & 2032
- Table 47: Spain All Inside Meniscal Repair System Revenue (million) Forecast, by Application 2019 & 2032
- Table 48: Spain All Inside Meniscal Repair System Volume (K) Forecast, by Application 2019 & 2032
- Table 49: Russia All Inside Meniscal Repair System Revenue (million) Forecast, by Application 2019 & 2032
- Table 50: Russia All Inside Meniscal Repair System Volume (K) Forecast, by Application 2019 & 2032
- Table 51: Benelux All Inside Meniscal Repair System Revenue (million) Forecast, by Application 2019 & 2032
- Table 52: Benelux All Inside Meniscal Repair System Volume (K) Forecast, by Application 2019 & 2032
- Table 53: Nordics All Inside Meniscal Repair System Revenue (million) Forecast, by Application 2019 & 2032
- Table 54: Nordics All Inside Meniscal Repair System Volume (K) Forecast, by Application 2019 & 2032
- Table 55: Rest of Europe All Inside Meniscal Repair System Revenue (million) Forecast, by Application 2019 & 2032
- Table 56: Rest of Europe All Inside Meniscal Repair System Volume (K) Forecast, by Application 2019 & 2032
- Table 57: Global All Inside Meniscal Repair System Revenue million Forecast, by Application 2019 & 2032
- Table 58: Global All Inside Meniscal Repair System Volume K Forecast, by Application 2019 & 2032
- Table 59: Global All Inside Meniscal Repair System Revenue million Forecast, by Type 2019 & 2032
- Table 60: Global All Inside Meniscal Repair System Volume K Forecast, by Type 2019 & 2032
- Table 61: Global All Inside Meniscal Repair System Revenue million Forecast, by Country 2019 & 2032
- Table 62: Global All Inside Meniscal Repair System Volume K Forecast, by Country 2019 & 2032
- Table 63: Turkey All Inside Meniscal Repair System Revenue (million) Forecast, by Application 2019 & 2032
- Table 64: Turkey All Inside Meniscal Repair System Volume (K) Forecast, by Application 2019 & 2032
- Table 65: Israel All Inside Meniscal Repair System Revenue (million) Forecast, by Application 2019 & 2032
- Table 66: Israel All Inside Meniscal Repair System Volume (K) Forecast, by Application 2019 & 2032
- Table 67: GCC All Inside Meniscal Repair System Revenue (million) Forecast, by Application 2019 & 2032
- Table 68: GCC All Inside Meniscal Repair System Volume (K) Forecast, by Application 2019 & 2032
- Table 69: North Africa All Inside Meniscal Repair System Revenue (million) Forecast, by Application 2019 & 2032
- Table 70: North Africa All Inside Meniscal Repair System Volume (K) Forecast, by Application 2019 & 2032
- Table 71: South Africa All Inside Meniscal Repair System Revenue (million) Forecast, by Application 2019 & 2032
- Table 72: South Africa All Inside Meniscal Repair System Volume (K) Forecast, by Application 2019 & 2032
- Table 73: Rest of Middle East & Africa All Inside Meniscal Repair System Revenue (million) Forecast, by Application 2019 & 2032
- Table 74: Rest of Middle East & Africa All Inside Meniscal Repair System Volume (K) Forecast, by Application 2019 & 2032
- Table 75: Global All Inside Meniscal Repair System Revenue million Forecast, by Application 2019 & 2032
- Table 76: Global All Inside Meniscal Repair System Volume K Forecast, by Application 2019 & 2032
- Table 77: Global All Inside Meniscal Repair System Revenue million Forecast, by Type 2019 & 2032
- Table 78: Global All Inside Meniscal Repair System Volume K Forecast, by Type 2019 & 2032
- Table 79: Global All Inside Meniscal Repair System Revenue million Forecast, by Country 2019 & 2032
- Table 80: Global All Inside Meniscal Repair System Volume K Forecast, by Country 2019 & 2032
- Table 81: China All Inside Meniscal Repair System Revenue (million) Forecast, by Application 2019 & 2032
- Table 82: China All Inside Meniscal Repair System Volume (K) Forecast, by Application 2019 & 2032
- Table 83: India All Inside Meniscal Repair System Revenue (million) Forecast, by Application 2019 & 2032
- Table 84: India All Inside Meniscal Repair System Volume (K) Forecast, by Application 2019 & 2032
- Table 85: Japan All Inside Meniscal Repair System Revenue (million) Forecast, by Application 2019 & 2032
- Table 86: Japan All Inside Meniscal Repair System Volume (K) Forecast, by Application 2019 & 2032
- Table 87: South Korea All Inside Meniscal Repair System Revenue (million) Forecast, by Application 2019 & 2032
- Table 88: South Korea All Inside Meniscal Repair System Volume (K) Forecast, by Application 2019 & 2032
- Table 89: ASEAN All Inside Meniscal Repair System Revenue (million) Forecast, by Application 2019 & 2032
- Table 90: ASEAN All Inside Meniscal Repair System Volume (K) Forecast, by Application 2019 & 2032
- Table 91: Oceania All Inside Meniscal Repair System Revenue (million) Forecast, by Application 2019 & 2032
- Table 92: Oceania All Inside Meniscal Repair System Volume (K) Forecast, by Application 2019 & 2032
- Table 93: Rest of Asia Pacific All Inside Meniscal Repair System Revenue (million) Forecast, by Application 2019 & 2032
- Table 94: Rest of Asia Pacific All Inside Meniscal Repair System Volume (K) Forecast, by Application 2019 & 2032
Frequently Asked Questions
1. What is the projected Compound Annual Growth Rate (CAGR) of the All Inside Meniscal Repair System?
The projected CAGR is approximately XXX%.
2. Which companies are prominent players in the All Inside Meniscal Repair System?
Key companies in the market include Active Implants, Stryker, RTI Surgical, Orthonika, Lifenet Health, Zimmer, Biofixt, Wuxi Betta Medical Technology.
3. What are the main segments of the All Inside Meniscal Repair System?
The market segments include Application, Type.
4. Can you provide details about the market size?
The market size is estimated to be USD XXX million as of 2022.
5. What are some drivers contributing to market growth?
N/A
6. What are the notable trends driving market growth?
N/A
7. Are there any restraints impacting market growth?
N/A
8. Can you provide examples of recent developments in the market?
N/A
9. What pricing options are available for accessing the report?
Pricing options include single-user, multi-user, and enterprise licenses priced at USD 3950.00, USD 5925.00, and USD 7900.00 respectively.
10. Is the market size provided in terms of value or volume?
The market size is provided in terms of value, measured in million and volume, measured in K.
11. Are there any specific market keywords associated with the report?
Yes, the market keyword associated with the report is "All Inside Meniscal Repair System," which aids in identifying and referencing the specific market segment covered.
12. How do I determine which pricing option suits my needs best?
The pricing options vary based on user requirements and access needs. Individual users may opt for single-user licenses, while businesses requiring broader access may choose multi-user or enterprise licenses for cost-effective access to the report.
13. Are there any additional resources or data provided in the All Inside Meniscal Repair System report?
While the report offers comprehensive insights, it's advisable to review the specific contents or supplementary materials provided to ascertain if additional resources or data are available.
14. How can I stay updated on further developments or reports in the All Inside Meniscal Repair System?
To stay informed about further developments, trends, and reports in the All Inside Meniscal Repair System, consider subscribing to industry newsletters, following relevant companies and organizations, or regularly checking reputable industry news sources and publications.
Methodology
Step 1 - Identification of Relevant Samples Size from Population Database


Step 2 - Approaches for Defining Global Market Size (Value, Volume* & Price*)

Note*: In applicable scenarios
Step 3 - Data Sources
Primary Research
- Web Analytics
- Survey Reports
- Research Institute
- Latest Research Reports
- Opinion Leaders
Secondary Research
- Annual Reports
- White Paper
- Latest Press Release
- Industry Association
- Paid Database
- Investor Presentations

Step 4 - Data Triangulation
Involves using different sources of information in order to increase the validity of a study
These sources are likely to be stakeholders in a program - participants, other researchers, program staff, other community members, and so on.
Then we put all data in single framework & apply various statistical tools to find out the dynamic on the market.
During the analysis stage, feedback from the stakeholder groups would be compared to determine areas of agreement as well as areas of divergence
