

Key Insights
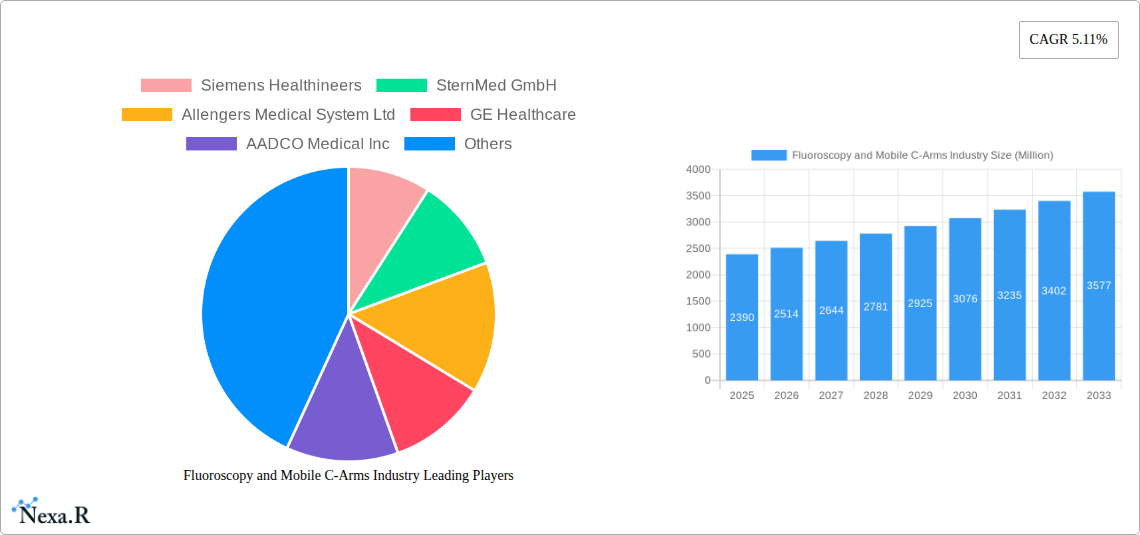
The Fluoroscopy and Mobile C-Arms market, valued at $2.39 billion in 2025, is projected to experience robust growth, driven by a compound annual growth rate (CAGR) of 5.11% from 2025 to 2033. This expansion is fueled by several key factors. The increasing prevalence of minimally invasive surgical procedures across various specialties, including cardiology, gastroenterology, and orthopedics, significantly boosts demand for fluoroscopy systems. Technological advancements, such as improved image quality, reduced radiation exposure, and enhanced portability of mobile C-arms, further contribute to market growth. Furthermore, the aging global population and rising incidence of chronic diseases necessitate more diagnostic and interventional procedures, creating a sustained demand for these imaging systems. The market is segmented by application (cardiology, gastroenterology, neurology, orthopedics and trauma, oncology, and other applications) and type (fixed and mobile C-arms). Mobile C-arms are gaining traction due to their flexibility and ease of use in various settings, including operating rooms and emergency departments. While regulatory hurdles and high initial investment costs might pose some challenges, the overall market outlook remains positive, with substantial growth opportunities in emerging economies and advancements in image-guided surgery.
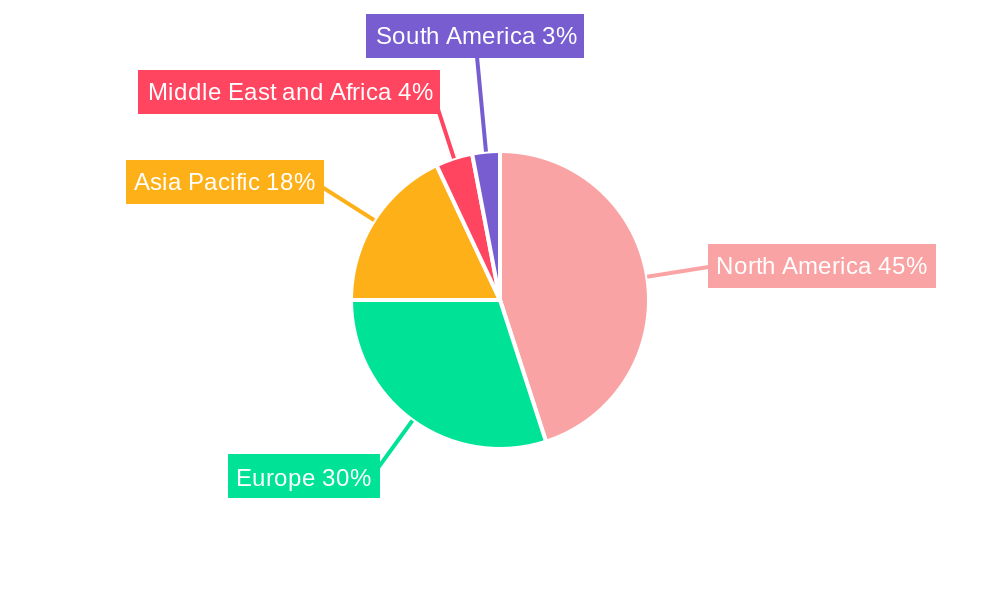
The geographical distribution of the market reveals significant regional variations. North America, particularly the United States, currently holds a substantial market share, attributed to advanced healthcare infrastructure, high adoption rates of advanced medical technologies, and robust funding for healthcare research and development. Europe follows as a significant market, with Germany and the United Kingdom as key contributors. The Asia-Pacific region, however, is expected to witness the fastest growth in the coming years, driven by increasing healthcare expenditure, rising disposable incomes, and expanding healthcare infrastructure in countries like China and India. Key players such as Siemens Healthineers, GE Healthcare, and others are actively engaged in strategic partnerships, product launches, and technological innovations to maintain their market positions and capitalize on emerging growth opportunities. The competitive landscape is characterized by both established players and emerging companies, leading to innovation and price competitiveness within the market.
Fluoroscopy and Mobile C-Arms Industry Market Report: 2019-2033
This comprehensive report provides an in-depth analysis of the Fluoroscopy and Mobile C-Arms industry, encompassing market dynamics, growth trends, regional insights, product landscape, and key players. With a focus on both fixed and mobile C-arms across diverse applications, this report offers invaluable intelligence for industry professionals, investors, and strategic decision-makers. The study period covers 2019-2033, with 2025 as the base year and a forecast period spanning 2025-2033. The market value is presented in million units.
Fluoroscopy and Mobile C-Arms Industry Market Dynamics & Structure
This section analyzes the competitive landscape, technological advancements, regulatory influences, and market trends within the Fluoroscopy and Mobile C-Arms industry. The market is moderately concentrated, with key players such as Siemens Healthineers, GE Healthcare, and Fujifilm holding significant shares. Technological innovation, driven by advancements in image processing, miniaturization, and AI integration, is a major driver. Regulatory frameworks, including FDA clearances and CE markings, play a crucial role in product adoption. Competitive substitutes include other medical imaging modalities like MRI and CT scans, while end-user demographics are influenced by the aging global population and increasing incidence of chronic diseases. M&A activity has been moderate, with xx deals recorded between 2019 and 2024, resulting in a xx% increase in market consolidation.
- Market Concentration: Moderately concentrated, with top 5 players holding xx% market share in 2024.
- Technological Innovation: Focus on improved image quality, reduced radiation exposure, and AI-powered diagnostic tools.
- Regulatory Landscape: Stringent FDA and CE approvals influence product launch timelines and market access.
- Competitive Substitutes: MRI, CT, and Ultrasound present alternative imaging solutions.
- M&A Activity: xx deals between 2019-2024, leading to xx% market consolidation.
- Innovation Barriers: High R&D costs, stringent regulatory pathways, and lengthy clinical trials.
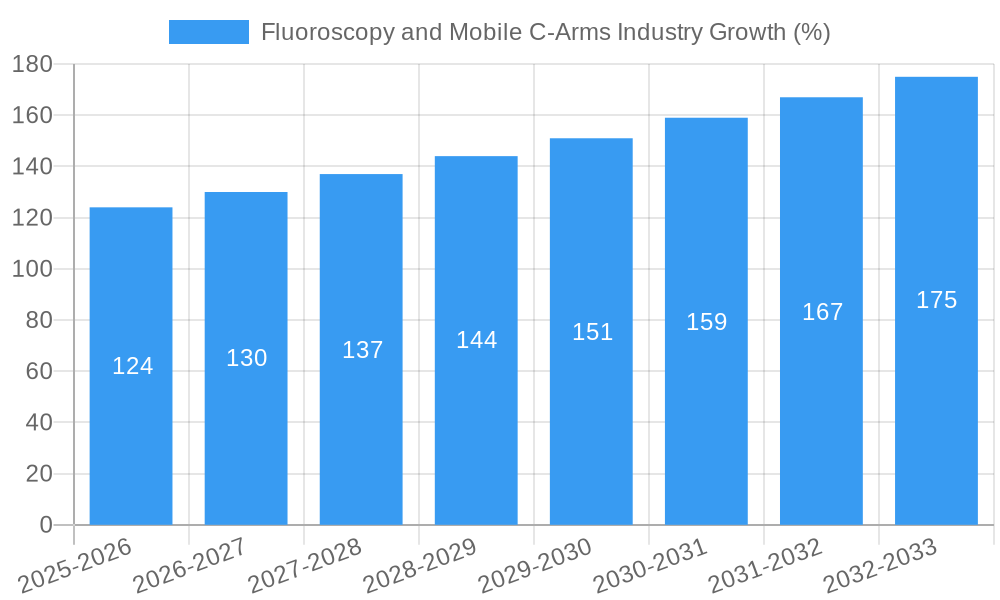
Fluoroscopy and Mobile C-Arms Industry Growth Trends & Insights
The Fluoroscopy and Mobile C-Arms market experienced a CAGR of xx% during 2019-2024, reaching a market value of xx million units in 2024. This growth is attributed to rising prevalence of cardiovascular diseases, increasing demand for minimally invasive surgeries, and technological advancements. The adoption rate of mobile C-arms, particularly in ambulatory surgical centers, is increasing at a CAGR of xx% due to their portability and cost-effectiveness. Technological disruptions, such as the integration of AI and advanced image processing techniques, are further driving market expansion. Consumer behavior shifts towards minimally invasive procedures and enhanced diagnostic capabilities are also contributing factors. The forecast period (2025-2033) projects a CAGR of xx%, driven by continued technological innovation and expanding applications. Market penetration is expected to increase by xx% by 2033.
Dominant Regions, Countries, or Segments in Fluoroscopy and Mobile C-Arms Industry
North America currently dominates the Fluoroscopy and Mobile C-Arms market, driven by high healthcare expenditure, advanced infrastructure, and strong regulatory support. Europe holds a significant market share, with Germany and France being key contributors. The Asia-Pacific region is experiencing rapid growth due to rising healthcare investments and an expanding middle class.
Leading Segments:
- Application: Orthopedics and Trauma segment leads in market share due to the high volume of procedures. Cardiology is also a significant contributor due to the wide application of fluoroscopy in interventional cardiology.
- Type: Mobile C-arms demonstrate faster growth than fixed C-arms, owing to their flexibility and suitability for various settings.
Key Drivers by Region:
- North America: High healthcare expenditure, advanced medical infrastructure, and strong regulatory support.
- Europe: Well-established healthcare systems, high adoption rates of advanced medical technologies.
- Asia-Pacific: Rapid economic growth, rising healthcare investments, and increasing prevalence of chronic diseases.
Fluoroscopy and Mobile C-Arms Industry Product Landscape
The Fluoroscopy and Mobile C-arms market offers a range of products, varying in size, features, and capabilities. Recent innovations focus on enhanced image quality, reduced radiation exposure, and improved ease of use. Mobile C-arms are increasingly incorporating advanced imaging technologies such as cone-beam CT and 3D imaging. Unique selling propositions include advanced image processing algorithms, intuitive user interfaces, and streamlined workflows. Technological advancements are focused on miniaturization, improved ergonomics, and integration with other medical devices.
Key Drivers, Barriers & Challenges in Fluoroscopy and Mobile C-Arms Industry
Key Drivers:
- Increasing prevalence of chronic diseases necessitating interventional procedures.
- Growing preference for minimally invasive surgeries.
- Technological advancements leading to better image quality and reduced radiation exposure.
- Rising healthcare expenditure and increasing investments in healthcare infrastructure.
Key Challenges:
- High initial investment cost of equipment.
- Stringent regulatory requirements and approvals.
- Competition from other imaging modalities.
- Potential supply chain disruptions impacting production and delivery timelines. This resulted in a xx% increase in lead times in 2022.
Emerging Opportunities in Fluoroscopy and Mobile C-Arms Industry
- Expanding applications in emerging markets.
- Development of AI-powered diagnostic tools.
- Integration with other medical devices and platforms.
- Growing demand for portable and mobile systems.
Growth Accelerators in the Fluoroscopy and Mobile C-Arms Industry Industry
Technological breakthroughs, such as the development of improved image processing algorithms and miniaturized components, are key growth accelerators. Strategic partnerships between manufacturers and healthcare providers facilitate product adoption and market expansion. Focus on developing cost-effective solutions will enhance accessibility and drive market penetration, particularly in emerging economies.
Key Players Shaping the Fluoroscopy and Mobile C-Arms Industry Market
- Siemens Healthineers
- SternMed GmbH
- Allengers Medical System Ltd
- GE Healthcare
- AADCO Medical Inc
- FUJIFILM Holdings Corporation
- Ziehm Imaging GmbH
- BPL Medical Technologies
- Koninklijke Philips NV
- Canon Medical Systems Corporation
- Hologic Corporation
- Shimadzu Corporation
Notable Milestones in Fluoroscopy and Mobile C-Arms Industry Sector
- July 2022: Siemens Healthineers receives FDA clearance for the Artis icono Ceiling Angiography system.
- July 2022: Fujifilm launches the FDR Cross hybrid C-arm and portable x-ray solution.
In-Depth Fluoroscopy and Mobile C-Arms Industry Market Outlook
The Fluoroscopy and Mobile C-Arms market is poised for significant growth in the coming years, driven by continued technological advancements, expanding applications, and increasing demand for minimally invasive procedures. Strategic partnerships, focused R&D efforts, and expansion into new markets present substantial opportunities for industry players. The market is expected to witness a paradigm shift towards AI-powered systems and improved workflow efficiency.
Fluoroscopy and Mobile C-Arms Industry Segmentation
-
1. Type
- 1.1. Fixed C-arms
-
1.2. Mobile C-arms
- 1.2.1. Full-size C-arms
- 1.2.2. Mini C-arms
-
2. Application
- 2.1. Cardiology
- 2.2. Gastroenterology
- 2.3. Neurology
- 2.4. Orthopedics and Trauma
- 2.5. Oncology
- 2.6. Other Applications
Fluoroscopy and Mobile C-Arms Industry Segmentation By Geography
-
1. North America
- 1.1. United States
- 1.2. Canada
- 1.3. Mexico
-
2. Europe
- 2.1. Germany
- 2.2. United Kingdom
- 2.3. France
- 2.4. Italy
- 2.5. Spain
- 2.6. Rest of Europe
-
3. Asia Pacific
- 3.1. China
- 3.2. Japan
- 3.3. India
- 3.4. Australia
- 3.5. South Korea
- 3.6. Rest of Asia Pacific
-
4. Middle East and Africa
- 4.1. GCC
- 4.2. South Africa
- 4.3. Rest of Middle East and Africa
-
5. South America
- 5.1. Brazil
- 5.2. Argentina
- 5.3. Rest of South America
Fluoroscopy and Mobile C-Arms Industry REPORT HIGHLIGHTS
| Aspects | Details |
|---|---|
| Study Period | 2019-2033 |
| Base Year | 2024 |
| Estimated Year | 2025 |
| Forecast Period | 2025-2033 |
| Historical Period | 2019-2024 |
| Growth Rate | CAGR of 5.11% from 2019-2033 |
| Segmentation |
|
Table of Contents
- 1. Introduction
- 1.1. Research Scope
- 1.2. Market Segmentation
- 1.3. Research Methodology
- 1.4. Definitions and Assumptions
- 2. Executive Summary
- 2.1. Introduction
- 3. Market Dynamics
- 3.1. Introduction
- 3.2. Market Drivers
- 3.2.1. Rising Geriatric Population and Increasing Incidence of Chronic Diseases; Advancements in Maneuverability and Imaging Capabilities; Rising Demand in Emerging Economies for Imaging Technologies
- 3.3. Market Restrains
- 3.3.1. High Procedural and Equipment Costs; Growing Use of Refurbished Devices
- 3.4. Market Trends
- 3.4.1. Mini C-arm Segment is Expected to Show Better Growth During the Forecast Period
- 4. Market Factor Analysis
- 4.1. Porters Five Forces
- 4.2. Supply/Value Chain
- 4.3. PESTEL analysis
- 4.4. Market Entropy
- 4.5. Patent/Trademark Analysis
- 5. Global Fluoroscopy and Mobile C-Arms Industry Analysis, Insights and Forecast, 2019-2031
- 5.1. Market Analysis, Insights and Forecast - by Type
- 5.1.1. Fixed C-arms
- 5.1.2. Mobile C-arms
- 5.1.2.1. Full-size C-arms
- 5.1.2.2. Mini C-arms
- 5.2. Market Analysis, Insights and Forecast - by Application
- 5.2.1. Cardiology
- 5.2.2. Gastroenterology
- 5.2.3. Neurology
- 5.2.4. Orthopedics and Trauma
- 5.2.5. Oncology
- 5.2.6. Other Applications
- 5.3. Market Analysis, Insights and Forecast - by Region
- 5.3.1. North America
- 5.3.2. Europe
- 5.3.3. Asia Pacific
- 5.3.4. Middle East and Africa
- 5.3.5. South America
- 5.1. Market Analysis, Insights and Forecast - by Type
- 6. North America Fluoroscopy and Mobile C-Arms Industry Analysis, Insights and Forecast, 2019-2031
- 6.1. Market Analysis, Insights and Forecast - by Type
- 6.1.1. Fixed C-arms
- 6.1.2. Mobile C-arms
- 6.1.2.1. Full-size C-arms
- 6.1.2.2. Mini C-arms
- 6.2. Market Analysis, Insights and Forecast - by Application
- 6.2.1. Cardiology
- 6.2.2. Gastroenterology
- 6.2.3. Neurology
- 6.2.4. Orthopedics and Trauma
- 6.2.5. Oncology
- 6.2.6. Other Applications
- 6.1. Market Analysis, Insights and Forecast - by Type
- 7. Europe Fluoroscopy and Mobile C-Arms Industry Analysis, Insights and Forecast, 2019-2031
- 7.1. Market Analysis, Insights and Forecast - by Type
- 7.1.1. Fixed C-arms
- 7.1.2. Mobile C-arms
- 7.1.2.1. Full-size C-arms
- 7.1.2.2. Mini C-arms
- 7.2. Market Analysis, Insights and Forecast - by Application
- 7.2.1. Cardiology
- 7.2.2. Gastroenterology
- 7.2.3. Neurology
- 7.2.4. Orthopedics and Trauma
- 7.2.5. Oncology
- 7.2.6. Other Applications
- 7.1. Market Analysis, Insights and Forecast - by Type
- 8. Asia Pacific Fluoroscopy and Mobile C-Arms Industry Analysis, Insights and Forecast, 2019-2031
- 8.1. Market Analysis, Insights and Forecast - by Type
- 8.1.1. Fixed C-arms
- 8.1.2. Mobile C-arms
- 8.1.2.1. Full-size C-arms
- 8.1.2.2. Mini C-arms
- 8.2. Market Analysis, Insights and Forecast - by Application
- 8.2.1. Cardiology
- 8.2.2. Gastroenterology
- 8.2.3. Neurology
- 8.2.4. Orthopedics and Trauma
- 8.2.5. Oncology
- 8.2.6. Other Applications
- 8.1. Market Analysis, Insights and Forecast - by Type
- 9. Middle East and Africa Fluoroscopy and Mobile C-Arms Industry Analysis, Insights and Forecast, 2019-2031
- 9.1. Market Analysis, Insights and Forecast - by Type
- 9.1.1. Fixed C-arms
- 9.1.2. Mobile C-arms
- 9.1.2.1. Full-size C-arms
- 9.1.2.2. Mini C-arms
- 9.2. Market Analysis, Insights and Forecast - by Application
- 9.2.1. Cardiology
- 9.2.2. Gastroenterology
- 9.2.3. Neurology
- 9.2.4. Orthopedics and Trauma
- 9.2.5. Oncology
- 9.2.6. Other Applications
- 9.1. Market Analysis, Insights and Forecast - by Type
- 10. South America Fluoroscopy and Mobile C-Arms Industry Analysis, Insights and Forecast, 2019-2031
- 10.1. Market Analysis, Insights and Forecast - by Type
- 10.1.1. Fixed C-arms
- 10.1.2. Mobile C-arms
- 10.1.2.1. Full-size C-arms
- 10.1.2.2. Mini C-arms
- 10.2. Market Analysis, Insights and Forecast - by Application
- 10.2.1. Cardiology
- 10.2.2. Gastroenterology
- 10.2.3. Neurology
- 10.2.4. Orthopedics and Trauma
- 10.2.5. Oncology
- 10.2.6. Other Applications
- 10.1. Market Analysis, Insights and Forecast - by Type
- 11. North America Fluoroscopy and Mobile C-Arms Industry Analysis, Insights and Forecast, 2019-2031
- 11.1. Market Analysis, Insights and Forecast - By Country/Sub-region
- 11.1.1 United States
- 11.1.2 Canada
- 11.1.3 Mexico
- 12. Europe Fluoroscopy and Mobile C-Arms Industry Analysis, Insights and Forecast, 2019-2031
- 12.1. Market Analysis, Insights and Forecast - By Country/Sub-region
- 12.1.1 Germany
- 12.1.2 United Kingdom
- 12.1.3 France
- 12.1.4 Italy
- 12.1.5 Spain
- 12.1.6 Rest of Europe
- 13. Asia Pacific Fluoroscopy and Mobile C-Arms Industry Analysis, Insights and Forecast, 2019-2031
- 13.1. Market Analysis, Insights and Forecast - By Country/Sub-region
- 13.1.1 China
- 13.1.2 Japan
- 13.1.3 India
- 13.1.4 Australia
- 13.1.5 South Korea
- 13.1.6 Rest of Asia Pacific
- 14. Middle East and Africa Fluoroscopy and Mobile C-Arms Industry Analysis, Insights and Forecast, 2019-2031
- 14.1. Market Analysis, Insights and Forecast - By Country/Sub-region
- 14.1.1 GCC
- 14.1.2 South Africa
- 14.1.3 Rest of Middle East and Africa
- 15. South America Fluoroscopy and Mobile C-Arms Industry Analysis, Insights and Forecast, 2019-2031
- 15.1. Market Analysis, Insights and Forecast - By Country/Sub-region
- 15.1.1 Brazil
- 15.1.2 Argentina
- 15.1.3 Rest of South America
- 16. Competitive Analysis
- 16.1. Global Market Share Analysis 2024
- 16.2. Company Profiles
- 16.2.1 Siemens Healthineers
- 16.2.1.1. Overview
- 16.2.1.2. Products
- 16.2.1.3. SWOT Analysis
- 16.2.1.4. Recent Developments
- 16.2.1.5. Financials (Based on Availability)
- 16.2.2 SternMed GmbH
- 16.2.2.1. Overview
- 16.2.2.2. Products
- 16.2.2.3. SWOT Analysis
- 16.2.2.4. Recent Developments
- 16.2.2.5. Financials (Based on Availability)
- 16.2.3 Allengers Medical System Ltd
- 16.2.3.1. Overview
- 16.2.3.2. Products
- 16.2.3.3. SWOT Analysis
- 16.2.3.4. Recent Developments
- 16.2.3.5. Financials (Based on Availability)
- 16.2.4 GE Healthcare
- 16.2.4.1. Overview
- 16.2.4.2. Products
- 16.2.4.3. SWOT Analysis
- 16.2.4.4. Recent Developments
- 16.2.4.5. Financials (Based on Availability)
- 16.2.5 AADCO Medical Inc
- 16.2.5.1. Overview
- 16.2.5.2. Products
- 16.2.5.3. SWOT Analysis
- 16.2.5.4. Recent Developments
- 16.2.5.5. Financials (Based on Availability)
- 16.2.6 FUJIFILM Holdings Corporation
- 16.2.6.1. Overview
- 16.2.6.2. Products
- 16.2.6.3. SWOT Analysis
- 16.2.6.4. Recent Developments
- 16.2.6.5. Financials (Based on Availability)
- 16.2.7 Ziehm Imaging GmbH
- 16.2.7.1. Overview
- 16.2.7.2. Products
- 16.2.7.3. SWOT Analysis
- 16.2.7.4. Recent Developments
- 16.2.7.5. Financials (Based on Availability)
- 16.2.8 BPL Medical Technologies
- 16.2.8.1. Overview
- 16.2.8.2. Products
- 16.2.8.3. SWOT Analysis
- 16.2.8.4. Recent Developments
- 16.2.8.5. Financials (Based on Availability)
- 16.2.9 Koninklijke Philips NV
- 16.2.9.1. Overview
- 16.2.9.2. Products
- 16.2.9.3. SWOT Analysis
- 16.2.9.4. Recent Developments
- 16.2.9.5. Financials (Based on Availability)
- 16.2.10 Canon Medical Systems Corporation
- 16.2.10.1. Overview
- 16.2.10.2. Products
- 16.2.10.3. SWOT Analysis
- 16.2.10.4. Recent Developments
- 16.2.10.5. Financials (Based on Availability)
- 16.2.11 Hologic Corporation
- 16.2.11.1. Overview
- 16.2.11.2. Products
- 16.2.11.3. SWOT Analysis
- 16.2.11.4. Recent Developments
- 16.2.11.5. Financials (Based on Availability)
- 16.2.12 Shimadzu Corporation
- 16.2.12.1. Overview
- 16.2.12.2. Products
- 16.2.12.3. SWOT Analysis
- 16.2.12.4. Recent Developments
- 16.2.12.5. Financials (Based on Availability)
- 16.2.1 Siemens Healthineers
List of Figures
- Figure 1: Global Fluoroscopy and Mobile C-Arms Industry Revenue Breakdown (Million, %) by Region 2024 & 2032
- Figure 2: North America Fluoroscopy and Mobile C-Arms Industry Revenue (Million), by Country 2024 & 2032
- Figure 3: North America Fluoroscopy and Mobile C-Arms Industry Revenue Share (%), by Country 2024 & 2032
- Figure 4: Europe Fluoroscopy and Mobile C-Arms Industry Revenue (Million), by Country 2024 & 2032
- Figure 5: Europe Fluoroscopy and Mobile C-Arms Industry Revenue Share (%), by Country 2024 & 2032
- Figure 6: Asia Pacific Fluoroscopy and Mobile C-Arms Industry Revenue (Million), by Country 2024 & 2032
- Figure 7: Asia Pacific Fluoroscopy and Mobile C-Arms Industry Revenue Share (%), by Country 2024 & 2032
- Figure 8: Middle East and Africa Fluoroscopy and Mobile C-Arms Industry Revenue (Million), by Country 2024 & 2032
- Figure 9: Middle East and Africa Fluoroscopy and Mobile C-Arms Industry Revenue Share (%), by Country 2024 & 2032
- Figure 10: South America Fluoroscopy and Mobile C-Arms Industry Revenue (Million), by Country 2024 & 2032
- Figure 11: South America Fluoroscopy and Mobile C-Arms Industry Revenue Share (%), by Country 2024 & 2032
- Figure 12: North America Fluoroscopy and Mobile C-Arms Industry Revenue (Million), by Type 2024 & 2032
- Figure 13: North America Fluoroscopy and Mobile C-Arms Industry Revenue Share (%), by Type 2024 & 2032
- Figure 14: North America Fluoroscopy and Mobile C-Arms Industry Revenue (Million), by Application 2024 & 2032
- Figure 15: North America Fluoroscopy and Mobile C-Arms Industry Revenue Share (%), by Application 2024 & 2032
- Figure 16: North America Fluoroscopy and Mobile C-Arms Industry Revenue (Million), by Country 2024 & 2032
- Figure 17: North America Fluoroscopy and Mobile C-Arms Industry Revenue Share (%), by Country 2024 & 2032
- Figure 18: Europe Fluoroscopy and Mobile C-Arms Industry Revenue (Million), by Type 2024 & 2032
- Figure 19: Europe Fluoroscopy and Mobile C-Arms Industry Revenue Share (%), by Type 2024 & 2032
- Figure 20: Europe Fluoroscopy and Mobile C-Arms Industry Revenue (Million), by Application 2024 & 2032
- Figure 21: Europe Fluoroscopy and Mobile C-Arms Industry Revenue Share (%), by Application 2024 & 2032
- Figure 22: Europe Fluoroscopy and Mobile C-Arms Industry Revenue (Million), by Country 2024 & 2032
- Figure 23: Europe Fluoroscopy and Mobile C-Arms Industry Revenue Share (%), by Country 2024 & 2032
- Figure 24: Asia Pacific Fluoroscopy and Mobile C-Arms Industry Revenue (Million), by Type 2024 & 2032
- Figure 25: Asia Pacific Fluoroscopy and Mobile C-Arms Industry Revenue Share (%), by Type 2024 & 2032
- Figure 26: Asia Pacific Fluoroscopy and Mobile C-Arms Industry Revenue (Million), by Application 2024 & 2032
- Figure 27: Asia Pacific Fluoroscopy and Mobile C-Arms Industry Revenue Share (%), by Application 2024 & 2032
- Figure 28: Asia Pacific Fluoroscopy and Mobile C-Arms Industry Revenue (Million), by Country 2024 & 2032
- Figure 29: Asia Pacific Fluoroscopy and Mobile C-Arms Industry Revenue Share (%), by Country 2024 & 2032
- Figure 30: Middle East and Africa Fluoroscopy and Mobile C-Arms Industry Revenue (Million), by Type 2024 & 2032
- Figure 31: Middle East and Africa Fluoroscopy and Mobile C-Arms Industry Revenue Share (%), by Type 2024 & 2032
- Figure 32: Middle East and Africa Fluoroscopy and Mobile C-Arms Industry Revenue (Million), by Application 2024 & 2032
- Figure 33: Middle East and Africa Fluoroscopy and Mobile C-Arms Industry Revenue Share (%), by Application 2024 & 2032
- Figure 34: Middle East and Africa Fluoroscopy and Mobile C-Arms Industry Revenue (Million), by Country 2024 & 2032
- Figure 35: Middle East and Africa Fluoroscopy and Mobile C-Arms Industry Revenue Share (%), by Country 2024 & 2032
- Figure 36: South America Fluoroscopy and Mobile C-Arms Industry Revenue (Million), by Type 2024 & 2032
- Figure 37: South America Fluoroscopy and Mobile C-Arms Industry Revenue Share (%), by Type 2024 & 2032
- Figure 38: South America Fluoroscopy and Mobile C-Arms Industry Revenue (Million), by Application 2024 & 2032
- Figure 39: South America Fluoroscopy and Mobile C-Arms Industry Revenue Share (%), by Application 2024 & 2032
- Figure 40: South America Fluoroscopy and Mobile C-Arms Industry Revenue (Million), by Country 2024 & 2032
- Figure 41: South America Fluoroscopy and Mobile C-Arms Industry Revenue Share (%), by Country 2024 & 2032
List of Tables
- Table 1: Global Fluoroscopy and Mobile C-Arms Industry Revenue Million Forecast, by Region 2019 & 2032
- Table 2: Global Fluoroscopy and Mobile C-Arms Industry Revenue Million Forecast, by Type 2019 & 2032
- Table 3: Global Fluoroscopy and Mobile C-Arms Industry Revenue Million Forecast, by Application 2019 & 2032
- Table 4: Global Fluoroscopy and Mobile C-Arms Industry Revenue Million Forecast, by Region 2019 & 2032
- Table 5: Global Fluoroscopy and Mobile C-Arms Industry Revenue Million Forecast, by Country 2019 & 2032
- Table 6: United States Fluoroscopy and Mobile C-Arms Industry Revenue (Million) Forecast, by Application 2019 & 2032
- Table 7: Canada Fluoroscopy and Mobile C-Arms Industry Revenue (Million) Forecast, by Application 2019 & 2032
- Table 8: Mexico Fluoroscopy and Mobile C-Arms Industry Revenue (Million) Forecast, by Application 2019 & 2032
- Table 9: Global Fluoroscopy and Mobile C-Arms Industry Revenue Million Forecast, by Country 2019 & 2032
- Table 10: Germany Fluoroscopy and Mobile C-Arms Industry Revenue (Million) Forecast, by Application 2019 & 2032
- Table 11: United Kingdom Fluoroscopy and Mobile C-Arms Industry Revenue (Million) Forecast, by Application 2019 & 2032
- Table 12: France Fluoroscopy and Mobile C-Arms Industry Revenue (Million) Forecast, by Application 2019 & 2032
- Table 13: Italy Fluoroscopy and Mobile C-Arms Industry Revenue (Million) Forecast, by Application 2019 & 2032
- Table 14: Spain Fluoroscopy and Mobile C-Arms Industry Revenue (Million) Forecast, by Application 2019 & 2032
- Table 15: Rest of Europe Fluoroscopy and Mobile C-Arms Industry Revenue (Million) Forecast, by Application 2019 & 2032
- Table 16: Global Fluoroscopy and Mobile C-Arms Industry Revenue Million Forecast, by Country 2019 & 2032
- Table 17: China Fluoroscopy and Mobile C-Arms Industry Revenue (Million) Forecast, by Application 2019 & 2032
- Table 18: Japan Fluoroscopy and Mobile C-Arms Industry Revenue (Million) Forecast, by Application 2019 & 2032
- Table 19: India Fluoroscopy and Mobile C-Arms Industry Revenue (Million) Forecast, by Application 2019 & 2032
- Table 20: Australia Fluoroscopy and Mobile C-Arms Industry Revenue (Million) Forecast, by Application 2019 & 2032
- Table 21: South Korea Fluoroscopy and Mobile C-Arms Industry Revenue (Million) Forecast, by Application 2019 & 2032
- Table 22: Rest of Asia Pacific Fluoroscopy and Mobile C-Arms Industry Revenue (Million) Forecast, by Application 2019 & 2032
- Table 23: Global Fluoroscopy and Mobile C-Arms Industry Revenue Million Forecast, by Country 2019 & 2032
- Table 24: GCC Fluoroscopy and Mobile C-Arms Industry Revenue (Million) Forecast, by Application 2019 & 2032
- Table 25: South Africa Fluoroscopy and Mobile C-Arms Industry Revenue (Million) Forecast, by Application 2019 & 2032
- Table 26: Rest of Middle East and Africa Fluoroscopy and Mobile C-Arms Industry Revenue (Million) Forecast, by Application 2019 & 2032
- Table 27: Global Fluoroscopy and Mobile C-Arms Industry Revenue Million Forecast, by Country 2019 & 2032
- Table 28: Brazil Fluoroscopy and Mobile C-Arms Industry Revenue (Million) Forecast, by Application 2019 & 2032
- Table 29: Argentina Fluoroscopy and Mobile C-Arms Industry Revenue (Million) Forecast, by Application 2019 & 2032
- Table 30: Rest of South America Fluoroscopy and Mobile C-Arms Industry Revenue (Million) Forecast, by Application 2019 & 2032
- Table 31: Global Fluoroscopy and Mobile C-Arms Industry Revenue Million Forecast, by Type 2019 & 2032
- Table 32: Global Fluoroscopy and Mobile C-Arms Industry Revenue Million Forecast, by Application 2019 & 2032
- Table 33: Global Fluoroscopy and Mobile C-Arms Industry Revenue Million Forecast, by Country 2019 & 2032
- Table 34: United States Fluoroscopy and Mobile C-Arms Industry Revenue (Million) Forecast, by Application 2019 & 2032
- Table 35: Canada Fluoroscopy and Mobile C-Arms Industry Revenue (Million) Forecast, by Application 2019 & 2032
- Table 36: Mexico Fluoroscopy and Mobile C-Arms Industry Revenue (Million) Forecast, by Application 2019 & 2032
- Table 37: Global Fluoroscopy and Mobile C-Arms Industry Revenue Million Forecast, by Type 2019 & 2032
- Table 38: Global Fluoroscopy and Mobile C-Arms Industry Revenue Million Forecast, by Application 2019 & 2032
- Table 39: Global Fluoroscopy and Mobile C-Arms Industry Revenue Million Forecast, by Country 2019 & 2032
- Table 40: Germany Fluoroscopy and Mobile C-Arms Industry Revenue (Million) Forecast, by Application 2019 & 2032
- Table 41: United Kingdom Fluoroscopy and Mobile C-Arms Industry Revenue (Million) Forecast, by Application 2019 & 2032
- Table 42: France Fluoroscopy and Mobile C-Arms Industry Revenue (Million) Forecast, by Application 2019 & 2032
- Table 43: Italy Fluoroscopy and Mobile C-Arms Industry Revenue (Million) Forecast, by Application 2019 & 2032
- Table 44: Spain Fluoroscopy and Mobile C-Arms Industry Revenue (Million) Forecast, by Application 2019 & 2032
- Table 45: Rest of Europe Fluoroscopy and Mobile C-Arms Industry Revenue (Million) Forecast, by Application 2019 & 2032
- Table 46: Global Fluoroscopy and Mobile C-Arms Industry Revenue Million Forecast, by Type 2019 & 2032
- Table 47: Global Fluoroscopy and Mobile C-Arms Industry Revenue Million Forecast, by Application 2019 & 2032
- Table 48: Global Fluoroscopy and Mobile C-Arms Industry Revenue Million Forecast, by Country 2019 & 2032
- Table 49: China Fluoroscopy and Mobile C-Arms Industry Revenue (Million) Forecast, by Application 2019 & 2032
- Table 50: Japan Fluoroscopy and Mobile C-Arms Industry Revenue (Million) Forecast, by Application 2019 & 2032
- Table 51: India Fluoroscopy and Mobile C-Arms Industry Revenue (Million) Forecast, by Application 2019 & 2032
- Table 52: Australia Fluoroscopy and Mobile C-Arms Industry Revenue (Million) Forecast, by Application 2019 & 2032
- Table 53: South Korea Fluoroscopy and Mobile C-Arms Industry Revenue (Million) Forecast, by Application 2019 & 2032
- Table 54: Rest of Asia Pacific Fluoroscopy and Mobile C-Arms Industry Revenue (Million) Forecast, by Application 2019 & 2032
- Table 55: Global Fluoroscopy and Mobile C-Arms Industry Revenue Million Forecast, by Type 2019 & 2032
- Table 56: Global Fluoroscopy and Mobile C-Arms Industry Revenue Million Forecast, by Application 2019 & 2032
- Table 57: Global Fluoroscopy and Mobile C-Arms Industry Revenue Million Forecast, by Country 2019 & 2032
- Table 58: GCC Fluoroscopy and Mobile C-Arms Industry Revenue (Million) Forecast, by Application 2019 & 2032
- Table 59: South Africa Fluoroscopy and Mobile C-Arms Industry Revenue (Million) Forecast, by Application 2019 & 2032
- Table 60: Rest of Middle East and Africa Fluoroscopy and Mobile C-Arms Industry Revenue (Million) Forecast, by Application 2019 & 2032
- Table 61: Global Fluoroscopy and Mobile C-Arms Industry Revenue Million Forecast, by Type 2019 & 2032
- Table 62: Global Fluoroscopy and Mobile C-Arms Industry Revenue Million Forecast, by Application 2019 & 2032
- Table 63: Global Fluoroscopy and Mobile C-Arms Industry Revenue Million Forecast, by Country 2019 & 2032
- Table 64: Brazil Fluoroscopy and Mobile C-Arms Industry Revenue (Million) Forecast, by Application 2019 & 2032
- Table 65: Argentina Fluoroscopy and Mobile C-Arms Industry Revenue (Million) Forecast, by Application 2019 & 2032
- Table 66: Rest of South America Fluoroscopy and Mobile C-Arms Industry Revenue (Million) Forecast, by Application 2019 & 2032
Frequently Asked Questions
1. What is the projected Compound Annual Growth Rate (CAGR) of the Fluoroscopy and Mobile C-Arms Industry?
The projected CAGR is approximately 5.11%.
2. Which companies are prominent players in the Fluoroscopy and Mobile C-Arms Industry?
Key companies in the market include Siemens Healthineers, SternMed GmbH, Allengers Medical System Ltd, GE Healthcare, AADCO Medical Inc, FUJIFILM Holdings Corporation, Ziehm Imaging GmbH, BPL Medical Technologies, Koninklijke Philips NV, Canon Medical Systems Corporation, Hologic Corporation, Shimadzu Corporation.
3. What are the main segments of the Fluoroscopy and Mobile C-Arms Industry?
The market segments include Type, Application.
4. Can you provide details about the market size?
The market size is estimated to be USD 2.39 Million as of 2022.
5. What are some drivers contributing to market growth?
Rising Geriatric Population and Increasing Incidence of Chronic Diseases; Advancements in Maneuverability and Imaging Capabilities; Rising Demand in Emerging Economies for Imaging Technologies.
6. What are the notable trends driving market growth?
Mini C-arm Segment is Expected to Show Better Growth During the Forecast Period.
7. Are there any restraints impacting market growth?
High Procedural and Equipment Costs; Growing Use of Refurbished Devices.
8. Can you provide examples of recent developments in the market?
In July 2022, Siemens Healthineers stated that it has received FDA clearance for the Artis icono Ceiling Angiography system. The ARTIS icono ceiling combines design flexibility with advanced positioning accuracy and intelligent workflows. The new rotational capabilities and simplified cabling of its C-arm permit cone beam CT data acquisitions.
9. What pricing options are available for accessing the report?
Pricing options include single-user, multi-user, and enterprise licenses priced at USD 4750, USD 5250, and USD 8750 respectively.
10. Is the market size provided in terms of value or volume?
The market size is provided in terms of value, measured in Million.
11. Are there any specific market keywords associated with the report?
Yes, the market keyword associated with the report is "Fluoroscopy and Mobile C-Arms Industry," which aids in identifying and referencing the specific market segment covered.
12. How do I determine which pricing option suits my needs best?
The pricing options vary based on user requirements and access needs. Individual users may opt for single-user licenses, while businesses requiring broader access may choose multi-user or enterprise licenses for cost-effective access to the report.
13. Are there any additional resources or data provided in the Fluoroscopy and Mobile C-Arms Industry report?
While the report offers comprehensive insights, it's advisable to review the specific contents or supplementary materials provided to ascertain if additional resources or data are available.
14. How can I stay updated on further developments or reports in the Fluoroscopy and Mobile C-Arms Industry?
To stay informed about further developments, trends, and reports in the Fluoroscopy and Mobile C-Arms Industry, consider subscribing to industry newsletters, following relevant companies and organizations, or regularly checking reputable industry news sources and publications.
Methodology
Step 1 - Identification of Relevant Samples Size from Population Database


Step 2 - Approaches for Defining Global Market Size (Value, Volume* & Price*)

Note*: In applicable scenarios
Step 3 - Data Sources
Primary Research
- Web Analytics
- Survey Reports
- Research Institute
- Latest Research Reports
- Opinion Leaders
Secondary Research
- Annual Reports
- White Paper
- Latest Press Release
- Industry Association
- Paid Database
- Investor Presentations

Step 4 - Data Triangulation
Involves using different sources of information in order to increase the validity of a study
These sources are likely to be stakeholders in a program - participants, other researchers, program staff, other community members, and so on.
Then we put all data in single framework & apply various statistical tools to find out the dynamic on the market.
During the analysis stage, feedback from the stakeholder groups would be compared to determine areas of agreement as well as areas of divergence
