

Key Insights
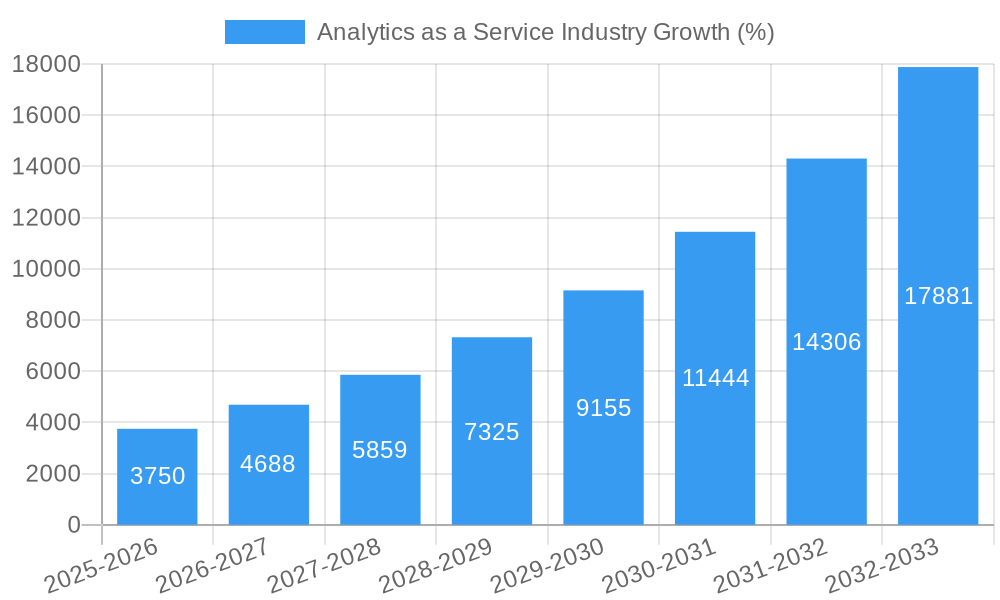
The Analytics as a Service (AaaS) market is experiencing robust growth, fueled by the increasing adoption of cloud computing, big data analytics, and the need for real-time business insights across various industries. The market's Compound Annual Growth Rate (CAGR) of 25% from 2019-2033 indicates a significant expansion, driven by factors such as the rising volume of data generated by businesses, the need for enhanced decision-making capabilities, and the cost-effectiveness of cloud-based analytics solutions. Key industry drivers include the growing demand for predictive analytics, improved data visualization tools, and the increasing adoption of AI and machine learning in analytics platforms. The market is segmented by enterprise size (SMEs and large enterprises) and end-user industry (IT & Telecommunications, Energy & Power, BFSI, Healthcare, Retail, Manufacturing, and Others). Large enterprises, with their substantial data volumes and complex analytical needs, are major contributors to market growth. The IT and Telecommunications sector leads in AaaS adoption due to its inherent reliance on data-driven decision-making and technological advancements. However, the market also faces restraints such as data security and privacy concerns, integration complexities with existing systems, and the need for skilled professionals to manage and interpret the analytical outputs.
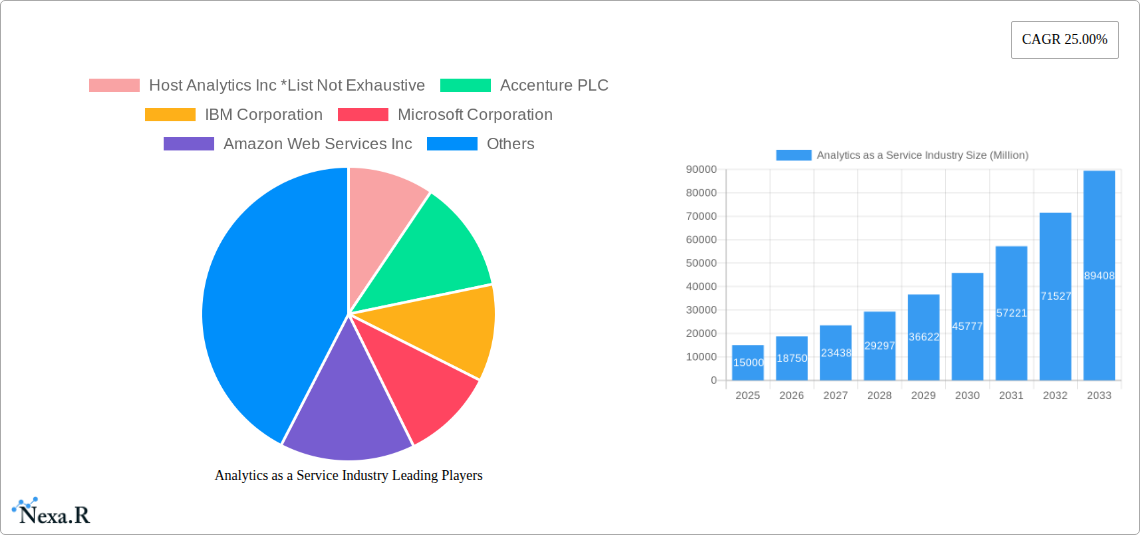
Despite these challenges, the long-term outlook for the AaaS market remains positive. The continued expansion of cloud infrastructure, the development of more sophisticated analytics tools, and the increasing digital transformation efforts across various industries will drive further growth. The geographic distribution of the market shows strong presence in North America and Europe, with Asia-Pacific emerging as a rapidly growing region. Companies like Host Analytics, Accenture, IBM, Microsoft, AWS, and others are key players in this competitive landscape, constantly innovating and expanding their offerings to meet the evolving needs of businesses. The forecast period (2025-2033) will likely see continued market consolidation and the emergence of new specialized AaaS providers catering to niche industry requirements. The increasing adoption of AI-powered analytics and the development of advanced analytical capabilities will be defining trends shaping the future of the AaaS market.
Analytics as a Service (AaaS) Industry Market Report: 2019-2033
This comprehensive report provides an in-depth analysis of the Analytics as a Service (AaaS) industry, encompassing market dynamics, growth trends, regional dominance, product landscapes, key players, and future outlooks. The report covers the period from 2019 to 2033, with a focus on the estimated year 2025 and a forecast period of 2025-2033. The parent market is the broader Business Analytics market, and the child market is specifically AaaS. This report is crucial for businesses, investors, and industry professionals seeking a clear understanding of this rapidly evolving sector. The total market size in 2025 is estimated at $XX Billion.
Analytics as a Service Industry Market Dynamics & Structure
The AaaS market exhibits a moderately concentrated structure, with a few major players holding significant market share, while a multitude of smaller niche providers also compete. Technological innovation, particularly in areas like Artificial Intelligence (AI), Machine Learning (ML), and Big Data analytics, is a key driver of market growth. Regulatory frameworks concerning data privacy (GDPR, CCPA) influence market practices and adoption rates. The market faces competition from on-premise analytics solutions, but the ease of use and scalability of AaaS are driving adoption. The end-user demographics are diverse, with increasing adoption across various sectors. Mergers and Acquisitions (M&A) activity has been moderate, with larger players acquiring smaller firms to expand their service offerings and technological capabilities.
- Market Concentration: Top 5 players hold approximately XX% of the market share in 2025.
- Technological Innovation: AI, ML, and Big Data analytics are driving service enhancements and new offerings.
- Regulatory Frameworks: GDPR and CCPA compliance are shaping data handling and security practices.
- M&A Activity: An estimated XX M&A deals occurred in the historical period (2019-2024).
- Innovation Barriers: High initial investment costs and skilled personnel requirements can hinder smaller players.
Analytics as a Service Industry Growth Trends & Insights
The AaaS market experienced significant growth during the historical period (2019-2024), with a CAGR of XX%. This growth is fueled by rising demand for data-driven decision-making across industries, the increasing adoption of cloud computing, and the decreasing cost of AaaS solutions. Technological disruptions such as the emergence of serverless computing and edge analytics are further accelerating market expansion. Consumer behavior is shifting towards cloud-based solutions, prioritizing convenience, scalability, and cost-effectiveness. Market penetration is expected to reach XX% by 2033. The total market size is expected to reach $XX Billion by 2033.
- CAGR (2019-2024): XX%
- Market Size (2025): $XX Billion
- Projected Market Size (2033): $XX Billion
- Market Penetration (2033): XX%
Dominant Regions, Countries, or Segments in Analytics as a Service Industry
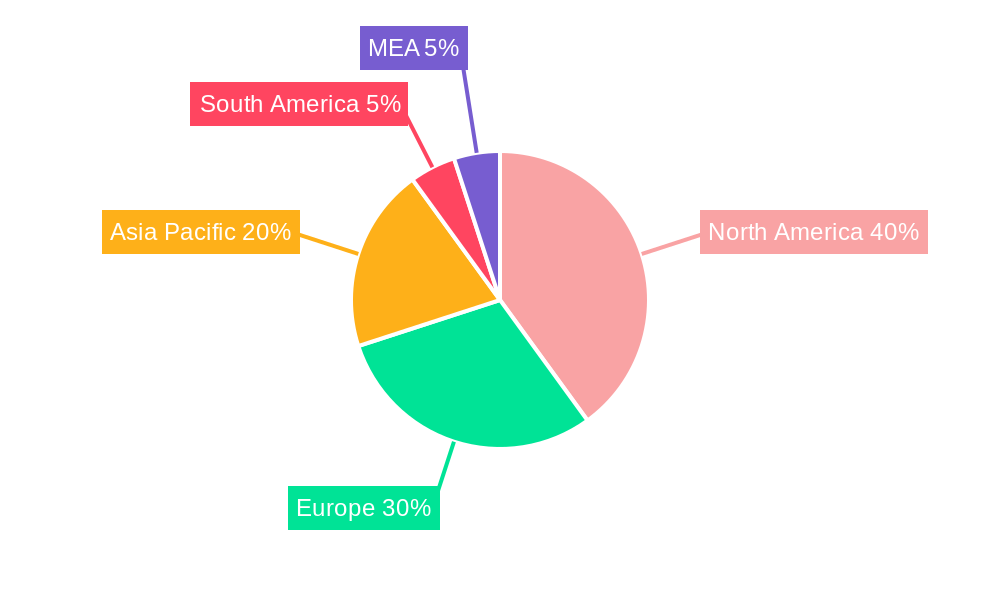
North America currently dominates the AaaS market, driven by early adoption of cloud technologies, robust IT infrastructure, and a strong presence of major players. Within North America, the US holds the largest market share. The Large Enterprises segment contributes significantly to overall market revenue due to higher spending capacity on advanced analytics solutions. Among end-user industries, IT and Telecommunications, BFSI (Banking, Financial Services, and Insurance), and Healthcare demonstrate high adoption rates driven by the need for advanced data analysis and operational efficiency. Europe and Asia-Pacific are exhibiting strong growth potential, fueled by increasing digitalization and government initiatives supporting technology adoption.
- Leading Region: North America (US leading country)
- Dominant Segment (Enterprise Size): Large Enterprises
- High-Growth End-User Industries: IT & Telecommunications, BFSI, Healthcare
- Key Drivers (Asia-Pacific): Increasing digitalization and government investments in digital infrastructure.
Analytics as a Service Industry Product Landscape
The AaaS market offers a wide range of products, including predictive analytics, real-time analytics, descriptive analytics, and prescriptive analytics. These solutions are deployed across various applications, from customer relationship management (CRM) and supply chain optimization to fraud detection and risk management. Key performance indicators (KPIs) for AaaS solutions include accuracy, scalability, ease of use, and security. Many providers offer unique selling propositions centered on specific industry expertise or advanced analytical capabilities, such as AI-powered insights. Recent innovations focus on enhanced data visualization, improved integration with existing systems, and automated machine learning capabilities.
Key Drivers, Barriers & Challenges in Analytics as a Service Industry
Key Drivers: The increasing volume and variety of data, coupled with the need for actionable insights, are primary drivers. Technological advancements like AI/ML and cloud computing enable scalable and cost-effective analytics solutions. Government regulations promoting data analytics adoption also play a significant role.
Challenges: Data security and privacy concerns are paramount. Integration with legacy systems can pose challenges. Competition among providers is intense, putting pressure on pricing and margins. The lack of skilled professionals capable of effectively utilizing AaaS tools presents a significant barrier to widespread adoption. Supply chain disruptions impacting hardware and software availability could affect service delivery. Estimates indicate that integration issues lead to approximately XX% of project delays.
Emerging Opportunities in Analytics as a Service Industry
Untapped markets exist in developing economies with growing digitalization, particularly in sectors like agriculture and education. The development of specialized AaaS solutions for niche industries offers significant potential. The increasing demand for personalized experiences is driving the growth of customer analytics and targeted marketing solutions. The incorporation of IoT data into AaaS platforms presents opportunities for real-time insights and predictive maintenance.
Growth Accelerators in the Analytics as a Service Industry Industry
Strategic partnerships between AaaS providers and technology companies expand market reach and service capabilities. Technological advancements, particularly in AI/ML and edge computing, will continue to enhance AaaS capabilities. The expansion of 5G networks improves data transmission speeds and enables real-time analytics applications. Government initiatives promoting digital transformation and data literacy accelerate market growth.
Key Players Shaping the Analytics as a Service Industry Market
- Host Analytics Inc
- Accenture PLC
- IBM Corporation
- Microsoft Corporation
- Amazon Web Services Inc
- SAS Institute
- Atos SE
- Opera Solutions LLC
- Hewlett-Packard Enterprise Company
- Oracle Corporation
- Google Inc
- SAP SE
Notable Milestones in Analytics as a Service Industry Sector
- April 2022: Kyndryl announced an expanded strategic partnership with SAP, focusing on digital transformation solutions.
- August 2022: Morae Global Corporation and Intelligent Voice Limited formed a strategic partnership to bring advanced data analytics to the legal sector.
In-Depth Analytics as a Service Industry Market Outlook
The AaaS market is poised for sustained growth, driven by the increasing demand for data-driven decision-making, technological advancements, and expanding cloud adoption. Strategic partnerships, innovative product offerings, and expansion into untapped markets present significant opportunities for industry players. The long-term outlook is highly positive, with continued growth expected throughout the forecast period. The market is predicted to witness a shift towards more specialized and integrated solutions, tailored to specific industry needs and driven by AI/ML capabilities.
Analytics as a Service Industry Segmentation
-
1. Enterprise Size
- 1.1. Small and Medium Enterprises
- 1.2. Large Enterprises
-
2. End-User Industry
- 2.1. IT and Telecommunication
- 2.2. Energy and Power
- 2.3. BFSI
- 2.4. Healthcare
- 2.5. Retail
- 2.6. Manufacturing
- 2.7. Other End-user Industries
Analytics as a Service Industry Segmentation By Geography
- 1. North America
- 2. Europe
- 3. Asia Pacific
- 4. Latin America
- 5. Middle East and Africa
Analytics as a Service Industry REPORT HIGHLIGHTS
| Aspects | Details |
|---|---|
| Study Period | 2019-2033 |
| Base Year | 2024 |
| Estimated Year | 2025 |
| Forecast Period | 2025-2033 |
| Historical Period | 2019-2024 |
| Growth Rate | CAGR of 25.00% from 2019-2033 |
| Segmentation |
|
Table of Contents
- 1. Introduction
- 1.1. Research Scope
- 1.2. Market Segmentation
- 1.3. Research Methodology
- 1.4. Definitions and Assumptions
- 2. Executive Summary
- 2.1. Introduction
- 3. Market Dynamics
- 3.1. Introduction
- 3.2. Market Drivers
- 3.2.1. Increasing Cloud Adoption and Rise in the Data Volume Generated; Increasing Demand for Improving Organizations Internal Efficiency
- 3.3. Market Restrains
- 3.3.1. Data Security Concerns
- 3.4. Market Trends
- 3.4.1. Telecom and IT Segment to Grow Significantly
- 4. Market Factor Analysis
- 4.1. Porters Five Forces
- 4.2. Supply/Value Chain
- 4.3. PESTEL analysis
- 4.4. Market Entropy
- 4.5. Patent/Trademark Analysis
- 5. Global Analytics as a Service Industry Analysis, Insights and Forecast, 2019-2031
- 5.1. Market Analysis, Insights and Forecast - by Enterprise Size
- 5.1.1. Small and Medium Enterprises
- 5.1.2. Large Enterprises
- 5.2. Market Analysis, Insights and Forecast - by End-User Industry
- 5.2.1. IT and Telecommunication
- 5.2.2. Energy and Power
- 5.2.3. BFSI
- 5.2.4. Healthcare
- 5.2.5. Retail
- 5.2.6. Manufacturing
- 5.2.7. Other End-user Industries
- 5.3. Market Analysis, Insights and Forecast - by Region
- 5.3.1. North America
- 5.3.2. Europe
- 5.3.3. Asia Pacific
- 5.3.4. Latin America
- 5.3.5. Middle East and Africa
- 5.1. Market Analysis, Insights and Forecast - by Enterprise Size
- 6. North America Analytics as a Service Industry Analysis, Insights and Forecast, 2019-2031
- 6.1. Market Analysis, Insights and Forecast - by Enterprise Size
- 6.1.1. Small and Medium Enterprises
- 6.1.2. Large Enterprises
- 6.2. Market Analysis, Insights and Forecast - by End-User Industry
- 6.2.1. IT and Telecommunication
- 6.2.2. Energy and Power
- 6.2.3. BFSI
- 6.2.4. Healthcare
- 6.2.5. Retail
- 6.2.6. Manufacturing
- 6.2.7. Other End-user Industries
- 6.1. Market Analysis, Insights and Forecast - by Enterprise Size
- 7. Europe Analytics as a Service Industry Analysis, Insights and Forecast, 2019-2031
- 7.1. Market Analysis, Insights and Forecast - by Enterprise Size
- 7.1.1. Small and Medium Enterprises
- 7.1.2. Large Enterprises
- 7.2. Market Analysis, Insights and Forecast - by End-User Industry
- 7.2.1. IT and Telecommunication
- 7.2.2. Energy and Power
- 7.2.3. BFSI
- 7.2.4. Healthcare
- 7.2.5. Retail
- 7.2.6. Manufacturing
- 7.2.7. Other End-user Industries
- 7.1. Market Analysis, Insights and Forecast - by Enterprise Size
- 8. Asia Pacific Analytics as a Service Industry Analysis, Insights and Forecast, 2019-2031
- 8.1. Market Analysis, Insights and Forecast - by Enterprise Size
- 8.1.1. Small and Medium Enterprises
- 8.1.2. Large Enterprises
- 8.2. Market Analysis, Insights and Forecast - by End-User Industry
- 8.2.1. IT and Telecommunication
- 8.2.2. Energy and Power
- 8.2.3. BFSI
- 8.2.4. Healthcare
- 8.2.5. Retail
- 8.2.6. Manufacturing
- 8.2.7. Other End-user Industries
- 8.1. Market Analysis, Insights and Forecast - by Enterprise Size
- 9. Latin America Analytics as a Service Industry Analysis, Insights and Forecast, 2019-2031
- 9.1. Market Analysis, Insights and Forecast - by Enterprise Size
- 9.1.1. Small and Medium Enterprises
- 9.1.2. Large Enterprises
- 9.2. Market Analysis, Insights and Forecast - by End-User Industry
- 9.2.1. IT and Telecommunication
- 9.2.2. Energy and Power
- 9.2.3. BFSI
- 9.2.4. Healthcare
- 9.2.5. Retail
- 9.2.6. Manufacturing
- 9.2.7. Other End-user Industries
- 9.1. Market Analysis, Insights and Forecast - by Enterprise Size
- 10. Middle East and Africa Analytics as a Service Industry Analysis, Insights and Forecast, 2019-2031
- 10.1. Market Analysis, Insights and Forecast - by Enterprise Size
- 10.1.1. Small and Medium Enterprises
- 10.1.2. Large Enterprises
- 10.2. Market Analysis, Insights and Forecast - by End-User Industry
- 10.2.1. IT and Telecommunication
- 10.2.2. Energy and Power
- 10.2.3. BFSI
- 10.2.4. Healthcare
- 10.2.5. Retail
- 10.2.6. Manufacturing
- 10.2.7. Other End-user Industries
- 10.1. Market Analysis, Insights and Forecast - by Enterprise Size
- 11. North America Analytics as a Service Industry Analysis, Insights and Forecast, 2019-2031
- 11.1. Market Analysis, Insights and Forecast - By Country/Sub-region
- 11.1.1 United States
- 11.1.2 Canada
- 11.1.3 Mexico
- 12. Europe Analytics as a Service Industry Analysis, Insights and Forecast, 2019-2031
- 12.1. Market Analysis, Insights and Forecast - By Country/Sub-region
- 12.1.1 Germany
- 12.1.2 United Kingdom
- 12.1.3 France
- 12.1.4 Spain
- 12.1.5 Italy
- 12.1.6 Spain
- 12.1.7 Belgium
- 12.1.8 Netherland
- 12.1.9 Nordics
- 12.1.10 Rest of Europe
- 13. Asia Pacific Analytics as a Service Industry Analysis, Insights and Forecast, 2019-2031
- 13.1. Market Analysis, Insights and Forecast - By Country/Sub-region
- 13.1.1 China
- 13.1.2 Japan
- 13.1.3 India
- 13.1.4 South Korea
- 13.1.5 Southeast Asia
- 13.1.6 Australia
- 13.1.7 Indonesia
- 13.1.8 Phillipes
- 13.1.9 Singapore
- 13.1.10 Thailandc
- 13.1.11 Rest of Asia Pacific
- 14. South America Analytics as a Service Industry Analysis, Insights and Forecast, 2019-2031
- 14.1. Market Analysis, Insights and Forecast - By Country/Sub-region
- 14.1.1 Brazil
- 14.1.2 Argentina
- 14.1.3 Peru
- 14.1.4 Chile
- 14.1.5 Colombia
- 14.1.6 Ecuador
- 14.1.7 Venezuela
- 14.1.8 Rest of South America
- 15. North America Analytics as a Service Industry Analysis, Insights and Forecast, 2019-2031
- 15.1. Market Analysis, Insights and Forecast - By Country/Sub-region
- 15.1.1 United States
- 15.1.2 Canada
- 15.1.3 Mexico
- 16. MEA Analytics as a Service Industry Analysis, Insights and Forecast, 2019-2031
- 16.1. Market Analysis, Insights and Forecast - By Country/Sub-region
- 16.1.1 United Arab Emirates
- 16.1.2 Saudi Arabia
- 16.1.3 South Africa
- 16.1.4 Rest of Middle East and Africa
- 17. Competitive Analysis
- 17.1. Global Market Share Analysis 2024
- 17.2. Company Profiles
- 17.2.1 Host Analytics Inc *List Not Exhaustive
- 17.2.1.1. Overview
- 17.2.1.2. Products
- 17.2.1.3. SWOT Analysis
- 17.2.1.4. Recent Developments
- 17.2.1.5. Financials (Based on Availability)
- 17.2.2 Accenture PLC
- 17.2.2.1. Overview
- 17.2.2.2. Products
- 17.2.2.3. SWOT Analysis
- 17.2.2.4. Recent Developments
- 17.2.2.5. Financials (Based on Availability)
- 17.2.3 IBM Corporation
- 17.2.3.1. Overview
- 17.2.3.2. Products
- 17.2.3.3. SWOT Analysis
- 17.2.3.4. Recent Developments
- 17.2.3.5. Financials (Based on Availability)
- 17.2.4 Microsoft Corporation
- 17.2.4.1. Overview
- 17.2.4.2. Products
- 17.2.4.3. SWOT Analysis
- 17.2.4.4. Recent Developments
- 17.2.4.5. Financials (Based on Availability)
- 17.2.5 Amazon Web Services Inc
- 17.2.5.1. Overview
- 17.2.5.2. Products
- 17.2.5.3. SWOT Analysis
- 17.2.5.4. Recent Developments
- 17.2.5.5. Financials (Based on Availability)
- 17.2.6 SAS Institute
- 17.2.6.1. Overview
- 17.2.6.2. Products
- 17.2.6.3. SWOT Analysis
- 17.2.6.4. Recent Developments
- 17.2.6.5. Financials (Based on Availability)
- 17.2.7 Atos SE
- 17.2.7.1. Overview
- 17.2.7.2. Products
- 17.2.7.3. SWOT Analysis
- 17.2.7.4. Recent Developments
- 17.2.7.5. Financials (Based on Availability)
- 17.2.8 Opera Solutions LLC
- 17.2.8.1. Overview
- 17.2.8.2. Products
- 17.2.8.3. SWOT Analysis
- 17.2.8.4. Recent Developments
- 17.2.8.5. Financials (Based on Availability)
- 17.2.9 Hewlett-Packard Enterprise Company
- 17.2.9.1. Overview
- 17.2.9.2. Products
- 17.2.9.3. SWOT Analysis
- 17.2.9.4. Recent Developments
- 17.2.9.5. Financials (Based on Availability)
- 17.2.10 Oracle Corporation
- 17.2.10.1. Overview
- 17.2.10.2. Products
- 17.2.10.3. SWOT Analysis
- 17.2.10.4. Recent Developments
- 17.2.10.5. Financials (Based on Availability)
- 17.2.11 Google Inc
- 17.2.11.1. Overview
- 17.2.11.2. Products
- 17.2.11.3. SWOT Analysis
- 17.2.11.4. Recent Developments
- 17.2.11.5. Financials (Based on Availability)
- 17.2.12 SAP SE
- 17.2.12.1. Overview
- 17.2.12.2. Products
- 17.2.12.3. SWOT Analysis
- 17.2.12.4. Recent Developments
- 17.2.12.5. Financials (Based on Availability)
- 17.2.1 Host Analytics Inc *List Not Exhaustive
List of Figures
- Figure 1: Global Analytics as a Service Industry Revenue Breakdown (Million, %) by Region 2024 & 2032
- Figure 2: North America Analytics as a Service Industry Revenue (Million), by Country 2024 & 2032
- Figure 3: North America Analytics as a Service Industry Revenue Share (%), by Country 2024 & 2032
- Figure 4: Europe Analytics as a Service Industry Revenue (Million), by Country 2024 & 2032
- Figure 5: Europe Analytics as a Service Industry Revenue Share (%), by Country 2024 & 2032
- Figure 6: Asia Pacific Analytics as a Service Industry Revenue (Million), by Country 2024 & 2032
- Figure 7: Asia Pacific Analytics as a Service Industry Revenue Share (%), by Country 2024 & 2032
- Figure 8: South America Analytics as a Service Industry Revenue (Million), by Country 2024 & 2032
- Figure 9: South America Analytics as a Service Industry Revenue Share (%), by Country 2024 & 2032
- Figure 10: North America Analytics as a Service Industry Revenue (Million), by Country 2024 & 2032
- Figure 11: North America Analytics as a Service Industry Revenue Share (%), by Country 2024 & 2032
- Figure 12: MEA Analytics as a Service Industry Revenue (Million), by Country 2024 & 2032
- Figure 13: MEA Analytics as a Service Industry Revenue Share (%), by Country 2024 & 2032
- Figure 14: North America Analytics as a Service Industry Revenue (Million), by Enterprise Size 2024 & 2032
- Figure 15: North America Analytics as a Service Industry Revenue Share (%), by Enterprise Size 2024 & 2032
- Figure 16: North America Analytics as a Service Industry Revenue (Million), by End-User Industry 2024 & 2032
- Figure 17: North America Analytics as a Service Industry Revenue Share (%), by End-User Industry 2024 & 2032
- Figure 18: North America Analytics as a Service Industry Revenue (Million), by Country 2024 & 2032
- Figure 19: North America Analytics as a Service Industry Revenue Share (%), by Country 2024 & 2032
- Figure 20: Europe Analytics as a Service Industry Revenue (Million), by Enterprise Size 2024 & 2032
- Figure 21: Europe Analytics as a Service Industry Revenue Share (%), by Enterprise Size 2024 & 2032
- Figure 22: Europe Analytics as a Service Industry Revenue (Million), by End-User Industry 2024 & 2032
- Figure 23: Europe Analytics as a Service Industry Revenue Share (%), by End-User Industry 2024 & 2032
- Figure 24: Europe Analytics as a Service Industry Revenue (Million), by Country 2024 & 2032
- Figure 25: Europe Analytics as a Service Industry Revenue Share (%), by Country 2024 & 2032
- Figure 26: Asia Pacific Analytics as a Service Industry Revenue (Million), by Enterprise Size 2024 & 2032
- Figure 27: Asia Pacific Analytics as a Service Industry Revenue Share (%), by Enterprise Size 2024 & 2032
- Figure 28: Asia Pacific Analytics as a Service Industry Revenue (Million), by End-User Industry 2024 & 2032
- Figure 29: Asia Pacific Analytics as a Service Industry Revenue Share (%), by End-User Industry 2024 & 2032
- Figure 30: Asia Pacific Analytics as a Service Industry Revenue (Million), by Country 2024 & 2032
- Figure 31: Asia Pacific Analytics as a Service Industry Revenue Share (%), by Country 2024 & 2032
- Figure 32: Latin America Analytics as a Service Industry Revenue (Million), by Enterprise Size 2024 & 2032
- Figure 33: Latin America Analytics as a Service Industry Revenue Share (%), by Enterprise Size 2024 & 2032
- Figure 34: Latin America Analytics as a Service Industry Revenue (Million), by End-User Industry 2024 & 2032
- Figure 35: Latin America Analytics as a Service Industry Revenue Share (%), by End-User Industry 2024 & 2032
- Figure 36: Latin America Analytics as a Service Industry Revenue (Million), by Country 2024 & 2032
- Figure 37: Latin America Analytics as a Service Industry Revenue Share (%), by Country 2024 & 2032
- Figure 38: Middle East and Africa Analytics as a Service Industry Revenue (Million), by Enterprise Size 2024 & 2032
- Figure 39: Middle East and Africa Analytics as a Service Industry Revenue Share (%), by Enterprise Size 2024 & 2032
- Figure 40: Middle East and Africa Analytics as a Service Industry Revenue (Million), by End-User Industry 2024 & 2032
- Figure 41: Middle East and Africa Analytics as a Service Industry Revenue Share (%), by End-User Industry 2024 & 2032
- Figure 42: Middle East and Africa Analytics as a Service Industry Revenue (Million), by Country 2024 & 2032
- Figure 43: Middle East and Africa Analytics as a Service Industry Revenue Share (%), by Country 2024 & 2032
List of Tables
- Table 1: Global Analytics as a Service Industry Revenue Million Forecast, by Region 2019 & 2032
- Table 2: Global Analytics as a Service Industry Revenue Million Forecast, by Enterprise Size 2019 & 2032
- Table 3: Global Analytics as a Service Industry Revenue Million Forecast, by End-User Industry 2019 & 2032
- Table 4: Global Analytics as a Service Industry Revenue Million Forecast, by Region 2019 & 2032
- Table 5: Global Analytics as a Service Industry Revenue Million Forecast, by Country 2019 & 2032
- Table 6: United States Analytics as a Service Industry Revenue (Million) Forecast, by Application 2019 & 2032
- Table 7: Canada Analytics as a Service Industry Revenue (Million) Forecast, by Application 2019 & 2032
- Table 8: Mexico Analytics as a Service Industry Revenue (Million) Forecast, by Application 2019 & 2032
- Table 9: Global Analytics as a Service Industry Revenue Million Forecast, by Country 2019 & 2032
- Table 10: Germany Analytics as a Service Industry Revenue (Million) Forecast, by Application 2019 & 2032
- Table 11: United Kingdom Analytics as a Service Industry Revenue (Million) Forecast, by Application 2019 & 2032
- Table 12: France Analytics as a Service Industry Revenue (Million) Forecast, by Application 2019 & 2032
- Table 13: Spain Analytics as a Service Industry Revenue (Million) Forecast, by Application 2019 & 2032
- Table 14: Italy Analytics as a Service Industry Revenue (Million) Forecast, by Application 2019 & 2032
- Table 15: Spain Analytics as a Service Industry Revenue (Million) Forecast, by Application 2019 & 2032
- Table 16: Belgium Analytics as a Service Industry Revenue (Million) Forecast, by Application 2019 & 2032
- Table 17: Netherland Analytics as a Service Industry Revenue (Million) Forecast, by Application 2019 & 2032
- Table 18: Nordics Analytics as a Service Industry Revenue (Million) Forecast, by Application 2019 & 2032
- Table 19: Rest of Europe Analytics as a Service Industry Revenue (Million) Forecast, by Application 2019 & 2032
- Table 20: Global Analytics as a Service Industry Revenue Million Forecast, by Country 2019 & 2032
- Table 21: China Analytics as a Service Industry Revenue (Million) Forecast, by Application 2019 & 2032
- Table 22: Japan Analytics as a Service Industry Revenue (Million) Forecast, by Application 2019 & 2032
- Table 23: India Analytics as a Service Industry Revenue (Million) Forecast, by Application 2019 & 2032
- Table 24: South Korea Analytics as a Service Industry Revenue (Million) Forecast, by Application 2019 & 2032
- Table 25: Southeast Asia Analytics as a Service Industry Revenue (Million) Forecast, by Application 2019 & 2032
- Table 26: Australia Analytics as a Service Industry Revenue (Million) Forecast, by Application 2019 & 2032
- Table 27: Indonesia Analytics as a Service Industry Revenue (Million) Forecast, by Application 2019 & 2032
- Table 28: Phillipes Analytics as a Service Industry Revenue (Million) Forecast, by Application 2019 & 2032
- Table 29: Singapore Analytics as a Service Industry Revenue (Million) Forecast, by Application 2019 & 2032
- Table 30: Thailandc Analytics as a Service Industry Revenue (Million) Forecast, by Application 2019 & 2032
- Table 31: Rest of Asia Pacific Analytics as a Service Industry Revenue (Million) Forecast, by Application 2019 & 2032
- Table 32: Global Analytics as a Service Industry Revenue Million Forecast, by Country 2019 & 2032
- Table 33: Brazil Analytics as a Service Industry Revenue (Million) Forecast, by Application 2019 & 2032
- Table 34: Argentina Analytics as a Service Industry Revenue (Million) Forecast, by Application 2019 & 2032
- Table 35: Peru Analytics as a Service Industry Revenue (Million) Forecast, by Application 2019 & 2032
- Table 36: Chile Analytics as a Service Industry Revenue (Million) Forecast, by Application 2019 & 2032
- Table 37: Colombia Analytics as a Service Industry Revenue (Million) Forecast, by Application 2019 & 2032
- Table 38: Ecuador Analytics as a Service Industry Revenue (Million) Forecast, by Application 2019 & 2032
- Table 39: Venezuela Analytics as a Service Industry Revenue (Million) Forecast, by Application 2019 & 2032
- Table 40: Rest of South America Analytics as a Service Industry Revenue (Million) Forecast, by Application 2019 & 2032
- Table 41: Global Analytics as a Service Industry Revenue Million Forecast, by Country 2019 & 2032
- Table 42: United States Analytics as a Service Industry Revenue (Million) Forecast, by Application 2019 & 2032
- Table 43: Canada Analytics as a Service Industry Revenue (Million) Forecast, by Application 2019 & 2032
- Table 44: Mexico Analytics as a Service Industry Revenue (Million) Forecast, by Application 2019 & 2032
- Table 45: Global Analytics as a Service Industry Revenue Million Forecast, by Country 2019 & 2032
- Table 46: United Arab Emirates Analytics as a Service Industry Revenue (Million) Forecast, by Application 2019 & 2032
- Table 47: Saudi Arabia Analytics as a Service Industry Revenue (Million) Forecast, by Application 2019 & 2032
- Table 48: South Africa Analytics as a Service Industry Revenue (Million) Forecast, by Application 2019 & 2032
- Table 49: Rest of Middle East and Africa Analytics as a Service Industry Revenue (Million) Forecast, by Application 2019 & 2032
- Table 50: Global Analytics as a Service Industry Revenue Million Forecast, by Enterprise Size 2019 & 2032
- Table 51: Global Analytics as a Service Industry Revenue Million Forecast, by End-User Industry 2019 & 2032
- Table 52: Global Analytics as a Service Industry Revenue Million Forecast, by Country 2019 & 2032
- Table 53: Global Analytics as a Service Industry Revenue Million Forecast, by Enterprise Size 2019 & 2032
- Table 54: Global Analytics as a Service Industry Revenue Million Forecast, by End-User Industry 2019 & 2032
- Table 55: Global Analytics as a Service Industry Revenue Million Forecast, by Country 2019 & 2032
- Table 56: Global Analytics as a Service Industry Revenue Million Forecast, by Enterprise Size 2019 & 2032
- Table 57: Global Analytics as a Service Industry Revenue Million Forecast, by End-User Industry 2019 & 2032
- Table 58: Global Analytics as a Service Industry Revenue Million Forecast, by Country 2019 & 2032
- Table 59: Global Analytics as a Service Industry Revenue Million Forecast, by Enterprise Size 2019 & 2032
- Table 60: Global Analytics as a Service Industry Revenue Million Forecast, by End-User Industry 2019 & 2032
- Table 61: Global Analytics as a Service Industry Revenue Million Forecast, by Country 2019 & 2032
- Table 62: Global Analytics as a Service Industry Revenue Million Forecast, by Enterprise Size 2019 & 2032
- Table 63: Global Analytics as a Service Industry Revenue Million Forecast, by End-User Industry 2019 & 2032
- Table 64: Global Analytics as a Service Industry Revenue Million Forecast, by Country 2019 & 2032
Frequently Asked Questions
1. What is the projected Compound Annual Growth Rate (CAGR) of the Analytics as a Service Industry?
The projected CAGR is approximately 25.00%.
2. Which companies are prominent players in the Analytics as a Service Industry?
Key companies in the market include Host Analytics Inc *List Not Exhaustive, Accenture PLC, IBM Corporation, Microsoft Corporation, Amazon Web Services Inc, SAS Institute, Atos SE, Opera Solutions LLC, Hewlett-Packard Enterprise Company, Oracle Corporation, Google Inc, SAP SE.
3. What are the main segments of the Analytics as a Service Industry?
The market segments include Enterprise Size, End-User Industry.
4. Can you provide details about the market size?
The market size is estimated to be USD XX Million as of 2022.
5. What are some drivers contributing to market growth?
Increasing Cloud Adoption and Rise in the Data Volume Generated; Increasing Demand for Improving Organizations Internal Efficiency.
6. What are the notable trends driving market growth?
Telecom and IT Segment to Grow Significantly.
7. Are there any restraints impacting market growth?
Data Security Concerns.
8. Can you provide examples of recent developments in the market?
April 2022 - Kyndryl announced the expansion of strategic partnership with SAP to assist customers in overcoming digital transformation challenges Kyndryl will provide services that complement the RISE with an SAP solution, such as proven migration tools and scalable offerings, AI-driven business data management and analytics solutions, application modernization, and more, as part of the expanded collaboration.
9. What pricing options are available for accessing the report?
Pricing options include single-user, multi-user, and enterprise licenses priced at USD 4750, USD 5250, and USD 8750 respectively.
10. Is the market size provided in terms of value or volume?
The market size is provided in terms of value, measured in Million.
11. Are there any specific market keywords associated with the report?
Yes, the market keyword associated with the report is "Analytics as a Service Industry," which aids in identifying and referencing the specific market segment covered.
12. How do I determine which pricing option suits my needs best?
The pricing options vary based on user requirements and access needs. Individual users may opt for single-user licenses, while businesses requiring broader access may choose multi-user or enterprise licenses for cost-effective access to the report.
13. Are there any additional resources or data provided in the Analytics as a Service Industry report?
While the report offers comprehensive insights, it's advisable to review the specific contents or supplementary materials provided to ascertain if additional resources or data are available.
14. How can I stay updated on further developments or reports in the Analytics as a Service Industry?
To stay informed about further developments, trends, and reports in the Analytics as a Service Industry, consider subscribing to industry newsletters, following relevant companies and organizations, or regularly checking reputable industry news sources and publications.
Methodology
Step 1 - Identification of Relevant Samples Size from Population Database


Step 2 - Approaches for Defining Global Market Size (Value, Volume* & Price*)

Note*: In applicable scenarios
Step 3 - Data Sources
Primary Research
- Web Analytics
- Survey Reports
- Research Institute
- Latest Research Reports
- Opinion Leaders
Secondary Research
- Annual Reports
- White Paper
- Latest Press Release
- Industry Association
- Paid Database
- Investor Presentations

Step 4 - Data Triangulation
Involves using different sources of information in order to increase the validity of a study
These sources are likely to be stakeholders in a program - participants, other researchers, program staff, other community members, and so on.
Then we put all data in single framework & apply various statistical tools to find out the dynamic on the market.
During the analysis stage, feedback from the stakeholder groups would be compared to determine areas of agreement as well as areas of divergence
