

Key Insights
The Asia-Pacific (APAC) Building Energy Management Systems (BEMS) market is experiencing robust growth, driven by increasing urbanization, stringent government regulations promoting energy efficiency, and the rising adoption of smart building technologies. The region's diverse economies, ranging from rapidly developing nations like India and Southeast Asia to technologically advanced countries such as Japan and South Korea, contribute to a complex yet dynamic market landscape. A significant driver is the escalating demand for energy-efficient buildings across commercial, industrial, and educational sectors. The increasing awareness of environmental sustainability and the need to reduce carbon footprints further fuels market expansion. While the initial investment in BEMS can be substantial, the long-term cost savings through reduced energy consumption and improved operational efficiency make it an attractive proposition for building owners and operators. The market is segmented by solution type (hardware, software, services), end-user application (commercial, educational, industrial), and distribution channel (direct sales, system integrators, etc.). Competition is fierce, with established players like Honeywell, Siemens, Johnson Controls, and Schneider Electric vying for market share alongside emerging technology providers. The market's future trajectory is optimistic, projected to maintain a healthy Compound Annual Growth Rate (CAGR) for the forecast period, driven by continuous technological advancements, government incentives, and a growing emphasis on sustainable building practices.
The APAC BEMS market's growth is geographically varied. China and Japan represent significant market segments, due to their mature economies and large building stocks. However, rapidly developing economies in Southeast Asia present immense growth potential. Countries like India and others in the region are witnessing a surge in construction activities and an increased focus on energy efficiency, thereby creating significant opportunities for BEMS providers. The market's success is linked to overcoming challenges such as the high initial costs of implementation and the need for skilled workforce to install and maintain these systems. However, the escalating energy prices and the rising adoption of smart city initiatives are expected to outweigh these restraints, resulting in sustained market expansion throughout the forecast period. The ongoing focus on integrating renewable energy sources into building designs further supports the market's growth trajectory.
APAC Building Energy Management Systems Market: A Comprehensive Report (2019-2033)
This comprehensive report provides an in-depth analysis of the Asia-Pacific (APAC) Building Energy Management Systems (BEMS) market, encompassing market dynamics, growth trends, regional dominance, product landscape, key players, and future outlook. The study period covers 2019-2033, with 2025 as the base and estimated year. This report is crucial for industry professionals, investors, and strategists seeking a clear understanding of this dynamic market. The APAC BEMS market, a key segment within the broader global Building Automation Systems market, is poised for significant growth driven by increasing energy costs, stringent environmental regulations, and the rising adoption of smart building technologies.
APAC Building Energy Management Systems Market Dynamics & Structure
The APAC BEMS market is characterized by a moderately concentrated landscape with several multinational players and a growing number of regional vendors. Market concentration is expected to remain relatively stable in the forecast period, with leading players focusing on strategic partnerships and technological advancements to maintain their market share. The market is driven by technological innovations such as AI, IoT, and cloud-based solutions, which enhance energy efficiency and operational optimization. Furthermore, supportive government regulations promoting energy conservation and sustainable building practices are creating a favorable environment for market expansion. However, high initial investment costs, integration complexities, and cybersecurity concerns pose significant barriers to wider adoption.
- Market Concentration: Moderately concentrated, with top players holding approximately xx% of the market share in 2025.
- Technological Drivers: AI, IoT, cloud computing, and advanced analytics are revolutionizing BEMS capabilities.
- Regulatory Framework: Stringent energy efficiency standards and government incentives are boosting market growth.
- Competitive Substitutes: Limited direct substitutes exist, but competition exists from standalone building automation systems.
- End-User Demographics: Increasing commercial, educational, and industrial construction activities fuel market demand.
- M&A Trends: A moderate number of M&A deals (xx deals in 2024) are expected, primarily driven by consolidation and expansion strategies of larger players.
APAC Building Energy Management Systems Market Growth Trends & Insights
The APAC BEMS market is experiencing robust growth, driven by the increasing adoption of smart building technologies and the growing focus on energy efficiency across various sectors. The market size is estimated to reach xx million units in 2025 and is projected to grow at a CAGR of xx% during the forecast period (2025-2033). This expansion is fueled by factors such as rising energy prices, stringent environmental regulations, increasing awareness of sustainability, and the proliferation of smart building solutions. The adoption rate is accelerating, particularly in the commercial and industrial segments, driven by the potential for significant cost savings and operational improvements. However, challenges such as high implementation costs and the need for skilled professionals to manage complex systems are likely to slow down market penetration in certain sub-segments, especially in less-developed regions. The shift towards cloud-based solutions is also driving growth, offering scalable and cost-effective solutions to end-users.
Dominant Regions, Countries, or Segments in APAC Building Energy Management Systems Market
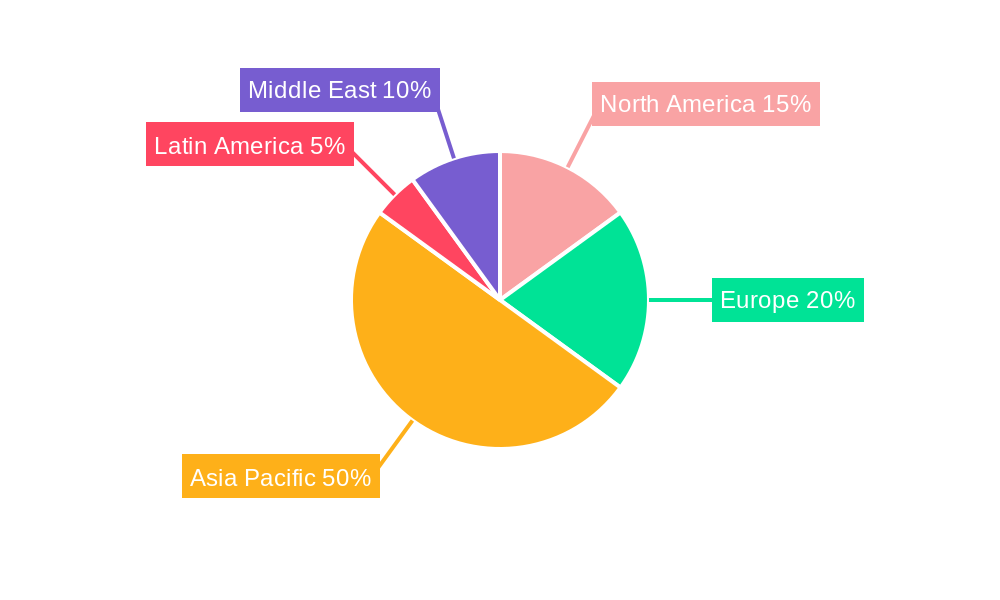
China dominates the APAC BEMS market, accounting for xx% of the total market value in 2025, primarily driven by rapid urbanization, significant infrastructure development, and government initiatives to promote energy efficiency. Japan and Southeast Asia are also key contributors, with strong growth potential in the coming years. Within segments, the commercial sector is the largest end-user application, followed by the industrial sector. The hardware segment (controllers and gateways) currently holds the largest share, but the software and services segments are anticipated to witness faster growth rates due to increasing demand for advanced analytics and remote monitoring capabilities. Direct/Partner Sales dominate the distribution channel, with value-added resellers and system integrators playing a vital role in market expansion.
Key Drivers:
- China: Rapid urbanization, robust infrastructure development, and government support.
- Japan: High energy costs, stringent environmental regulations, and advanced technological adoption.
- Southeast Asia: Growing industrialization, rising middle class, and government focus on sustainable development.
- Commercial Sector: High concentration of buildings, greater energy consumption, and significant ROI potential.
- Hardware Segment: Essential infrastructure for BEMS implementation, but growth limited by maturity of segment.
- Direct Sales: Strong customer relationships and specialized service offerings provide competitive edge.
Dominance Factors:
- China's vast construction activity and governmental incentives are significant factors.
- Japan's technologically advanced buildings and mature market contribute to market leadership.
- Southeast Asia's rapidly developing economies and expanding building infrastructure are key growth areas.
APAP Building Energy Management Systems Market Product Landscape
The APAC BEMS market offers a diverse range of products, encompassing hardware (controllers, gateways, sensors), software (energy monitoring platforms, building automation software), and services (installation, maintenance, support, and analytics). Technological advancements are focusing on improving energy efficiency, enhancing operational visibility, and streamlining integration with other building systems. Unique selling propositions include AI-powered predictive maintenance, sophisticated energy analytics, and enhanced cybersecurity features. The market is experiencing a shift towards cloud-based and IoT-enabled solutions, providing greater scalability, flexibility, and remote management capabilities.
Key Drivers, Barriers & Challenges in APAC Building Energy Management Systems Market
Key Drivers:
- Rising energy costs and the need for operational efficiency are primary drivers.
- Stringent environmental regulations and government incentives promote BEMS adoption.
- Growing awareness of sustainability among building owners and tenants.
- Technological advancements, such as AI and IoT, enhance BEMS capabilities.
Key Challenges:
- High initial investment costs and complex integration processes hinder wider adoption.
- Lack of skilled professionals for installation and maintenance of BEMS systems.
- Cybersecurity concerns related to data security and system vulnerabilities.
- Competition from legacy building automation systems and the emergence of new technologies. Supply chain disruptions (estimated to have impacted the market by xx million units in 2022) continue to pose a challenge.
Emerging Opportunities in APAP Building Energy Management Systems Market
Untapped potential exists in smaller cities and towns across APAC, with growing awareness of sustainability and energy efficiency. There is also a significant opportunity in the retrofitting of existing buildings, which presents a massive market for BEMS upgrades. Emerging technologies like AI-powered predictive maintenance and advanced analytics offer increased value propositions, driving adoption in segments currently underpenetrated. Furthermore, innovative financing models and tailored solutions can address the high initial investment costs hindering broader market penetration.
Growth Accelerators in the APAC Building Energy Management Systems Market Industry
Technological breakthroughs, particularly in AI and IoT, are accelerating market growth. Strategic partnerships between BEMS providers and building owners are facilitating wider adoption and delivering integrated solutions. Government initiatives focused on sustainability and energy efficiency are creating a supportive environment for expansion. The increasing adoption of cloud-based solutions and remote monitoring capabilities simplifies operation and lowers costs, furthering market expansion across various regions within APAC.
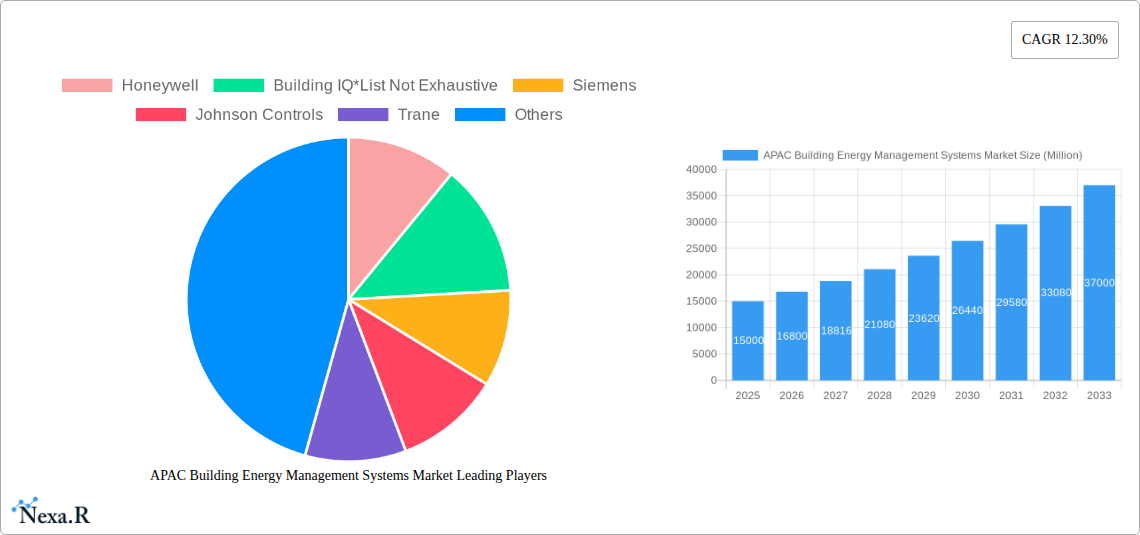
Key Players Shaping the APAC Building Energy Management Systems Market Market
- Honeywell
- Building IQ
- Siemens
- Johnson Controls
- Trane
- Schneider Electric
- ABB
Notable Milestones in APAC Building Energy Management Systems Market Sector
- August 2022: Johnson Controls partnered with Microsoft Beijing Campus, achieving 27.9% energy savings and 98% equipment uptime. This partnership garnered energy-saving endorsements and financial subsidies from the Beijing Municipal Government.
- March 2022: WRI India partnered with the Energy Management Centre Kerala to launch "Oorjayan," a state-wide program to improve energy efficiency in government buildings. This initiative demonstrates increasing governmental focus on BEMS implementation within APAC.
In-Depth APAC Building Energy Management Systems Market Market Outlook
The APAC BEMS market is poised for continued robust growth, driven by technological advancements, supportive government policies, and increasing awareness of sustainability. The market presents significant opportunities for both established players and new entrants. Strategic partnerships, focused innovation, and the expansion into underpenetrated segments will be crucial for success in this rapidly evolving landscape. The long-term potential is substantial, particularly in the context of global efforts to reduce carbon emissions and create more sustainable buildings.
APAC Building Energy Management Systems Market Segmentation
-
1. Type of Solution
- 1.1. Hardware (controllers and gateways)
- 1.2. Software
- 1.3. Services
-
2. Distribution Channel
- 2.1. Direct/Partner Sales/Retail
- 2.2. Value-added Resellers/System Integrators
- 2.3. Utilities/Energy Service Providers
-
3. End-user Application
- 3.1. Commercial
- 3.2. Educational
- 3.3. Industrial
- 3.4. Others
APAC Building Energy Management Systems Market Segmentation By Geography
-
1. North America
- 1.1. United States
- 1.2. Canada
- 1.3. Mexico
-
2. South America
- 2.1. Brazil
- 2.2. Argentina
- 2.3. Rest of South America
-
3. Europe
- 3.1. United Kingdom
- 3.2. Germany
- 3.3. France
- 3.4. Italy
- 3.5. Spain
- 3.6. Russia
- 3.7. Benelux
- 3.8. Nordics
- 3.9. Rest of Europe
-
4. Middle East & Africa
- 4.1. Turkey
- 4.2. Israel
- 4.3. GCC
- 4.4. North Africa
- 4.5. South Africa
- 4.6. Rest of Middle East & Africa
-
5. Asia Pacific
- 5.1. China
- 5.2. India
- 5.3. Japan
- 5.4. South Korea
- 5.5. ASEAN
- 5.6. Oceania
- 5.7. Rest of Asia Pacific
APAC Building Energy Management Systems Market REPORT HIGHLIGHTS
| Aspects | Details |
|---|---|
| Study Period | 2019-2033 |
| Base Year | 2024 |
| Estimated Year | 2025 |
| Forecast Period | 2025-2033 |
| Historical Period | 2019-2024 |
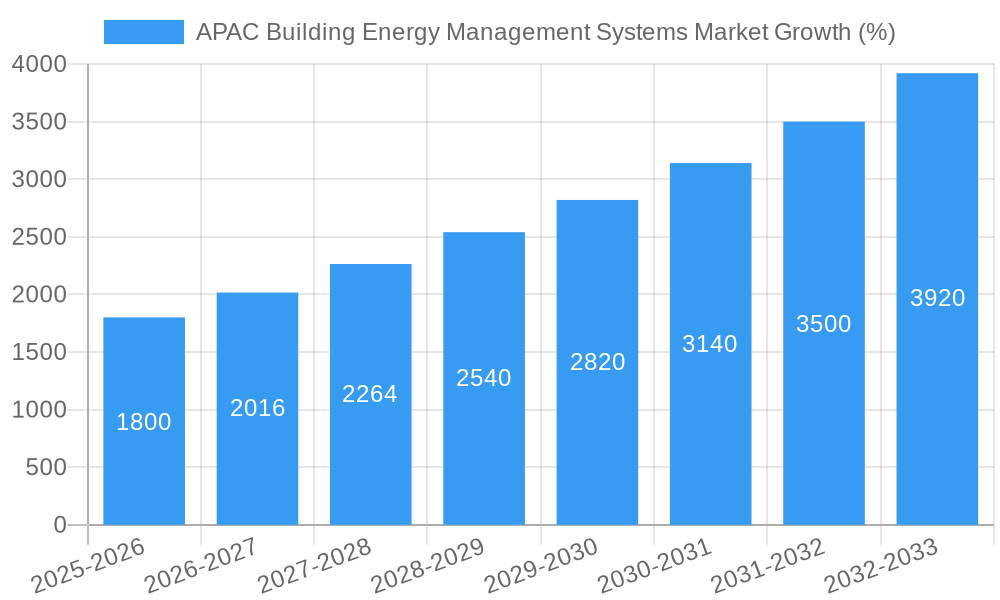
| Growth Rate | CAGR of 12.30% from 2019-2033 |
| Segmentation |
|
Table of Contents
- 1. Introduction
- 1.1. Research Scope
- 1.2. Market Segmentation
- 1.3. Research Methodology
- 1.4. Definitions and Assumptions
- 2. Executive Summary
- 2.1. Introduction
- 3. Market Dynamics
- 3.1. Introduction
- 3.2. Market Drivers
- 3.2.1. Rapid Growing Numbe of End-users; Low Manufacturing Costs
- 3.3. Market Restrains
- 3.3.1. Technical Difficulties
- 3.4. Market Trends
- 3.4.1. The Increase in Demand from the Residential Segment is Expected to Drive the Market
- 4. Market Factor Analysis
- 4.1. Porters Five Forces
- 4.2. Supply/Value Chain
- 4.3. PESTEL analysis
- 4.4. Market Entropy
- 4.5. Patent/Trademark Analysis
- 5. Global APAC Building Energy Management Systems Market Analysis, Insights and Forecast, 2019-2031
- 5.1. Market Analysis, Insights and Forecast - by Type of Solution
- 5.1.1. Hardware (controllers and gateways)
- 5.1.2. Software
- 5.1.3. Services
- 5.2. Market Analysis, Insights and Forecast - by Distribution Channel
- 5.2.1. Direct/Partner Sales/Retail
- 5.2.2. Value-added Resellers/System Integrators
- 5.2.3. Utilities/Energy Service Providers
- 5.3. Market Analysis, Insights and Forecast - by End-user Application
- 5.3.1. Commercial
- 5.3.2. Educational
- 5.3.3. Industrial
- 5.3.4. Others
- 5.4. Market Analysis, Insights and Forecast - by Region
- 5.4.1. North America
- 5.4.2. South America
- 5.4.3. Europe
- 5.4.4. Middle East & Africa
- 5.4.5. Asia Pacific
- 5.1. Market Analysis, Insights and Forecast - by Type of Solution
- 6. North America APAC Building Energy Management Systems Market Analysis, Insights and Forecast, 2019-2031
- 6.1. Market Analysis, Insights and Forecast - by Type of Solution
- 6.1.1. Hardware (controllers and gateways)
- 6.1.2. Software
- 6.1.3. Services
- 6.2. Market Analysis, Insights and Forecast - by Distribution Channel
- 6.2.1. Direct/Partner Sales/Retail
- 6.2.2. Value-added Resellers/System Integrators
- 6.2.3. Utilities/Energy Service Providers
- 6.3. Market Analysis, Insights and Forecast - by End-user Application
- 6.3.1. Commercial
- 6.3.2. Educational
- 6.3.3. Industrial
- 6.3.4. Others
- 6.1. Market Analysis, Insights and Forecast - by Type of Solution
- 7. South America APAC Building Energy Management Systems Market Analysis, Insights and Forecast, 2019-2031
- 7.1. Market Analysis, Insights and Forecast - by Type of Solution
- 7.1.1. Hardware (controllers and gateways)
- 7.1.2. Software
- 7.1.3. Services
- 7.2. Market Analysis, Insights and Forecast - by Distribution Channel
- 7.2.1. Direct/Partner Sales/Retail
- 7.2.2. Value-added Resellers/System Integrators
- 7.2.3. Utilities/Energy Service Providers
- 7.3. Market Analysis, Insights and Forecast - by End-user Application
- 7.3.1. Commercial
- 7.3.2. Educational
- 7.3.3. Industrial
- 7.3.4. Others
- 7.1. Market Analysis, Insights and Forecast - by Type of Solution
- 8. Europe APAC Building Energy Management Systems Market Analysis, Insights and Forecast, 2019-2031
- 8.1. Market Analysis, Insights and Forecast - by Type of Solution
- 8.1.1. Hardware (controllers and gateways)
- 8.1.2. Software
- 8.1.3. Services
- 8.2. Market Analysis, Insights and Forecast - by Distribution Channel
- 8.2.1. Direct/Partner Sales/Retail
- 8.2.2. Value-added Resellers/System Integrators
- 8.2.3. Utilities/Energy Service Providers
- 8.3. Market Analysis, Insights and Forecast - by End-user Application
- 8.3.1. Commercial
- 8.3.2. Educational
- 8.3.3. Industrial
- 8.3.4. Others
- 8.1. Market Analysis, Insights and Forecast - by Type of Solution
- 9. Middle East & Africa APAC Building Energy Management Systems Market Analysis, Insights and Forecast, 2019-2031
- 9.1. Market Analysis, Insights and Forecast - by Type of Solution
- 9.1.1. Hardware (controllers and gateways)
- 9.1.2. Software
- 9.1.3. Services
- 9.2. Market Analysis, Insights and Forecast - by Distribution Channel
- 9.2.1. Direct/Partner Sales/Retail
- 9.2.2. Value-added Resellers/System Integrators
- 9.2.3. Utilities/Energy Service Providers
- 9.3. Market Analysis, Insights and Forecast - by End-user Application
- 9.3.1. Commercial
- 9.3.2. Educational
- 9.3.3. Industrial
- 9.3.4. Others
- 9.1. Market Analysis, Insights and Forecast - by Type of Solution
- 10. Asia Pacific APAC Building Energy Management Systems Market Analysis, Insights and Forecast, 2019-2031
- 10.1. Market Analysis, Insights and Forecast - by Type of Solution
- 10.1.1. Hardware (controllers and gateways)
- 10.1.2. Software
- 10.1.3. Services
- 10.2. Market Analysis, Insights and Forecast - by Distribution Channel
- 10.2.1. Direct/Partner Sales/Retail
- 10.2.2. Value-added Resellers/System Integrators
- 10.2.3. Utilities/Energy Service Providers
- 10.3. Market Analysis, Insights and Forecast - by End-user Application
- 10.3.1. Commercial
- 10.3.2. Educational
- 10.3.3. Industrial
- 10.3.4. Others
- 10.1. Market Analysis, Insights and Forecast - by Type of Solution
- 11. North America APAC Building Energy Management Systems Market Analysis, Insights and Forecast, 2019-2031
- 11.1. Market Analysis, Insights and Forecast - By Country/Sub-region
- 11.1.1 United States
- 11.1.2 Canada
- 12. Europe APAC Building Energy Management Systems Market Analysis, Insights and Forecast, 2019-2031
- 12.1. Market Analysis, Insights and Forecast - By Country/Sub-region
- 12.1.1 United Kingdom
- 12.1.2 Germany
- 12.1.3 France
- 12.1.4 Benelux
- 12.1.5 Rest of Europe
- 13. Asia Pacific APAC Building Energy Management Systems Market Analysis, Insights and Forecast, 2019-2031
- 13.1. Market Analysis, Insights and Forecast - By Country/Sub-region
- 13.1.1 China
- 13.1.2 India
- 13.1.3 Japan
- 13.1.4 Rest of Asia Pacific
- 14. Latin America APAC Building Energy Management Systems Market Analysis, Insights and Forecast, 2019-2031
- 14.1. Market Analysis, Insights and Forecast - By Country/Sub-region
- 14.1.1 Brazil
- 14.1.2 Argentina
- 14.1.3 Mexico
- 14.1.4 Rest of Latin America
- 15. Middle East APAC Building Energy Management Systems Market Analysis, Insights and Forecast, 2019-2031
- 15.1. Market Analysis, Insights and Forecast - By Country/Sub-region
- 15.1.1.
- 16. United Arab Emirates APAC Building Energy Management Systems Market Analysis, Insights and Forecast, 2019-2031
- 16.1. Market Analysis, Insights and Forecast - By Country/Sub-region
- 16.1.1 Saudi Arabia
- 16.1.2 South Africa
- 16.1.3 Rest of Middle East
- 17. Competitive Analysis
- 17.1. Global Market Share Analysis 2024
- 17.2. Company Profiles
- 17.2.1 Honeywell
- 17.2.1.1. Overview
- 17.2.1.2. Products
- 17.2.1.3. SWOT Analysis
- 17.2.1.4. Recent Developments
- 17.2.1.5. Financials (Based on Availability)
- 17.2.2 Building IQ*List Not Exhaustive
- 17.2.2.1. Overview
- 17.2.2.2. Products
- 17.2.2.3. SWOT Analysis
- 17.2.2.4. Recent Developments
- 17.2.2.5. Financials (Based on Availability)
- 17.2.3 Siemens
- 17.2.3.1. Overview
- 17.2.3.2. Products
- 17.2.3.3. SWOT Analysis
- 17.2.3.4. Recent Developments
- 17.2.3.5. Financials (Based on Availability)
- 17.2.4 Johnson Controls
- 17.2.4.1. Overview
- 17.2.4.2. Products
- 17.2.4.3. SWOT Analysis
- 17.2.4.4. Recent Developments
- 17.2.4.5. Financials (Based on Availability)
- 17.2.5 Trane
- 17.2.5.1. Overview
- 17.2.5.2. Products
- 17.2.5.3. SWOT Analysis
- 17.2.5.4. Recent Developments
- 17.2.5.5. Financials (Based on Availability)
- 17.2.6 Schneider Electric
- 17.2.6.1. Overview
- 17.2.6.2. Products
- 17.2.6.3. SWOT Analysis
- 17.2.6.4. Recent Developments
- 17.2.6.5. Financials (Based on Availability)
- 17.2.7 ABB
- 17.2.7.1. Overview
- 17.2.7.2. Products
- 17.2.7.3. SWOT Analysis
- 17.2.7.4. Recent Developments
- 17.2.7.5. Financials (Based on Availability)
- 17.2.1 Honeywell
List of Figures
- Figure 1: Global APAC Building Energy Management Systems Market Revenue Breakdown (Million, %) by Region 2024 & 2032
- Figure 2: North America APAC Building Energy Management Systems Market Revenue (Million), by Country 2024 & 2032
- Figure 3: North America APAC Building Energy Management Systems Market Revenue Share (%), by Country 2024 & 2032
- Figure 4: Europe APAC Building Energy Management Systems Market Revenue (Million), by Country 2024 & 2032
- Figure 5: Europe APAC Building Energy Management Systems Market Revenue Share (%), by Country 2024 & 2032
- Figure 6: Asia Pacific APAC Building Energy Management Systems Market Revenue (Million), by Country 2024 & 2032
- Figure 7: Asia Pacific APAC Building Energy Management Systems Market Revenue Share (%), by Country 2024 & 2032
- Figure 8: Latin America APAC Building Energy Management Systems Market Revenue (Million), by Country 2024 & 2032
- Figure 9: Latin America APAC Building Energy Management Systems Market Revenue Share (%), by Country 2024 & 2032
- Figure 10: Middle East APAC Building Energy Management Systems Market Revenue (Million), by Country 2024 & 2032
- Figure 11: Middle East APAC Building Energy Management Systems Market Revenue Share (%), by Country 2024 & 2032
- Figure 12: United Arab Emirates APAC Building Energy Management Systems Market Revenue (Million), by Country 2024 & 2032
- Figure 13: United Arab Emirates APAC Building Energy Management Systems Market Revenue Share (%), by Country 2024 & 2032
- Figure 14: North America APAC Building Energy Management Systems Market Revenue (Million), by Type of Solution 2024 & 2032
- Figure 15: North America APAC Building Energy Management Systems Market Revenue Share (%), by Type of Solution 2024 & 2032
- Figure 16: North America APAC Building Energy Management Systems Market Revenue (Million), by Distribution Channel 2024 & 2032
- Figure 17: North America APAC Building Energy Management Systems Market Revenue Share (%), by Distribution Channel 2024 & 2032
- Figure 18: North America APAC Building Energy Management Systems Market Revenue (Million), by End-user Application 2024 & 2032
- Figure 19: North America APAC Building Energy Management Systems Market Revenue Share (%), by End-user Application 2024 & 2032
- Figure 20: North America APAC Building Energy Management Systems Market Revenue (Million), by Country 2024 & 2032
- Figure 21: North America APAC Building Energy Management Systems Market Revenue Share (%), by Country 2024 & 2032
- Figure 22: South America APAC Building Energy Management Systems Market Revenue (Million), by Type of Solution 2024 & 2032
- Figure 23: South America APAC Building Energy Management Systems Market Revenue Share (%), by Type of Solution 2024 & 2032
- Figure 24: South America APAC Building Energy Management Systems Market Revenue (Million), by Distribution Channel 2024 & 2032
- Figure 25: South America APAC Building Energy Management Systems Market Revenue Share (%), by Distribution Channel 2024 & 2032
- Figure 26: South America APAC Building Energy Management Systems Market Revenue (Million), by End-user Application 2024 & 2032
- Figure 27: South America APAC Building Energy Management Systems Market Revenue Share (%), by End-user Application 2024 & 2032
- Figure 28: South America APAC Building Energy Management Systems Market Revenue (Million), by Country 2024 & 2032
- Figure 29: South America APAC Building Energy Management Systems Market Revenue Share (%), by Country 2024 & 2032
- Figure 30: Europe APAC Building Energy Management Systems Market Revenue (Million), by Type of Solution 2024 & 2032
- Figure 31: Europe APAC Building Energy Management Systems Market Revenue Share (%), by Type of Solution 2024 & 2032
- Figure 32: Europe APAC Building Energy Management Systems Market Revenue (Million), by Distribution Channel 2024 & 2032
- Figure 33: Europe APAC Building Energy Management Systems Market Revenue Share (%), by Distribution Channel 2024 & 2032
- Figure 34: Europe APAC Building Energy Management Systems Market Revenue (Million), by End-user Application 2024 & 2032
- Figure 35: Europe APAC Building Energy Management Systems Market Revenue Share (%), by End-user Application 2024 & 2032
- Figure 36: Europe APAC Building Energy Management Systems Market Revenue (Million), by Country 2024 & 2032
- Figure 37: Europe APAC Building Energy Management Systems Market Revenue Share (%), by Country 2024 & 2032
- Figure 38: Middle East & Africa APAC Building Energy Management Systems Market Revenue (Million), by Type of Solution 2024 & 2032
- Figure 39: Middle East & Africa APAC Building Energy Management Systems Market Revenue Share (%), by Type of Solution 2024 & 2032
- Figure 40: Middle East & Africa APAC Building Energy Management Systems Market Revenue (Million), by Distribution Channel 2024 & 2032
- Figure 41: Middle East & Africa APAC Building Energy Management Systems Market Revenue Share (%), by Distribution Channel 2024 & 2032
- Figure 42: Middle East & Africa APAC Building Energy Management Systems Market Revenue (Million), by End-user Application 2024 & 2032
- Figure 43: Middle East & Africa APAC Building Energy Management Systems Market Revenue Share (%), by End-user Application 2024 & 2032
- Figure 44: Middle East & Africa APAC Building Energy Management Systems Market Revenue (Million), by Country 2024 & 2032
- Figure 45: Middle East & Africa APAC Building Energy Management Systems Market Revenue Share (%), by Country 2024 & 2032
- Figure 46: Asia Pacific APAC Building Energy Management Systems Market Revenue (Million), by Type of Solution 2024 & 2032
- Figure 47: Asia Pacific APAC Building Energy Management Systems Market Revenue Share (%), by Type of Solution 2024 & 2032
- Figure 48: Asia Pacific APAC Building Energy Management Systems Market Revenue (Million), by Distribution Channel 2024 & 2032
- Figure 49: Asia Pacific APAC Building Energy Management Systems Market Revenue Share (%), by Distribution Channel 2024 & 2032
- Figure 50: Asia Pacific APAC Building Energy Management Systems Market Revenue (Million), by End-user Application 2024 & 2032
- Figure 51: Asia Pacific APAC Building Energy Management Systems Market Revenue Share (%), by End-user Application 2024 & 2032
- Figure 52: Asia Pacific APAC Building Energy Management Systems Market Revenue (Million), by Country 2024 & 2032
- Figure 53: Asia Pacific APAC Building Energy Management Systems Market Revenue Share (%), by Country 2024 & 2032
List of Tables
- Table 1: Global APAC Building Energy Management Systems Market Revenue Million Forecast, by Region 2019 & 2032
- Table 2: Global APAC Building Energy Management Systems Market Revenue Million Forecast, by Type of Solution 2019 & 2032
- Table 3: Global APAC Building Energy Management Systems Market Revenue Million Forecast, by Distribution Channel 2019 & 2032
- Table 4: Global APAC Building Energy Management Systems Market Revenue Million Forecast, by End-user Application 2019 & 2032
- Table 5: Global APAC Building Energy Management Systems Market Revenue Million Forecast, by Region 2019 & 2032
- Table 6: Global APAC Building Energy Management Systems Market Revenue Million Forecast, by Country 2019 & 2032
- Table 7: United States APAC Building Energy Management Systems Market Revenue (Million) Forecast, by Application 2019 & 2032
- Table 8: Canada APAC Building Energy Management Systems Market Revenue (Million) Forecast, by Application 2019 & 2032
- Table 9: Global APAC Building Energy Management Systems Market Revenue Million Forecast, by Country 2019 & 2032
- Table 10: United Kingdom APAC Building Energy Management Systems Market Revenue (Million) Forecast, by Application 2019 & 2032
- Table 11: Germany APAC Building Energy Management Systems Market Revenue (Million) Forecast, by Application 2019 & 2032
- Table 12: France APAC Building Energy Management Systems Market Revenue (Million) Forecast, by Application 2019 & 2032
- Table 13: Benelux APAC Building Energy Management Systems Market Revenue (Million) Forecast, by Application 2019 & 2032
- Table 14: Rest of Europe APAC Building Energy Management Systems Market Revenue (Million) Forecast, by Application 2019 & 2032
- Table 15: Global APAC Building Energy Management Systems Market Revenue Million Forecast, by Country 2019 & 2032
- Table 16: China APAC Building Energy Management Systems Market Revenue (Million) Forecast, by Application 2019 & 2032
- Table 17: India APAC Building Energy Management Systems Market Revenue (Million) Forecast, by Application 2019 & 2032
- Table 18: Japan APAC Building Energy Management Systems Market Revenue (Million) Forecast, by Application 2019 & 2032
- Table 19: Rest of Asia Pacific APAC Building Energy Management Systems Market Revenue (Million) Forecast, by Application 2019 & 2032
- Table 20: Global APAC Building Energy Management Systems Market Revenue Million Forecast, by Country 2019 & 2032
- Table 21: Brazil APAC Building Energy Management Systems Market Revenue (Million) Forecast, by Application 2019 & 2032
- Table 22: Argentina APAC Building Energy Management Systems Market Revenue (Million) Forecast, by Application 2019 & 2032
- Table 23: Mexico APAC Building Energy Management Systems Market Revenue (Million) Forecast, by Application 2019 & 2032
- Table 24: Rest of Latin America APAC Building Energy Management Systems Market Revenue (Million) Forecast, by Application 2019 & 2032
- Table 25: Global APAC Building Energy Management Systems Market Revenue Million Forecast, by Country 2019 & 2032
- Table 26: APAC Building Energy Management Systems Market Revenue (Million) Forecast, by Application 2019 & 2032
- Table 27: Global APAC Building Energy Management Systems Market Revenue Million Forecast, by Country 2019 & 2032
- Table 28: Saudi Arabia APAC Building Energy Management Systems Market Revenue (Million) Forecast, by Application 2019 & 2032
- Table 29: South Africa APAC Building Energy Management Systems Market Revenue (Million) Forecast, by Application 2019 & 2032
- Table 30: Rest of Middle East APAC Building Energy Management Systems Market Revenue (Million) Forecast, by Application 2019 & 2032
- Table 31: Global APAC Building Energy Management Systems Market Revenue Million Forecast, by Type of Solution 2019 & 2032
- Table 32: Global APAC Building Energy Management Systems Market Revenue Million Forecast, by Distribution Channel 2019 & 2032
- Table 33: Global APAC Building Energy Management Systems Market Revenue Million Forecast, by End-user Application 2019 & 2032
- Table 34: Global APAC Building Energy Management Systems Market Revenue Million Forecast, by Country 2019 & 2032
- Table 35: United States APAC Building Energy Management Systems Market Revenue (Million) Forecast, by Application 2019 & 2032
- Table 36: Canada APAC Building Energy Management Systems Market Revenue (Million) Forecast, by Application 2019 & 2032
- Table 37: Mexico APAC Building Energy Management Systems Market Revenue (Million) Forecast, by Application 2019 & 2032
- Table 38: Global APAC Building Energy Management Systems Market Revenue Million Forecast, by Type of Solution 2019 & 2032
- Table 39: Global APAC Building Energy Management Systems Market Revenue Million Forecast, by Distribution Channel 2019 & 2032
- Table 40: Global APAC Building Energy Management Systems Market Revenue Million Forecast, by End-user Application 2019 & 2032
- Table 41: Global APAC Building Energy Management Systems Market Revenue Million Forecast, by Country 2019 & 2032
- Table 42: Brazil APAC Building Energy Management Systems Market Revenue (Million) Forecast, by Application 2019 & 2032
- Table 43: Argentina APAC Building Energy Management Systems Market Revenue (Million) Forecast, by Application 2019 & 2032
- Table 44: Rest of South America APAC Building Energy Management Systems Market Revenue (Million) Forecast, by Application 2019 & 2032
- Table 45: Global APAC Building Energy Management Systems Market Revenue Million Forecast, by Type of Solution 2019 & 2032
- Table 46: Global APAC Building Energy Management Systems Market Revenue Million Forecast, by Distribution Channel 2019 & 2032
- Table 47: Global APAC Building Energy Management Systems Market Revenue Million Forecast, by End-user Application 2019 & 2032
- Table 48: Global APAC Building Energy Management Systems Market Revenue Million Forecast, by Country 2019 & 2032
- Table 49: United Kingdom APAC Building Energy Management Systems Market Revenue (Million) Forecast, by Application 2019 & 2032
- Table 50: Germany APAC Building Energy Management Systems Market Revenue (Million) Forecast, by Application 2019 & 2032
- Table 51: France APAC Building Energy Management Systems Market Revenue (Million) Forecast, by Application 2019 & 2032
- Table 52: Italy APAC Building Energy Management Systems Market Revenue (Million) Forecast, by Application 2019 & 2032
- Table 53: Spain APAC Building Energy Management Systems Market Revenue (Million) Forecast, by Application 2019 & 2032
- Table 54: Russia APAC Building Energy Management Systems Market Revenue (Million) Forecast, by Application 2019 & 2032
- Table 55: Benelux APAC Building Energy Management Systems Market Revenue (Million) Forecast, by Application 2019 & 2032
- Table 56: Nordics APAC Building Energy Management Systems Market Revenue (Million) Forecast, by Application 2019 & 2032
- Table 57: Rest of Europe APAC Building Energy Management Systems Market Revenue (Million) Forecast, by Application 2019 & 2032
- Table 58: Global APAC Building Energy Management Systems Market Revenue Million Forecast, by Type of Solution 2019 & 2032
- Table 59: Global APAC Building Energy Management Systems Market Revenue Million Forecast, by Distribution Channel 2019 & 2032
- Table 60: Global APAC Building Energy Management Systems Market Revenue Million Forecast, by End-user Application 2019 & 2032
- Table 61: Global APAC Building Energy Management Systems Market Revenue Million Forecast, by Country 2019 & 2032
- Table 62: Turkey APAC Building Energy Management Systems Market Revenue (Million) Forecast, by Application 2019 & 2032
- Table 63: Israel APAC Building Energy Management Systems Market Revenue (Million) Forecast, by Application 2019 & 2032
- Table 64: GCC APAC Building Energy Management Systems Market Revenue (Million) Forecast, by Application 2019 & 2032
- Table 65: North Africa APAC Building Energy Management Systems Market Revenue (Million) Forecast, by Application 2019 & 2032
- Table 66: South Africa APAC Building Energy Management Systems Market Revenue (Million) Forecast, by Application 2019 & 2032
- Table 67: Rest of Middle East & Africa APAC Building Energy Management Systems Market Revenue (Million) Forecast, by Application 2019 & 2032
- Table 68: Global APAC Building Energy Management Systems Market Revenue Million Forecast, by Type of Solution 2019 & 2032
- Table 69: Global APAC Building Energy Management Systems Market Revenue Million Forecast, by Distribution Channel 2019 & 2032
- Table 70: Global APAC Building Energy Management Systems Market Revenue Million Forecast, by End-user Application 2019 & 2032
- Table 71: Global APAC Building Energy Management Systems Market Revenue Million Forecast, by Country 2019 & 2032
- Table 72: China APAC Building Energy Management Systems Market Revenue (Million) Forecast, by Application 2019 & 2032
- Table 73: India APAC Building Energy Management Systems Market Revenue (Million) Forecast, by Application 2019 & 2032
- Table 74: Japan APAC Building Energy Management Systems Market Revenue (Million) Forecast, by Application 2019 & 2032
- Table 75: South Korea APAC Building Energy Management Systems Market Revenue (Million) Forecast, by Application 2019 & 2032
- Table 76: ASEAN APAC Building Energy Management Systems Market Revenue (Million) Forecast, by Application 2019 & 2032
- Table 77: Oceania APAC Building Energy Management Systems Market Revenue (Million) Forecast, by Application 2019 & 2032
- Table 78: Rest of Asia Pacific APAC Building Energy Management Systems Market Revenue (Million) Forecast, by Application 2019 & 2032
Frequently Asked Questions
1. What is the projected Compound Annual Growth Rate (CAGR) of the APAC Building Energy Management Systems Market?
The projected CAGR is approximately 12.30%.
2. Which companies are prominent players in the APAC Building Energy Management Systems Market?
Key companies in the market include Honeywell, Building IQ*List Not Exhaustive, Siemens, Johnson Controls, Trane, Schneider Electric, ABB.
3. What are the main segments of the APAC Building Energy Management Systems Market?
The market segments include Type of Solution, Distribution Channel, End-user Application.
4. Can you provide details about the market size?
The market size is estimated to be USD XX Million as of 2022.
5. What are some drivers contributing to market growth?
Rapid Growing Numbe of End-users; Low Manufacturing Costs.
6. What are the notable trends driving market growth?
The Increase in Demand from the Residential Segment is Expected to Drive the Market.
7. Are there any restraints impacting market growth?
Technical Difficulties.
8. Can you provide examples of recent developments in the market?
August 2022 - Johnson Controls, a global player providing smart, healthy, and sustainable buildings, announced that it partnered with Microsoft Beijing Campus for its ongoing retrofit and optimization of building operations, achieving 27.9% energy savings and ensuring critical equipment uptime to 98%. As a result, the campus has been granted an energy-saving endorsement and financial subsidy by the Beijing Municipal Government and the Haidian District Government.
9. What pricing options are available for accessing the report?
Pricing options include single-user, multi-user, and enterprise licenses priced at USD 4750, USD 4950, and USD 6800 respectively.
10. Is the market size provided in terms of value or volume?
The market size is provided in terms of value, measured in Million.
11. Are there any specific market keywords associated with the report?
Yes, the market keyword associated with the report is "APAC Building Energy Management Systems Market," which aids in identifying and referencing the specific market segment covered.
12. How do I determine which pricing option suits my needs best?
The pricing options vary based on user requirements and access needs. Individual users may opt for single-user licenses, while businesses requiring broader access may choose multi-user or enterprise licenses for cost-effective access to the report.
13. Are there any additional resources or data provided in the APAC Building Energy Management Systems Market report?
While the report offers comprehensive insights, it's advisable to review the specific contents or supplementary materials provided to ascertain if additional resources or data are available.
14. How can I stay updated on further developments or reports in the APAC Building Energy Management Systems Market?
To stay informed about further developments, trends, and reports in the APAC Building Energy Management Systems Market, consider subscribing to industry newsletters, following relevant companies and organizations, or regularly checking reputable industry news sources and publications.
Methodology
Step 1 - Identification of Relevant Samples Size from Population Database


Step 2 - Approaches for Defining Global Market Size (Value, Volume* & Price*)

Note*: In applicable scenarios
Step 3 - Data Sources
Primary Research
- Web Analytics
- Survey Reports
- Research Institute
- Latest Research Reports
- Opinion Leaders
Secondary Research
- Annual Reports
- White Paper
- Latest Press Release
- Industry Association
- Paid Database
- Investor Presentations

Step 4 - Data Triangulation
Involves using different sources of information in order to increase the validity of a study
These sources are likely to be stakeholders in a program - participants, other researchers, program staff, other community members, and so on.
Then we put all data in single framework & apply various statistical tools to find out the dynamic on the market.
During the analysis stage, feedback from the stakeholder groups would be compared to determine areas of agreement as well as areas of divergence
