

Key Insights
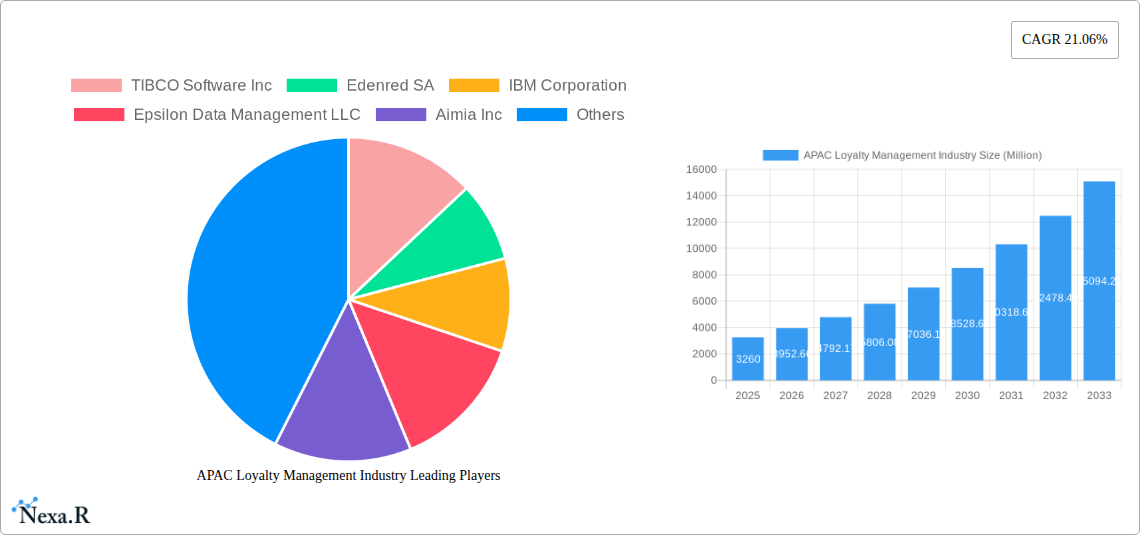
The Asia-Pacific (APAC) loyalty management market is experiencing robust growth, driven by increasing consumer spending, the proliferation of digital technologies, and the rising adoption of personalized marketing strategies. With a 2025 market size of $3.26 billion and a projected Compound Annual Growth Rate (CAGR) of 21.06%, the market is poised for significant expansion through 2033. Key growth drivers include the increasing penetration of smartphones and the rise of e-commerce, enabling businesses to engage with customers digitally and offer personalized loyalty programs. The BFSI (Banking, Financial Services, and Insurance) and consumer goods and retail sectors are leading adopters, leveraging loyalty programs to enhance customer retention and drive repeat business. The increasing preference for personalized rewards and seamless omnichannel experiences is shaping the evolution of loyalty programs, pushing businesses to adopt advanced analytics and AI-driven solutions for better customer understanding and engagement. Competition is intensifying with both established players and agile technology providers vying for market share, leading to innovations in loyalty program design and technology. China, India, and Japan represent the largest market segments within APAC, contributing significantly to the region's overall growth, fueled by their burgeoning middle classes and digital adoption rates. However, factors like data privacy concerns and the need for effective program management across diverse customer segments present challenges for market growth.
The segmentation of the APAC loyalty management market reveals that B2C programs currently dominate, however B2B programs are showing strong growth potential particularly within the IT and Telecom sectors. Geographical distribution highlights the substantial opportunities in developing economies across Southeast Asia, where increasing internet penetration and mobile adoption fuels loyalty program adoption. The market's success hinges on businesses' ability to leverage data effectively, personalize offerings, and ensure seamless integration across all channels to create truly rewarding and engaging experiences for consumers. This requires investment in advanced analytics platforms and robust customer relationship management (CRM) systems, alongside a deep understanding of local consumer preferences. The future success of loyalty management in APAC will depend on adapting to evolving consumer expectations and leveraging technological advancements for greater personalization and effectiveness.
APAC Loyalty Management Industry: Market Report 2019-2033
This comprehensive report provides a detailed analysis of the Asia-Pacific (APAC) Loyalty Management industry, offering invaluable insights for businesses, investors, and industry professionals. Covering the period 2019-2033, with a focus on 2025, this report examines market dynamics, growth trends, key players, and future opportunities across various segments and countries. The report utilizes a wealth of data to provide actionable intelligence, supporting strategic decision-making within this rapidly evolving market. The market value is projected at xx Million in 2025.
APAC Loyalty Management Industry Market Dynamics & Structure
The APAC loyalty management market is characterized by moderate concentration, with several key players dominating specific segments. Technological innovation, particularly in AI and big data analytics, is a primary growth driver, while regulatory frameworks governing data privacy and consumer protection present ongoing challenges. The market witnesses significant M&A activity, reflecting the desire for companies to expand their capabilities and market reach. Competitive substitutes, such as traditional promotional strategies, continue to exist, though their effectiveness is declining compared to targeted loyalty programs. The end-user demographic is diverse, ranging from millennials highly engaged with digital loyalty programs to older generations preferring traditional reward schemes.
- Market Concentration: Moderately concentrated, with top 5 players holding approximately xx% market share in 2025.
- Technological Innovation: AI-powered personalization, blockchain for secure reward management, and omnichannel integration are key drivers.
- Regulatory Framework: Data privacy regulations (e.g., GDPR, CCPA adaptations) influence program design and data usage.
- M&A Activity: An estimated xx M&A deals occurred between 2019-2024, with a predicted xx deals in 2025-2033.
- Competitive Substitutes: Traditional promotional offers, discounts, and coupons remain prevalent but less effective in customer retention.
- End-user Demographics: Significant variation in loyalty program adoption based on age, income, and tech savviness.
APAC Loyalty Management Industry Growth Trends & Insights
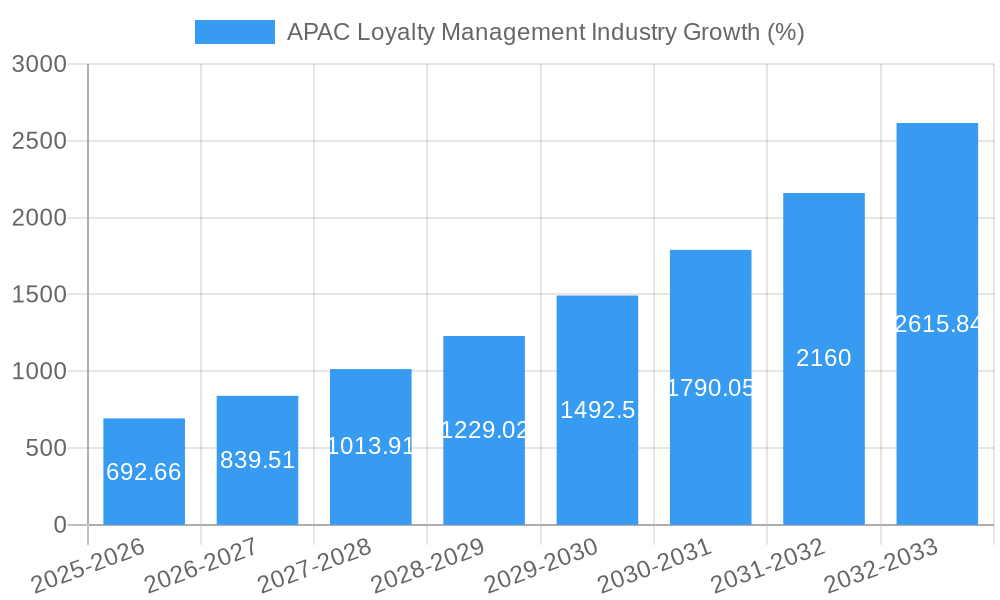
The APAC loyalty management market exhibits robust growth, driven by increasing consumer spending, the widespread adoption of digital technologies, and a growing preference for personalized experiences. The market size expanded from xx Million in 2019 to xx Million in 2024, indicating a strong historical growth trajectory. This growth is projected to continue at a Compound Annual Growth Rate (CAGR) of xx% from 2025 to 2033, reaching an estimated xx Million by 2033. The increasing penetration of smartphones and the rise of e-commerce are significant catalysts. Consumer behavior shifts, including the desire for seamless omnichannel experiences and personalized rewards, are shaping the evolution of loyalty programs. Technological disruptions, like the integration of AI and blockchain, are further enhancing program effectiveness and security. Market penetration is expected to reach xx% by 2033.
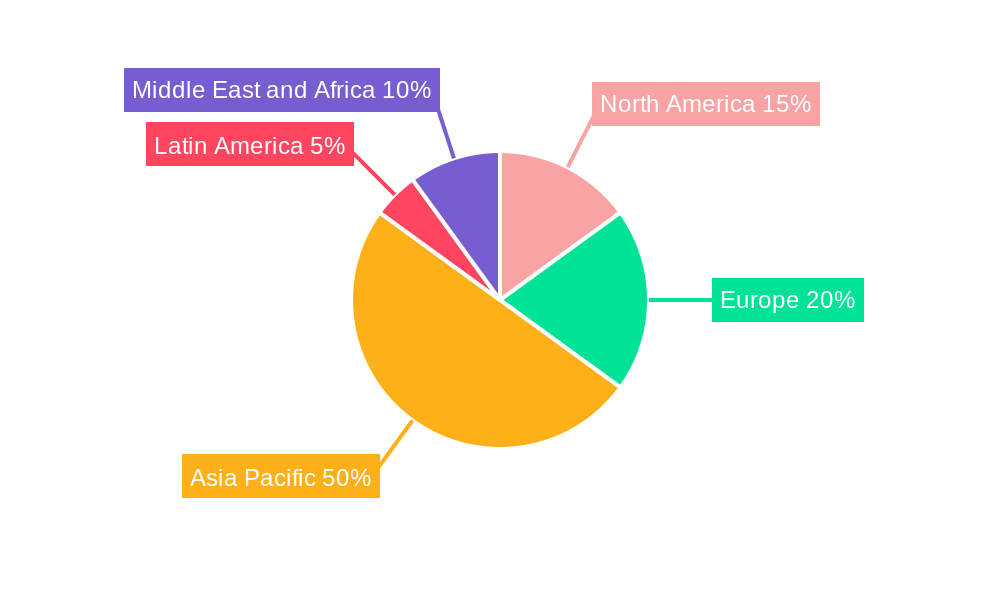
Dominant Regions, Countries, or Segments in APAC Loyalty Management Industry
China and India are the dominant markets in APAC, driven by large populations, rising disposable incomes, and increasing e-commerce adoption. The B2C segment holds a larger market share compared to the B2B segment, reflecting the strong focus on consumer engagement. Within end-user verticals, Consumer Goods and Retail and BFSI (Banking, Financial Services, and Insurance) sectors show significant growth, fuelled by intense competition and the need to enhance customer retention.
- Leading Regions: China and India, accounting for xx% and xx% of the market respectively in 2025.
- Leading Segment (Loyalty Program Type): B2C, holding approximately xx% market share.
- Leading End-user Verticals: Consumer Goods & Retail, and BFSI, driven by high customer acquisition costs and intense competition.
- Key Growth Drivers: Increasing disposable incomes, expanding middle class, rapid digitalization, government initiatives promoting financial inclusion (India), and a rising focus on customer experience.
APAC Loyalty Management Industry Product Landscape
Loyalty management solutions are increasingly sophisticated, integrating advanced analytics, AI-powered personalization, and seamless omnichannel experiences. Products leverage big data to understand customer behavior and preferences, enabling hyper-personalized reward programs and targeted promotions. Key performance indicators (KPIs) include customer lifetime value (CLTV), customer retention rate, and return on investment (ROI) of loyalty programs. Unique selling propositions often center around platform scalability, ease of integration, and advanced analytics capabilities.
Key Drivers, Barriers & Challenges in APAC Loyalty Management Industry
Key Drivers:
- Rapid digitalization and smartphone penetration.
- Increasing consumer spending and a desire for personalized experiences.
- Growing competition across various industries driving the need for improved customer retention strategies.
Challenges & Restraints:
- Data privacy regulations and concerns around data security.
- High implementation and maintenance costs of advanced loyalty programs.
- Competition from established players and new entrants.
- Supply chain disruptions affecting the timely delivery of rewards or services (impact estimated at xx Million in lost revenue in 2024).
Emerging Opportunities in APAP Loyalty Management Industry
- Untapped potential in smaller APAC markets (e.g., Vietnam, Philippines).
- Growth of subscription-based loyalty programs.
- Integration of loyalty programs with fintech solutions.
- Increasing demand for gamified and experiential loyalty programs.
Growth Accelerators in the APAC Loyalty Management Industry
Technological breakthroughs in AI and machine learning will enhance personalization and predictive analytics. Strategic partnerships between loyalty providers and fintech companies will streamline reward redemption. Expansion into new markets and vertical segments will unlock significant growth opportunities, as will the adoption of blockchain technology to improve security and transparency.
Key Players Shaping the APAC Loyalty Management Industry Market
- TIBCO Software Inc
- Edenred SA
- IBM Corporation
- Epsilon Data Management LLC
- Aimia Inc
- Capillary Technologies
- Rewardz SG
- Maritz Holdings Inc
- Comarch SA
- Oracle Corporation
- Cheetah Digital
Notable Milestones in APAC Loyalty Management Industry Sector
- July 2022: Tranxactor Group selects Oracle Cloud Infrastructure (OCI) for enhanced customer engagement.
- September 2022: Capillary Technologies partners with KPMG India to offer AI-based loyalty solutions.
- September 2022: Epsilon releases the Epsilon Loyalty Index Australia 2022.
In-Depth APAC Loyalty Management Industry Market Outlook
The APAC loyalty management market is poised for sustained growth, driven by technological advancements, increasing digital adoption, and a focus on personalized customer experiences. Strategic partnerships and expansion into untapped markets will be key to maximizing market potential. Companies that leverage AI, data analytics, and omnichannel strategies will gain a competitive edge. The market is expected to witness significant innovation and consolidation in the coming years.
APAC Loyalty Management Industry Segmentation
-
1. Loyalty Program Type
- 1.1. Business-to-consumer (B2C)
- 1.2. Business-to-business (B2B)
-
2. End-user Vertical
- 2.1. BFSI
- 2.2. Consumer Goods and Retail
- 2.3. IT and Telecom
- 2.4. Travel and Hospitality
- 2.5. Other End-user Verticals
APAC Loyalty Management Industry Segmentation By Geography
-
1. North America
- 1.1. United States
- 1.2. Canada
- 1.3. Mexico
-
2. South America
- 2.1. Brazil
- 2.2. Argentina
- 2.3. Rest of South America
-
3. Europe
- 3.1. United Kingdom
- 3.2. Germany
- 3.3. France
- 3.4. Italy
- 3.5. Spain
- 3.6. Russia
- 3.7. Benelux
- 3.8. Nordics
- 3.9. Rest of Europe
-
4. Middle East & Africa
- 4.1. Turkey
- 4.2. Israel
- 4.3. GCC
- 4.4. North Africa
- 4.5. South Africa
- 4.6. Rest of Middle East & Africa
-
5. Asia Pacific
- 5.1. China
- 5.2. India
- 5.3. Japan
- 5.4. South Korea
- 5.5. ASEAN
- 5.6. Oceania
- 5.7. Rest of Asia Pacific
APAC Loyalty Management Industry REPORT HIGHLIGHTS
| Aspects | Details |
|---|---|
| Study Period | 2019-2033 |
| Base Year | 2024 |
| Estimated Year | 2025 |
| Forecast Period | 2025-2033 |
| Historical Period | 2019-2024 |
| Growth Rate | CAGR of 21.06% from 2019-2033 |
| Segmentation |
|
Table of Contents
- 1. Introduction
- 1.1. Research Scope
- 1.2. Market Segmentation
- 1.3. Research Methodology
- 1.4. Definitions and Assumptions
- 2. Executive Summary
- 2.1. Introduction
- 3. Market Dynamics
- 3.1. Introduction
- 3.2. Market Drivers
- 3.2.1. Rise of E-Commerce; Flourishing Startup Culture
- 3.3. Market Restrains
- 3.3.1. Slow Penetration Rate in Developing Countries
- 3.4. Market Trends
- 3.4.1. BFSI Segment is Expected to Witness the Highest Growth
- 4. Market Factor Analysis
- 4.1. Porters Five Forces
- 4.2. Supply/Value Chain
- 4.3. PESTEL analysis
- 4.4. Market Entropy
- 4.5. Patent/Trademark Analysis
- 5. Global APAC Loyalty Management Industry Analysis, Insights and Forecast, 2019-2031
- 5.1. Market Analysis, Insights and Forecast - by Loyalty Program Type
- 5.1.1. Business-to-consumer (B2C)
- 5.1.2. Business-to-business (B2B)
- 5.2. Market Analysis, Insights and Forecast - by End-user Vertical
- 5.2.1. BFSI
- 5.2.2. Consumer Goods and Retail
- 5.2.3. IT and Telecom
- 5.2.4. Travel and Hospitality
- 5.2.5. Other End-user Verticals
- 5.3. Market Analysis, Insights and Forecast - by Region
- 5.3.1. North America
- 5.3.2. South America
- 5.3.3. Europe
- 5.3.4. Middle East & Africa
- 5.3.5. Asia Pacific
- 5.1. Market Analysis, Insights and Forecast - by Loyalty Program Type
- 6. North America APAC Loyalty Management Industry Analysis, Insights and Forecast, 2019-2031
- 6.1. Market Analysis, Insights and Forecast - by Loyalty Program Type
- 6.1.1. Business-to-consumer (B2C)
- 6.1.2. Business-to-business (B2B)
- 6.2. Market Analysis, Insights and Forecast - by End-user Vertical
- 6.2.1. BFSI
- 6.2.2. Consumer Goods and Retail
- 6.2.3. IT and Telecom
- 6.2.4. Travel and Hospitality
- 6.2.5. Other End-user Verticals
- 6.1. Market Analysis, Insights and Forecast - by Loyalty Program Type
- 7. South America APAC Loyalty Management Industry Analysis, Insights and Forecast, 2019-2031
- 7.1. Market Analysis, Insights and Forecast - by Loyalty Program Type
- 7.1.1. Business-to-consumer (B2C)
- 7.1.2. Business-to-business (B2B)
- 7.2. Market Analysis, Insights and Forecast - by End-user Vertical
- 7.2.1. BFSI
- 7.2.2. Consumer Goods and Retail
- 7.2.3. IT and Telecom
- 7.2.4. Travel and Hospitality
- 7.2.5. Other End-user Verticals
- 7.1. Market Analysis, Insights and Forecast - by Loyalty Program Type
- 8. Europe APAC Loyalty Management Industry Analysis, Insights and Forecast, 2019-2031
- 8.1. Market Analysis, Insights and Forecast - by Loyalty Program Type
- 8.1.1. Business-to-consumer (B2C)
- 8.1.2. Business-to-business (B2B)
- 8.2. Market Analysis, Insights and Forecast - by End-user Vertical
- 8.2.1. BFSI
- 8.2.2. Consumer Goods and Retail
- 8.2.3. IT and Telecom
- 8.2.4. Travel and Hospitality
- 8.2.5. Other End-user Verticals
- 8.1. Market Analysis, Insights and Forecast - by Loyalty Program Type
- 9. Middle East & Africa APAC Loyalty Management Industry Analysis, Insights and Forecast, 2019-2031
- 9.1. Market Analysis, Insights and Forecast - by Loyalty Program Type
- 9.1.1. Business-to-consumer (B2C)
- 9.1.2. Business-to-business (B2B)
- 9.2. Market Analysis, Insights and Forecast - by End-user Vertical
- 9.2.1. BFSI
- 9.2.2. Consumer Goods and Retail
- 9.2.3. IT and Telecom
- 9.2.4. Travel and Hospitality
- 9.2.5. Other End-user Verticals
- 9.1. Market Analysis, Insights and Forecast - by Loyalty Program Type
- 10. Asia Pacific APAC Loyalty Management Industry Analysis, Insights and Forecast, 2019-2031
- 10.1. Market Analysis, Insights and Forecast - by Loyalty Program Type
- 10.1.1. Business-to-consumer (B2C)
- 10.1.2. Business-to-business (B2B)
- 10.2. Market Analysis, Insights and Forecast - by End-user Vertical
- 10.2.1. BFSI
- 10.2.2. Consumer Goods and Retail
- 10.2.3. IT and Telecom
- 10.2.4. Travel and Hospitality
- 10.2.5. Other End-user Verticals
- 10.1. Market Analysis, Insights and Forecast - by Loyalty Program Type
- 11. North America APAC Loyalty Management Industry Analysis, Insights and Forecast, 2019-2031
- 11.1. Market Analysis, Insights and Forecast - By Country/Sub-region
- 11.1.1 United States
- 11.1.2 Canada
- 12. Europe APAC Loyalty Management Industry Analysis, Insights and Forecast, 2019-2031
- 12.1. Market Analysis, Insights and Forecast - By Country/Sub-region
- 12.1.1 Germany
- 12.1.2 UK
- 12.1.3 France
- 12.1.4 Spain
- 12.1.5 Rest of Europe
- 13. Asia Pacific APAC Loyalty Management Industry Analysis, Insights and Forecast, 2019-2031
- 13.1. Market Analysis, Insights and Forecast - By Country/Sub-region
- 13.1.1 China
- 13.1.2 Japan
- 13.1.3 India
- 13.1.4 Australia
- 13.1.5 Rest of Asia Pacific
- 14. Latin America APAC Loyalty Management Industry Analysis, Insights and Forecast, 2019-2031
- 14.1. Market Analysis, Insights and Forecast - By Country/Sub-region
- 14.1.1 Brazil
- 14.1.2 Mexico
- 14.1.3 Argentina
- 14.1.4 Rest of Latin America
- 15. Middle East and Africa APAC Loyalty Management Industry Analysis, Insights and Forecast, 2019-2031
- 15.1. Market Analysis, Insights and Forecast - By Country/Sub-region
- 15.1.1 UAE
- 15.1.2 Saudi Arabia
- 15.1.3 South Africa
- 15.1.4 Rest of Middle East and Africa
- 16. Competitive Analysis
- 16.1. Global Market Share Analysis 2024
- 16.2. Company Profiles
- 16.2.1 TIBCO Software Inc
- 16.2.1.1. Overview
- 16.2.1.2. Products
- 16.2.1.3. SWOT Analysis
- 16.2.1.4. Recent Developments
- 16.2.1.5. Financials (Based on Availability)
- 16.2.2 Edenred SA
- 16.2.2.1. Overview
- 16.2.2.2. Products
- 16.2.2.3. SWOT Analysis
- 16.2.2.4. Recent Developments
- 16.2.2.5. Financials (Based on Availability)
- 16.2.3 IBM Corporation
- 16.2.3.1. Overview
- 16.2.3.2. Products
- 16.2.3.3. SWOT Analysis
- 16.2.3.4. Recent Developments
- 16.2.3.5. Financials (Based on Availability)
- 16.2.4 Epsilon Data Management LLC
- 16.2.4.1. Overview
- 16.2.4.2. Products
- 16.2.4.3. SWOT Analysis
- 16.2.4.4. Recent Developments
- 16.2.4.5. Financials (Based on Availability)
- 16.2.5 Aimia Inc
- 16.2.5.1. Overview
- 16.2.5.2. Products
- 16.2.5.3. SWOT Analysis
- 16.2.5.4. Recent Developments
- 16.2.5.5. Financials (Based on Availability)
- 16.2.6 Capillary Technologies
- 16.2.6.1. Overview
- 16.2.6.2. Products
- 16.2.6.3. SWOT Analysis
- 16.2.6.4. Recent Developments
- 16.2.6.5. Financials (Based on Availability)
- 16.2.7 Rewardz SG
- 16.2.7.1. Overview
- 16.2.7.2. Products
- 16.2.7.3. SWOT Analysis
- 16.2.7.4. Recent Developments
- 16.2.7.5. Financials (Based on Availability)
- 16.2.8 Maritz Holdings Inc
- 16.2.8.1. Overview
- 16.2.8.2. Products
- 16.2.8.3. SWOT Analysis
- 16.2.8.4. Recent Developments
- 16.2.8.5. Financials (Based on Availability)
- 16.2.9 Comarch SA
- 16.2.9.1. Overview
- 16.2.9.2. Products
- 16.2.9.3. SWOT Analysis
- 16.2.9.4. Recent Developments
- 16.2.9.5. Financials (Based on Availability)
- 16.2.10 Oracle Corporation
- 16.2.10.1. Overview
- 16.2.10.2. Products
- 16.2.10.3. SWOT Analysis
- 16.2.10.4. Recent Developments
- 16.2.10.5. Financials (Based on Availability)
- 16.2.11 Cheetah Digital
- 16.2.11.1. Overview
- 16.2.11.2. Products
- 16.2.11.3. SWOT Analysis
- 16.2.11.4. Recent Developments
- 16.2.11.5. Financials (Based on Availability)
- 16.2.1 TIBCO Software Inc
List of Figures
- Figure 1: Global APAC Loyalty Management Industry Revenue Breakdown (Million, %) by Region 2024 & 2032
- Figure 2: Global APAC Loyalty Management Industry Volume Breakdown (K Unit, %) by Region 2024 & 2032
- Figure 3: North America APAC Loyalty Management Industry Revenue (Million), by Country 2024 & 2032
- Figure 4: North America APAC Loyalty Management Industry Volume (K Unit), by Country 2024 & 2032
- Figure 5: North America APAC Loyalty Management Industry Revenue Share (%), by Country 2024 & 2032
- Figure 6: North America APAC Loyalty Management Industry Volume Share (%), by Country 2024 & 2032
- Figure 7: Europe APAC Loyalty Management Industry Revenue (Million), by Country 2024 & 2032
- Figure 8: Europe APAC Loyalty Management Industry Volume (K Unit), by Country 2024 & 2032
- Figure 9: Europe APAC Loyalty Management Industry Revenue Share (%), by Country 2024 & 2032
- Figure 10: Europe APAC Loyalty Management Industry Volume Share (%), by Country 2024 & 2032
- Figure 11: Asia Pacific APAC Loyalty Management Industry Revenue (Million), by Country 2024 & 2032
- Figure 12: Asia Pacific APAC Loyalty Management Industry Volume (K Unit), by Country 2024 & 2032
- Figure 13: Asia Pacific APAC Loyalty Management Industry Revenue Share (%), by Country 2024 & 2032
- Figure 14: Asia Pacific APAC Loyalty Management Industry Volume Share (%), by Country 2024 & 2032
- Figure 15: Latin America APAC Loyalty Management Industry Revenue (Million), by Country 2024 & 2032
- Figure 16: Latin America APAC Loyalty Management Industry Volume (K Unit), by Country 2024 & 2032
- Figure 17: Latin America APAC Loyalty Management Industry Revenue Share (%), by Country 2024 & 2032
- Figure 18: Latin America APAC Loyalty Management Industry Volume Share (%), by Country 2024 & 2032
- Figure 19: Middle East and Africa APAC Loyalty Management Industry Revenue (Million), by Country 2024 & 2032
- Figure 20: Middle East and Africa APAC Loyalty Management Industry Volume (K Unit), by Country 2024 & 2032
- Figure 21: Middle East and Africa APAC Loyalty Management Industry Revenue Share (%), by Country 2024 & 2032
- Figure 22: Middle East and Africa APAC Loyalty Management Industry Volume Share (%), by Country 2024 & 2032
- Figure 23: North America APAC Loyalty Management Industry Revenue (Million), by Loyalty Program Type 2024 & 2032
- Figure 24: North America APAC Loyalty Management Industry Volume (K Unit), by Loyalty Program Type 2024 & 2032
- Figure 25: North America APAC Loyalty Management Industry Revenue Share (%), by Loyalty Program Type 2024 & 2032
- Figure 26: North America APAC Loyalty Management Industry Volume Share (%), by Loyalty Program Type 2024 & 2032
- Figure 27: North America APAC Loyalty Management Industry Revenue (Million), by End-user Vertical 2024 & 2032
- Figure 28: North America APAC Loyalty Management Industry Volume (K Unit), by End-user Vertical 2024 & 2032
- Figure 29: North America APAC Loyalty Management Industry Revenue Share (%), by End-user Vertical 2024 & 2032
- Figure 30: North America APAC Loyalty Management Industry Volume Share (%), by End-user Vertical 2024 & 2032
- Figure 31: North America APAC Loyalty Management Industry Revenue (Million), by Country 2024 & 2032
- Figure 32: North America APAC Loyalty Management Industry Volume (K Unit), by Country 2024 & 2032
- Figure 33: North America APAC Loyalty Management Industry Revenue Share (%), by Country 2024 & 2032
- Figure 34: North America APAC Loyalty Management Industry Volume Share (%), by Country 2024 & 2032
- Figure 35: South America APAC Loyalty Management Industry Revenue (Million), by Loyalty Program Type 2024 & 2032
- Figure 36: South America APAC Loyalty Management Industry Volume (K Unit), by Loyalty Program Type 2024 & 2032
- Figure 37: South America APAC Loyalty Management Industry Revenue Share (%), by Loyalty Program Type 2024 & 2032
- Figure 38: South America APAC Loyalty Management Industry Volume Share (%), by Loyalty Program Type 2024 & 2032
- Figure 39: South America APAC Loyalty Management Industry Revenue (Million), by End-user Vertical 2024 & 2032
- Figure 40: South America APAC Loyalty Management Industry Volume (K Unit), by End-user Vertical 2024 & 2032
- Figure 41: South America APAC Loyalty Management Industry Revenue Share (%), by End-user Vertical 2024 & 2032
- Figure 42: South America APAC Loyalty Management Industry Volume Share (%), by End-user Vertical 2024 & 2032
- Figure 43: South America APAC Loyalty Management Industry Revenue (Million), by Country 2024 & 2032
- Figure 44: South America APAC Loyalty Management Industry Volume (K Unit), by Country 2024 & 2032
- Figure 45: South America APAC Loyalty Management Industry Revenue Share (%), by Country 2024 & 2032
- Figure 46: South America APAC Loyalty Management Industry Volume Share (%), by Country 2024 & 2032
- Figure 47: Europe APAC Loyalty Management Industry Revenue (Million), by Loyalty Program Type 2024 & 2032
- Figure 48: Europe APAC Loyalty Management Industry Volume (K Unit), by Loyalty Program Type 2024 & 2032
- Figure 49: Europe APAC Loyalty Management Industry Revenue Share (%), by Loyalty Program Type 2024 & 2032
- Figure 50: Europe APAC Loyalty Management Industry Volume Share (%), by Loyalty Program Type 2024 & 2032
- Figure 51: Europe APAC Loyalty Management Industry Revenue (Million), by End-user Vertical 2024 & 2032
- Figure 52: Europe APAC Loyalty Management Industry Volume (K Unit), by End-user Vertical 2024 & 2032
- Figure 53: Europe APAC Loyalty Management Industry Revenue Share (%), by End-user Vertical 2024 & 2032
- Figure 54: Europe APAC Loyalty Management Industry Volume Share (%), by End-user Vertical 2024 & 2032
- Figure 55: Europe APAC Loyalty Management Industry Revenue (Million), by Country 2024 & 2032
- Figure 56: Europe APAC Loyalty Management Industry Volume (K Unit), by Country 2024 & 2032
- Figure 57: Europe APAC Loyalty Management Industry Revenue Share (%), by Country 2024 & 2032
- Figure 58: Europe APAC Loyalty Management Industry Volume Share (%), by Country 2024 & 2032
- Figure 59: Middle East & Africa APAC Loyalty Management Industry Revenue (Million), by Loyalty Program Type 2024 & 2032
- Figure 60: Middle East & Africa APAC Loyalty Management Industry Volume (K Unit), by Loyalty Program Type 2024 & 2032
- Figure 61: Middle East & Africa APAC Loyalty Management Industry Revenue Share (%), by Loyalty Program Type 2024 & 2032
- Figure 62: Middle East & Africa APAC Loyalty Management Industry Volume Share (%), by Loyalty Program Type 2024 & 2032
- Figure 63: Middle East & Africa APAC Loyalty Management Industry Revenue (Million), by End-user Vertical 2024 & 2032
- Figure 64: Middle East & Africa APAC Loyalty Management Industry Volume (K Unit), by End-user Vertical 2024 & 2032
- Figure 65: Middle East & Africa APAC Loyalty Management Industry Revenue Share (%), by End-user Vertical 2024 & 2032
- Figure 66: Middle East & Africa APAC Loyalty Management Industry Volume Share (%), by End-user Vertical 2024 & 2032
- Figure 67: Middle East & Africa APAC Loyalty Management Industry Revenue (Million), by Country 2024 & 2032
- Figure 68: Middle East & Africa APAC Loyalty Management Industry Volume (K Unit), by Country 2024 & 2032
- Figure 69: Middle East & Africa APAC Loyalty Management Industry Revenue Share (%), by Country 2024 & 2032
- Figure 70: Middle East & Africa APAC Loyalty Management Industry Volume Share (%), by Country 2024 & 2032
- Figure 71: Asia Pacific APAC Loyalty Management Industry Revenue (Million), by Loyalty Program Type 2024 & 2032
- Figure 72: Asia Pacific APAC Loyalty Management Industry Volume (K Unit), by Loyalty Program Type 2024 & 2032
- Figure 73: Asia Pacific APAC Loyalty Management Industry Revenue Share (%), by Loyalty Program Type 2024 & 2032
- Figure 74: Asia Pacific APAC Loyalty Management Industry Volume Share (%), by Loyalty Program Type 2024 & 2032
- Figure 75: Asia Pacific APAC Loyalty Management Industry Revenue (Million), by End-user Vertical 2024 & 2032
- Figure 76: Asia Pacific APAC Loyalty Management Industry Volume (K Unit), by End-user Vertical 2024 & 2032
- Figure 77: Asia Pacific APAC Loyalty Management Industry Revenue Share (%), by End-user Vertical 2024 & 2032
- Figure 78: Asia Pacific APAC Loyalty Management Industry Volume Share (%), by End-user Vertical 2024 & 2032
- Figure 79: Asia Pacific APAC Loyalty Management Industry Revenue (Million), by Country 2024 & 2032
- Figure 80: Asia Pacific APAC Loyalty Management Industry Volume (K Unit), by Country 2024 & 2032
- Figure 81: Asia Pacific APAC Loyalty Management Industry Revenue Share (%), by Country 2024 & 2032
- Figure 82: Asia Pacific APAC Loyalty Management Industry Volume Share (%), by Country 2024 & 2032
List of Tables
- Table 1: Global APAC Loyalty Management Industry Revenue Million Forecast, by Region 2019 & 2032
- Table 2: Global APAC Loyalty Management Industry Volume K Unit Forecast, by Region 2019 & 2032
- Table 3: Global APAC Loyalty Management Industry Revenue Million Forecast, by Loyalty Program Type 2019 & 2032
- Table 4: Global APAC Loyalty Management Industry Volume K Unit Forecast, by Loyalty Program Type 2019 & 2032
- Table 5: Global APAC Loyalty Management Industry Revenue Million Forecast, by End-user Vertical 2019 & 2032
- Table 6: Global APAC Loyalty Management Industry Volume K Unit Forecast, by End-user Vertical 2019 & 2032
- Table 7: Global APAC Loyalty Management Industry Revenue Million Forecast, by Region 2019 & 2032
- Table 8: Global APAC Loyalty Management Industry Volume K Unit Forecast, by Region 2019 & 2032
- Table 9: Global APAC Loyalty Management Industry Revenue Million Forecast, by Country 2019 & 2032
- Table 10: Global APAC Loyalty Management Industry Volume K Unit Forecast, by Country 2019 & 2032
- Table 11: United States APAC Loyalty Management Industry Revenue (Million) Forecast, by Application 2019 & 2032
- Table 12: United States APAC Loyalty Management Industry Volume (K Unit) Forecast, by Application 2019 & 2032
- Table 13: Canada APAC Loyalty Management Industry Revenue (Million) Forecast, by Application 2019 & 2032
- Table 14: Canada APAC Loyalty Management Industry Volume (K Unit) Forecast, by Application 2019 & 2032
- Table 15: Global APAC Loyalty Management Industry Revenue Million Forecast, by Country 2019 & 2032
- Table 16: Global APAC Loyalty Management Industry Volume K Unit Forecast, by Country 2019 & 2032
- Table 17: Germany APAC Loyalty Management Industry Revenue (Million) Forecast, by Application 2019 & 2032
- Table 18: Germany APAC Loyalty Management Industry Volume (K Unit) Forecast, by Application 2019 & 2032
- Table 19: UK APAC Loyalty Management Industry Revenue (Million) Forecast, by Application 2019 & 2032
- Table 20: UK APAC Loyalty Management Industry Volume (K Unit) Forecast, by Application 2019 & 2032
- Table 21: France APAC Loyalty Management Industry Revenue (Million) Forecast, by Application 2019 & 2032
- Table 22: France APAC Loyalty Management Industry Volume (K Unit) Forecast, by Application 2019 & 2032
- Table 23: Spain APAC Loyalty Management Industry Revenue (Million) Forecast, by Application 2019 & 2032
- Table 24: Spain APAC Loyalty Management Industry Volume (K Unit) Forecast, by Application 2019 & 2032
- Table 25: Rest of Europe APAC Loyalty Management Industry Revenue (Million) Forecast, by Application 2019 & 2032
- Table 26: Rest of Europe APAC Loyalty Management Industry Volume (K Unit) Forecast, by Application 2019 & 2032
- Table 27: Global APAC Loyalty Management Industry Revenue Million Forecast, by Country 2019 & 2032
- Table 28: Global APAC Loyalty Management Industry Volume K Unit Forecast, by Country 2019 & 2032
- Table 29: China APAC Loyalty Management Industry Revenue (Million) Forecast, by Application 2019 & 2032
- Table 30: China APAC Loyalty Management Industry Volume (K Unit) Forecast, by Application 2019 & 2032
- Table 31: Japan APAC Loyalty Management Industry Revenue (Million) Forecast, by Application 2019 & 2032
- Table 32: Japan APAC Loyalty Management Industry Volume (K Unit) Forecast, by Application 2019 & 2032
- Table 33: India APAC Loyalty Management Industry Revenue (Million) Forecast, by Application 2019 & 2032
- Table 34: India APAC Loyalty Management Industry Volume (K Unit) Forecast, by Application 2019 & 2032
- Table 35: Australia APAC Loyalty Management Industry Revenue (Million) Forecast, by Application 2019 & 2032
- Table 36: Australia APAC Loyalty Management Industry Volume (K Unit) Forecast, by Application 2019 & 2032
- Table 37: Rest of Asia Pacific APAC Loyalty Management Industry Revenue (Million) Forecast, by Application 2019 & 2032
- Table 38: Rest of Asia Pacific APAC Loyalty Management Industry Volume (K Unit) Forecast, by Application 2019 & 2032
- Table 39: Global APAC Loyalty Management Industry Revenue Million Forecast, by Country 2019 & 2032
- Table 40: Global APAC Loyalty Management Industry Volume K Unit Forecast, by Country 2019 & 2032
- Table 41: Brazil APAC Loyalty Management Industry Revenue (Million) Forecast, by Application 2019 & 2032
- Table 42: Brazil APAC Loyalty Management Industry Volume (K Unit) Forecast, by Application 2019 & 2032
- Table 43: Mexico APAC Loyalty Management Industry Revenue (Million) Forecast, by Application 2019 & 2032
- Table 44: Mexico APAC Loyalty Management Industry Volume (K Unit) Forecast, by Application 2019 & 2032
- Table 45: Argentina APAC Loyalty Management Industry Revenue (Million) Forecast, by Application 2019 & 2032
- Table 46: Argentina APAC Loyalty Management Industry Volume (K Unit) Forecast, by Application 2019 & 2032
- Table 47: Rest of Latin America APAC Loyalty Management Industry Revenue (Million) Forecast, by Application 2019 & 2032
- Table 48: Rest of Latin America APAC Loyalty Management Industry Volume (K Unit) Forecast, by Application 2019 & 2032
- Table 49: Global APAC Loyalty Management Industry Revenue Million Forecast, by Country 2019 & 2032
- Table 50: Global APAC Loyalty Management Industry Volume K Unit Forecast, by Country 2019 & 2032
- Table 51: UAE APAC Loyalty Management Industry Revenue (Million) Forecast, by Application 2019 & 2032
- Table 52: UAE APAC Loyalty Management Industry Volume (K Unit) Forecast, by Application 2019 & 2032
- Table 53: Saudi Arabia APAC Loyalty Management Industry Revenue (Million) Forecast, by Application 2019 & 2032
- Table 54: Saudi Arabia APAC Loyalty Management Industry Volume (K Unit) Forecast, by Application 2019 & 2032
- Table 55: South Africa APAC Loyalty Management Industry Revenue (Million) Forecast, by Application 2019 & 2032
- Table 56: South Africa APAC Loyalty Management Industry Volume (K Unit) Forecast, by Application 2019 & 2032
- Table 57: Rest of Middle East and Africa APAC Loyalty Management Industry Revenue (Million) Forecast, by Application 2019 & 2032
- Table 58: Rest of Middle East and Africa APAC Loyalty Management Industry Volume (K Unit) Forecast, by Application 2019 & 2032
- Table 59: Global APAC Loyalty Management Industry Revenue Million Forecast, by Loyalty Program Type 2019 & 2032
- Table 60: Global APAC Loyalty Management Industry Volume K Unit Forecast, by Loyalty Program Type 2019 & 2032
- Table 61: Global APAC Loyalty Management Industry Revenue Million Forecast, by End-user Vertical 2019 & 2032
- Table 62: Global APAC Loyalty Management Industry Volume K Unit Forecast, by End-user Vertical 2019 & 2032
- Table 63: Global APAC Loyalty Management Industry Revenue Million Forecast, by Country 2019 & 2032
- Table 64: Global APAC Loyalty Management Industry Volume K Unit Forecast, by Country 2019 & 2032
- Table 65: United States APAC Loyalty Management Industry Revenue (Million) Forecast, by Application 2019 & 2032
- Table 66: United States APAC Loyalty Management Industry Volume (K Unit) Forecast, by Application 2019 & 2032
- Table 67: Canada APAC Loyalty Management Industry Revenue (Million) Forecast, by Application 2019 & 2032
- Table 68: Canada APAC Loyalty Management Industry Volume (K Unit) Forecast, by Application 2019 & 2032
- Table 69: Mexico APAC Loyalty Management Industry Revenue (Million) Forecast, by Application 2019 & 2032
- Table 70: Mexico APAC Loyalty Management Industry Volume (K Unit) Forecast, by Application 2019 & 2032
- Table 71: Global APAC Loyalty Management Industry Revenue Million Forecast, by Loyalty Program Type 2019 & 2032
- Table 72: Global APAC Loyalty Management Industry Volume K Unit Forecast, by Loyalty Program Type 2019 & 2032
- Table 73: Global APAC Loyalty Management Industry Revenue Million Forecast, by End-user Vertical 2019 & 2032
- Table 74: Global APAC Loyalty Management Industry Volume K Unit Forecast, by End-user Vertical 2019 & 2032
- Table 75: Global APAC Loyalty Management Industry Revenue Million Forecast, by Country 2019 & 2032
- Table 76: Global APAC Loyalty Management Industry Volume K Unit Forecast, by Country 2019 & 2032
- Table 77: Brazil APAC Loyalty Management Industry Revenue (Million) Forecast, by Application 2019 & 2032
- Table 78: Brazil APAC Loyalty Management Industry Volume (K Unit) Forecast, by Application 2019 & 2032
- Table 79: Argentina APAC Loyalty Management Industry Revenue (Million) Forecast, by Application 2019 & 2032
- Table 80: Argentina APAC Loyalty Management Industry Volume (K Unit) Forecast, by Application 2019 & 2032
- Table 81: Rest of South America APAC Loyalty Management Industry Revenue (Million) Forecast, by Application 2019 & 2032
- Table 82: Rest of South America APAC Loyalty Management Industry Volume (K Unit) Forecast, by Application 2019 & 2032
- Table 83: Global APAC Loyalty Management Industry Revenue Million Forecast, by Loyalty Program Type 2019 & 2032
- Table 84: Global APAC Loyalty Management Industry Volume K Unit Forecast, by Loyalty Program Type 2019 & 2032
- Table 85: Global APAC Loyalty Management Industry Revenue Million Forecast, by End-user Vertical 2019 & 2032
- Table 86: Global APAC Loyalty Management Industry Volume K Unit Forecast, by End-user Vertical 2019 & 2032
- Table 87: Global APAC Loyalty Management Industry Revenue Million Forecast, by Country 2019 & 2032
- Table 88: Global APAC Loyalty Management Industry Volume K Unit Forecast, by Country 2019 & 2032
- Table 89: United Kingdom APAC Loyalty Management Industry Revenue (Million) Forecast, by Application 2019 & 2032
- Table 90: United Kingdom APAC Loyalty Management Industry Volume (K Unit) Forecast, by Application 2019 & 2032
- Table 91: Germany APAC Loyalty Management Industry Revenue (Million) Forecast, by Application 2019 & 2032
- Table 92: Germany APAC Loyalty Management Industry Volume (K Unit) Forecast, by Application 2019 & 2032
- Table 93: France APAC Loyalty Management Industry Revenue (Million) Forecast, by Application 2019 & 2032
- Table 94: France APAC Loyalty Management Industry Volume (K Unit) Forecast, by Application 2019 & 2032
- Table 95: Italy APAC Loyalty Management Industry Revenue (Million) Forecast, by Application 2019 & 2032
- Table 96: Italy APAC Loyalty Management Industry Volume (K Unit) Forecast, by Application 2019 & 2032
- Table 97: Spain APAC Loyalty Management Industry Revenue (Million) Forecast, by Application 2019 & 2032
- Table 98: Spain APAC Loyalty Management Industry Volume (K Unit) Forecast, by Application 2019 & 2032
- Table 99: Russia APAC Loyalty Management Industry Revenue (Million) Forecast, by Application 2019 & 2032
- Table 100: Russia APAC Loyalty Management Industry Volume (K Unit) Forecast, by Application 2019 & 2032
- Table 101: Benelux APAC Loyalty Management Industry Revenue (Million) Forecast, by Application 2019 & 2032
- Table 102: Benelux APAC Loyalty Management Industry Volume (K Unit) Forecast, by Application 2019 & 2032
- Table 103: Nordics APAC Loyalty Management Industry Revenue (Million) Forecast, by Application 2019 & 2032
- Table 104: Nordics APAC Loyalty Management Industry Volume (K Unit) Forecast, by Application 2019 & 2032
- Table 105: Rest of Europe APAC Loyalty Management Industry Revenue (Million) Forecast, by Application 2019 & 2032
- Table 106: Rest of Europe APAC Loyalty Management Industry Volume (K Unit) Forecast, by Application 2019 & 2032
- Table 107: Global APAC Loyalty Management Industry Revenue Million Forecast, by Loyalty Program Type 2019 & 2032
- Table 108: Global APAC Loyalty Management Industry Volume K Unit Forecast, by Loyalty Program Type 2019 & 2032
- Table 109: Global APAC Loyalty Management Industry Revenue Million Forecast, by End-user Vertical 2019 & 2032
- Table 110: Global APAC Loyalty Management Industry Volume K Unit Forecast, by End-user Vertical 2019 & 2032
- Table 111: Global APAC Loyalty Management Industry Revenue Million Forecast, by Country 2019 & 2032
- Table 112: Global APAC Loyalty Management Industry Volume K Unit Forecast, by Country 2019 & 2032
- Table 113: Turkey APAC Loyalty Management Industry Revenue (Million) Forecast, by Application 2019 & 2032
- Table 114: Turkey APAC Loyalty Management Industry Volume (K Unit) Forecast, by Application 2019 & 2032
- Table 115: Israel APAC Loyalty Management Industry Revenue (Million) Forecast, by Application 2019 & 2032
- Table 116: Israel APAC Loyalty Management Industry Volume (K Unit) Forecast, by Application 2019 & 2032
- Table 117: GCC APAC Loyalty Management Industry Revenue (Million) Forecast, by Application 2019 & 2032
- Table 118: GCC APAC Loyalty Management Industry Volume (K Unit) Forecast, by Application 2019 & 2032
- Table 119: North Africa APAC Loyalty Management Industry Revenue (Million) Forecast, by Application 2019 & 2032
- Table 120: North Africa APAC Loyalty Management Industry Volume (K Unit) Forecast, by Application 2019 & 2032
- Table 121: South Africa APAC Loyalty Management Industry Revenue (Million) Forecast, by Application 2019 & 2032
- Table 122: South Africa APAC Loyalty Management Industry Volume (K Unit) Forecast, by Application 2019 & 2032
- Table 123: Rest of Middle East & Africa APAC Loyalty Management Industry Revenue (Million) Forecast, by Application 2019 & 2032
- Table 124: Rest of Middle East & Africa APAC Loyalty Management Industry Volume (K Unit) Forecast, by Application 2019 & 2032
- Table 125: Global APAC Loyalty Management Industry Revenue Million Forecast, by Loyalty Program Type 2019 & 2032
- Table 126: Global APAC Loyalty Management Industry Volume K Unit Forecast, by Loyalty Program Type 2019 & 2032
- Table 127: Global APAC Loyalty Management Industry Revenue Million Forecast, by End-user Vertical 2019 & 2032
- Table 128: Global APAC Loyalty Management Industry Volume K Unit Forecast, by End-user Vertical 2019 & 2032
- Table 129: Global APAC Loyalty Management Industry Revenue Million Forecast, by Country 2019 & 2032
- Table 130: Global APAC Loyalty Management Industry Volume K Unit Forecast, by Country 2019 & 2032
- Table 131: China APAC Loyalty Management Industry Revenue (Million) Forecast, by Application 2019 & 2032
- Table 132: China APAC Loyalty Management Industry Volume (K Unit) Forecast, by Application 2019 & 2032
- Table 133: India APAC Loyalty Management Industry Revenue (Million) Forecast, by Application 2019 & 2032
- Table 134: India APAC Loyalty Management Industry Volume (K Unit) Forecast, by Application 2019 & 2032
- Table 135: Japan APAC Loyalty Management Industry Revenue (Million) Forecast, by Application 2019 & 2032
- Table 136: Japan APAC Loyalty Management Industry Volume (K Unit) Forecast, by Application 2019 & 2032
- Table 137: South Korea APAC Loyalty Management Industry Revenue (Million) Forecast, by Application 2019 & 2032
- Table 138: South Korea APAC Loyalty Management Industry Volume (K Unit) Forecast, by Application 2019 & 2032
- Table 139: ASEAN APAC Loyalty Management Industry Revenue (Million) Forecast, by Application 2019 & 2032
- Table 140: ASEAN APAC Loyalty Management Industry Volume (K Unit) Forecast, by Application 2019 & 2032
- Table 141: Oceania APAC Loyalty Management Industry Revenue (Million) Forecast, by Application 2019 & 2032
- Table 142: Oceania APAC Loyalty Management Industry Volume (K Unit) Forecast, by Application 2019 & 2032
- Table 143: Rest of Asia Pacific APAC Loyalty Management Industry Revenue (Million) Forecast, by Application 2019 & 2032
- Table 144: Rest of Asia Pacific APAC Loyalty Management Industry Volume (K Unit) Forecast, by Application 2019 & 2032
Frequently Asked Questions
1. What is the projected Compound Annual Growth Rate (CAGR) of the APAC Loyalty Management Industry?
The projected CAGR is approximately 21.06%.
2. Which companies are prominent players in the APAC Loyalty Management Industry?
Key companies in the market include TIBCO Software Inc, Edenred SA, IBM Corporation, Epsilon Data Management LLC, Aimia Inc, Capillary Technologies, Rewardz SG, Maritz Holdings Inc, Comarch SA, Oracle Corporation, Cheetah Digital.
3. What are the main segments of the APAC Loyalty Management Industry?
The market segments include Loyalty Program Type, End-user Vertical.
4. Can you provide details about the market size?
The market size is estimated to be USD 3.26 Million as of 2022.
5. What are some drivers contributing to market growth?
Rise of E-Commerce; Flourishing Startup Culture.
6. What are the notable trends driving market growth?
BFSI Segment is Expected to Witness the Highest Growth.
7. Are there any restraints impacting market growth?
Slow Penetration Rate in Developing Countries.
8. Can you provide examples of recent developments in the market?
July 2022: Tranxactor Group, a leading supplier of CRM, payment solutions, and loyalty for the retail and hospitality industries, selected Oracle Cloud Infrastructure (OCI) with Enterprise Database Service, allowing the firm to provide immersive and rich customer engagement and loyalty programs to brands.
9. What pricing options are available for accessing the report?
Pricing options include single-user, multi-user, and enterprise licenses priced at USD 3800, USD 4500, and USD 5800 respectively.
10. Is the market size provided in terms of value or volume?
The market size is provided in terms of value, measured in Million and volume, measured in K Unit.
11. Are there any specific market keywords associated with the report?
Yes, the market keyword associated with the report is "APAC Loyalty Management Industry," which aids in identifying and referencing the specific market segment covered.
12. How do I determine which pricing option suits my needs best?
The pricing options vary based on user requirements and access needs. Individual users may opt for single-user licenses, while businesses requiring broader access may choose multi-user or enterprise licenses for cost-effective access to the report.
13. Are there any additional resources or data provided in the APAC Loyalty Management Industry report?
While the report offers comprehensive insights, it's advisable to review the specific contents or supplementary materials provided to ascertain if additional resources or data are available.
14. How can I stay updated on further developments or reports in the APAC Loyalty Management Industry?
To stay informed about further developments, trends, and reports in the APAC Loyalty Management Industry, consider subscribing to industry newsletters, following relevant companies and organizations, or regularly checking reputable industry news sources and publications.
Methodology
Step 1 - Identification of Relevant Samples Size from Population Database


Step 2 - Approaches for Defining Global Market Size (Value, Volume* & Price*)

Note*: In applicable scenarios
Step 3 - Data Sources
Primary Research
- Web Analytics
- Survey Reports
- Research Institute
- Latest Research Reports
- Opinion Leaders
Secondary Research
- Annual Reports
- White Paper
- Latest Press Release
- Industry Association
- Paid Database
- Investor Presentations

Step 4 - Data Triangulation
Involves using different sources of information in order to increase the validity of a study
These sources are likely to be stakeholders in a program - participants, other researchers, program staff, other community members, and so on.
Then we put all data in single framework & apply various statistical tools to find out the dynamic on the market.
During the analysis stage, feedback from the stakeholder groups would be compared to determine areas of agreement as well as areas of divergence
