

Key Insights
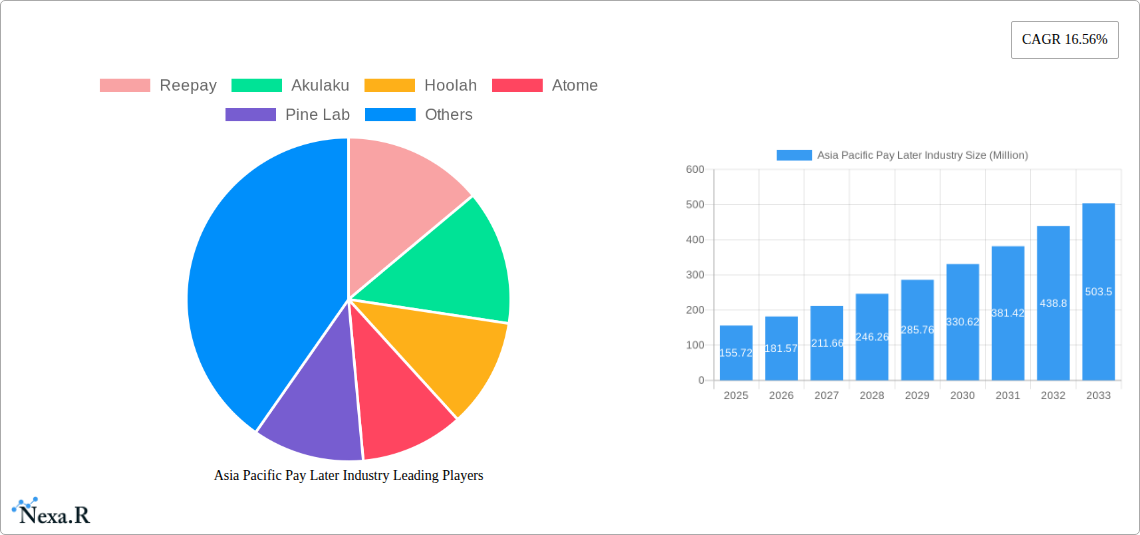
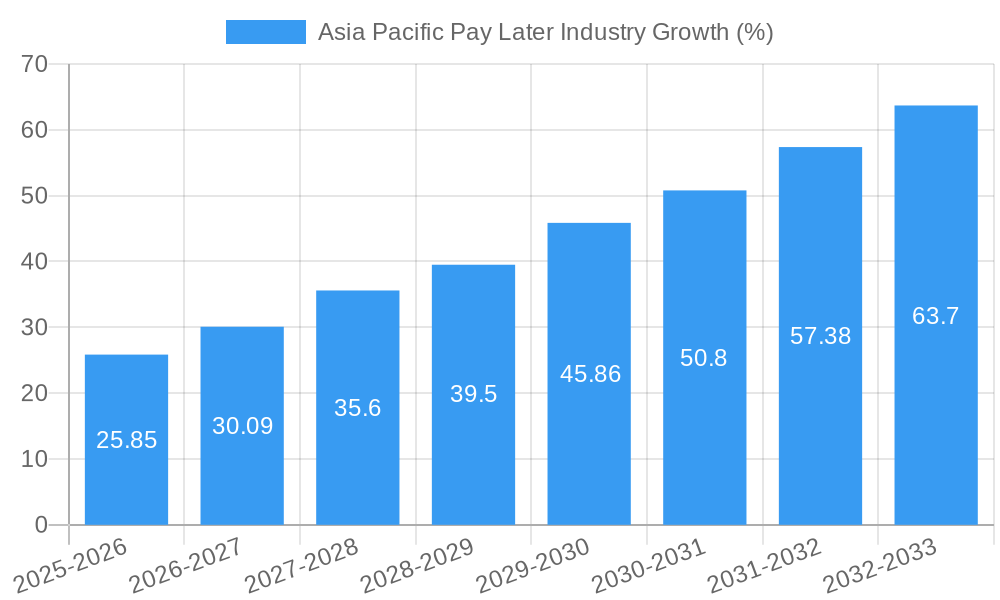
The Asia Pacific Buy Now, Pay Later (BNPL) market is experiencing explosive growth, projected to reach \$155.72 million in 2025 and maintain a robust Compound Annual Growth Rate (CAGR) of 16.56% from 2025 to 2033. This expansion is fueled by several key drivers. The increasing adoption of e-commerce and mobile payments across the region creates a fertile ground for BNPL services, offering consumers convenient and flexible payment options. A burgeoning young and digitally-savvy population readily embraces these fintech solutions, further accelerating market penetration. Furthermore, the growing prevalence of promotional offers and partnerships between BNPL providers and merchants incentivizes both consumers and businesses to utilize these services. However, challenges remain. Regulatory uncertainties and concerns regarding consumer debt management pose potential restraints on the market's trajectory. The need for robust risk management strategies and consumer protection frameworks will be crucial for sustainable growth. The market is segmented based on various factors including transaction value, customer demographics, and service providers. Key players such as Reepay, Akulaku, Hoolah, Atome, Pine Labs, ZestMoney BNPL, Openpay, Rely, Limepay, and PayRight (to name a few) are actively shaping the competitive landscape.
The projected growth of the Asia Pacific BNPL market signifies a significant opportunity for both established and emerging players. Strategic partnerships and technological advancements will be key differentiators. Companies are investing heavily in user-friendly interfaces, improved risk assessment tools, and wider merchant acceptance networks to enhance their market position. Given the rapid pace of digital transformation and increasing financial inclusion in the region, the Asia Pacific BNPL market is poised for continued expansion. However, addressing regulatory concerns, promoting financial literacy among consumers, and mitigating risks associated with potential debt accumulation are vital steps for long-term, sustainable growth and market stability.
This comprehensive report provides an in-depth analysis of the dynamic Asia Pacific Pay Later industry, encompassing market size, growth trends, key players, and future opportunities. With a study period spanning 2019-2033, a base year of 2025, and a forecast period of 2025-2033, this report is an essential resource for investors, businesses, and industry professionals seeking to navigate this rapidly evolving landscape. The report analyzes both the parent market (Financial Technology) and the child market (Buy Now Pay Later - BNPL). Market values are presented in million units.
Asia Pacific Pay Later Industry Market Dynamics & Structure
This section analyzes the competitive landscape of the Asia Pacific Pay Later industry, encompassing market concentration, technological innovation, regulatory frameworks, and competitive dynamics. The report assesses the impact of mergers and acquisitions (M&A) activity, examining both quantitative (market share, M&A deal volume: xx) and qualitative factors (innovation barriers).
- Market Concentration: The Asia Pacific Pay Later market exhibits a [Level of Concentration - e.g., moderately concentrated] structure, with a few major players holding significant market share.
- Technological Innovation: Technological advancements, such as AI-driven risk assessment and embedded finance, are driving industry growth. However, data security and privacy concerns present significant barriers.
- Regulatory Frameworks: Varying regulatory landscapes across different Asia Pacific countries create complexities for market participants. Compliance costs and evolving regulations impact operational efficiency.
- Competitive Product Substitutes: Traditional credit cards and other lending products compete with Pay Later services. However, the convenience and accessibility of Pay Later options are driving market expansion.
- End-User Demographics: A growing young, tech-savvy population in Asia Pacific fuels adoption of Pay Later services, particularly in e-commerce.
- M&A Trends: The number of M&A deals in the sector increased from xx in 2019 to xx in 2024, indicating significant consolidation. This is primarily driven by [State reasons for M&A, e.g. the desire for market expansion and technological integration].
Asia Pacific Pay Later Industry Growth Trends & Insights
This section details the evolution of the Asia Pacific Pay Later market size, adoption rates, technological disruptions, and consumer behavior shifts from 2019 to 2033. The analysis leverages comprehensive data and proprietary methodologies to provide accurate market sizing and forecasting.
[Insert 600-word analysis here, including quantitative data such as CAGR and market penetration rates. Examples of data points to include: Market size in 2024 (xx Million), Projected market size in 2033 (xx Million), CAGR (xx%), Market penetration rate in key countries].
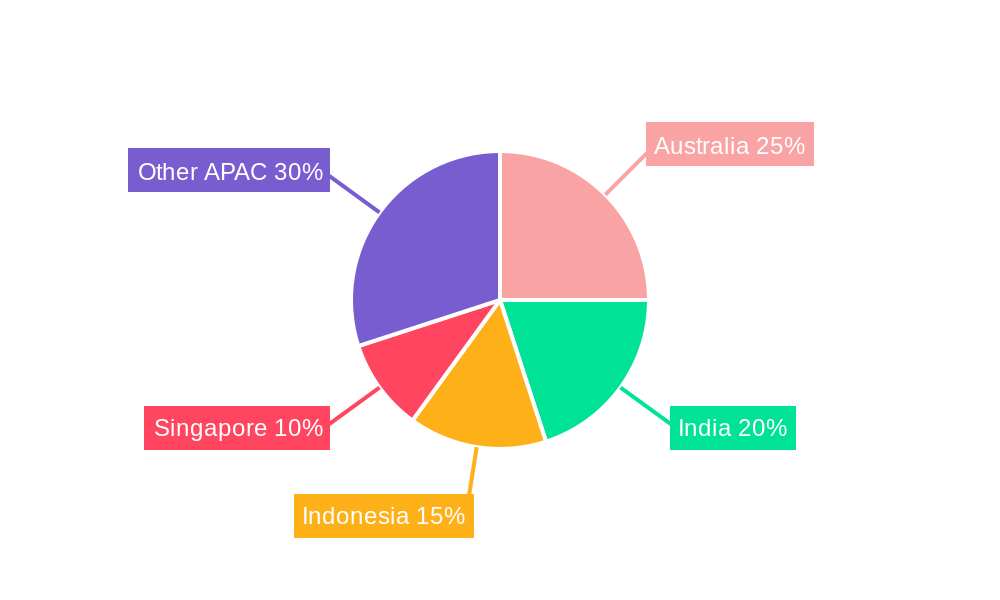
Dominant Regions, Countries, or Segments in Asia Pacific Pay Later Industry
This section identifies the leading regions and countries driving market growth within the Asia Pacific Pay Later industry, examining market share and growth potential.
[Insert 600-word analysis here, including details on the dominant regions (e.g., India, China, Australia). Include bullet points highlighting key drivers such as economic policies, infrastructure development, and consumer spending patterns. Provide a comparison of market shares and growth potential across different regions/countries. Include quantitative data to support your analysis].
Asia Pacific Pay Later Industry Product Landscape
The Asia Pacific Pay Later industry offers a range of products, from point-of-sale financing to embedded finance solutions integrated into e-commerce platforms. These services vary in terms of interest rates, repayment terms, and eligibility criteria. Technological advancements like AI-driven risk assessment and personalized offers enhance customer experiences and reduce fraud risk. Unique selling propositions frequently include seamless integration into existing platforms and flexible payment options.
Key Drivers, Barriers & Challenges in Asia Pacific Pay Later Industry
Key Drivers:
- Increasing e-commerce penetration.
- Growing smartphone usage and digital adoption.
- Favorable regulatory environments in some countries.
- Fintech innovation and technological advancements.
Key Challenges:
- Regulatory uncertainty and evolving compliance requirements.
- High default rates and credit risk management.
- Competition from established financial institutions.
- Concerns about consumer debt and financial inclusion.
- Supply chain disruptions impacting operational efficiency.
Emerging Opportunities in Asia Pacific Pay Later Industry
The Asia Pacific Pay Later industry presents several emerging opportunities:
- Expansion into underserved markets in Southeast Asia.
- Integration of Pay Later services with other financial products.
- Development of tailored solutions for specific industry verticals.
- Leveraging big data and AI to improve risk assessment and fraud prevention.
Growth Accelerators in the Asia Pacific Pay Later Industry
The long-term growth of the Asia Pacific Pay Later industry will be fueled by technological innovation, strategic partnerships between fintech companies and traditional financial institutions, and expansion into new markets. Enhanced customer experiences through personalized offerings and improved risk management will also contribute to growth.
Key Players Shaping the Asia Pacific Pay Later Industry Market
- Reepay
- Akulaku
- Hoolah
- Atome
- Pine Lab
- Zest Money BNPL
- Openpay (Australia)
- Rely (Singapore)
- Limepay (Australia)
- PayRight (Australia)
- List Not Exhaustive
Notable Milestones in Asia Pacific Pay Later Industry Sector
- June 2022: Kuaishou launched Sesame Credit's BNPL service in China.
- February 2023: CRED launched its BNPL service in India.
In-Depth Asia Pacific Pay Later Industry Market Outlook
The Asia Pacific Pay Later industry is poised for significant growth over the next decade, driven by the factors outlined above. Strategic partnerships, technological innovation, and expansion into untapped markets will be key to success. The industry presents lucrative opportunities for both established players and new entrants, demanding a deep understanding of market dynamics, regulatory landscapes, and evolving consumer preferences. The potential for market consolidation and the emergence of new business models makes this a compelling sector for investment and strategic planning.
Asia Pacific Pay Later Industry Segmentation
-
1. Channel
- 1.1. Online
- 1.2. POS
-
2. Enterprise
- 2.1. Large Enterprises
- 2.2. Small & Medium Enterprises
- 2.3. Others
-
3. End User
- 3.1. Consmer electronics
- 3.2. Fashion & garments
- 3.3. Healthcare
- 3.4. Leisure & entertainment
- 3.5. Retail
- 3.6. Others
Asia Pacific Pay Later Industry Segmentation By Geography
-
1. Asia Pacific
- 1.1. China
- 1.2. Japan
- 1.3. South Korea
- 1.4. India
- 1.5. Australia
- 1.6. New Zealand
- 1.7. Indonesia
- 1.8. Malaysia
- 1.9. Singapore
- 1.10. Thailand
- 1.11. Vietnam
- 1.12. Philippines
Asia Pacific Pay Later Industry REPORT HIGHLIGHTS
| Aspects | Details |
|---|---|
| Study Period | 2019-2033 |
| Base Year | 2024 |
| Estimated Year | 2025 |
| Forecast Period | 2025-2033 |
| Historical Period | 2019-2024 |
| Growth Rate | CAGR of 16.56% from 2019-2033 |
| Segmentation |
|
Table of Contents
- 1. Introduction
- 1.1. Research Scope
- 1.2. Market Segmentation
- 1.3. Research Methodology
- 1.4. Definitions and Assumptions
- 2. Executive Summary
- 2.1. Introduction
- 3. Market Dynamics
- 3.1. Introduction
- 3.2. Market Drivers
- 3.2.1. Lack Of Credit Availability In Small Transaction Driving BNPL Services; Rise In The Value Of Digital Transaction In Asia Pacific
- 3.3. Market Restrains
- 3.3.1. Lack Of Credit Availability In Small Transaction Driving BNPL Services; Rise In The Value Of Digital Transaction In Asia Pacific
- 3.4. Market Trends
- 3.4.1. Rising Digital Payments
- 4. Market Factor Analysis
- 4.1. Porters Five Forces
- 4.2. Supply/Value Chain
- 4.3. PESTEL analysis
- 4.4. Market Entropy
- 4.5. Patent/Trademark Analysis
- 5. Asia Pacific Pay Later Industry Analysis, Insights and Forecast, 2019-2031
- 5.1. Market Analysis, Insights and Forecast - by Channel
- 5.1.1. Online
- 5.1.2. POS
- 5.2. Market Analysis, Insights and Forecast - by Enterprise
- 5.2.1. Large Enterprises
- 5.2.2. Small & Medium Enterprises
- 5.2.3. Others
- 5.3. Market Analysis, Insights and Forecast - by End User
- 5.3.1. Consmer electronics
- 5.3.2. Fashion & garments
- 5.3.3. Healthcare
- 5.3.4. Leisure & entertainment
- 5.3.5. Retail
- 5.3.6. Others
- 5.4. Market Analysis, Insights and Forecast - by Region
- 5.4.1. Asia Pacific
- 5.1. Market Analysis, Insights and Forecast - by Channel
- 6. Competitive Analysis
- 6.1. Market Share Analysis 2024
- 6.2. Company Profiles
- 6.2.1 Reepay
- 6.2.1.1. Overview
- 6.2.1.2. Products
- 6.2.1.3. SWOT Analysis
- 6.2.1.4. Recent Developments
- 6.2.1.5. Financials (Based on Availability)
- 6.2.2 Akulaku
- 6.2.2.1. Overview
- 6.2.2.2. Products
- 6.2.2.3. SWOT Analysis
- 6.2.2.4. Recent Developments
- 6.2.2.5. Financials (Based on Availability)
- 6.2.3 Hoolah
- 6.2.3.1. Overview
- 6.2.3.2. Products
- 6.2.3.3. SWOT Analysis
- 6.2.3.4. Recent Developments
- 6.2.3.5. Financials (Based on Availability)
- 6.2.4 Atome
- 6.2.4.1. Overview
- 6.2.4.2. Products
- 6.2.4.3. SWOT Analysis
- 6.2.4.4. Recent Developments
- 6.2.4.5. Financials (Based on Availability)
- 6.2.5 Pine Lab
- 6.2.5.1. Overview
- 6.2.5.2. Products
- 6.2.5.3. SWOT Analysis
- 6.2.5.4. Recent Developments
- 6.2.5.5. Financials (Based on Availability)
- 6.2.6 Zest Money BNPL
- 6.2.6.1. Overview
- 6.2.6.2. Products
- 6.2.6.3. SWOT Analysis
- 6.2.6.4. Recent Developments
- 6.2.6.5. Financials (Based on Availability)
- 6.2.7 Openpay (Australia)
- 6.2.7.1. Overview
- 6.2.7.2. Products
- 6.2.7.3. SWOT Analysis
- 6.2.7.4. Recent Developments
- 6.2.7.5. Financials (Based on Availability)
- 6.2.8 Rely (Singapore)
- 6.2.8.1. Overview
- 6.2.8.2. Products
- 6.2.8.3. SWOT Analysis
- 6.2.8.4. Recent Developments
- 6.2.8.5. Financials (Based on Availability)
- 6.2.9 Limepay (Australia)
- 6.2.9.1. Overview
- 6.2.9.2. Products
- 6.2.9.3. SWOT Analysis
- 6.2.9.4. Recent Developments
- 6.2.9.5. Financials (Based on Availability)
- 6.2.10 PayRight (Australia)**List Not Exhaustive
- 6.2.10.1. Overview
- 6.2.10.2. Products
- 6.2.10.3. SWOT Analysis
- 6.2.10.4. Recent Developments
- 6.2.10.5. Financials (Based on Availability)
- 6.2.1 Reepay
List of Figures
- Figure 1: Asia Pacific Pay Later Industry Revenue Breakdown (Million, %) by Product 2024 & 2032
- Figure 2: Asia Pacific Pay Later Industry Share (%) by Company 2024
List of Tables
- Table 1: Asia Pacific Pay Later Industry Revenue Million Forecast, by Region 2019 & 2032
- Table 2: Asia Pacific Pay Later Industry Volume Billion Forecast, by Region 2019 & 2032
- Table 3: Asia Pacific Pay Later Industry Revenue Million Forecast, by Channel 2019 & 2032
- Table 4: Asia Pacific Pay Later Industry Volume Billion Forecast, by Channel 2019 & 2032
- Table 5: Asia Pacific Pay Later Industry Revenue Million Forecast, by Enterprise 2019 & 2032
- Table 6: Asia Pacific Pay Later Industry Volume Billion Forecast, by Enterprise 2019 & 2032
- Table 7: Asia Pacific Pay Later Industry Revenue Million Forecast, by End User 2019 & 2032
- Table 8: Asia Pacific Pay Later Industry Volume Billion Forecast, by End User 2019 & 2032
- Table 9: Asia Pacific Pay Later Industry Revenue Million Forecast, by Region 2019 & 2032
- Table 10: Asia Pacific Pay Later Industry Volume Billion Forecast, by Region 2019 & 2032
- Table 11: Asia Pacific Pay Later Industry Revenue Million Forecast, by Channel 2019 & 2032
- Table 12: Asia Pacific Pay Later Industry Volume Billion Forecast, by Channel 2019 & 2032
- Table 13: Asia Pacific Pay Later Industry Revenue Million Forecast, by Enterprise 2019 & 2032
- Table 14: Asia Pacific Pay Later Industry Volume Billion Forecast, by Enterprise 2019 & 2032
- Table 15: Asia Pacific Pay Later Industry Revenue Million Forecast, by End User 2019 & 2032
- Table 16: Asia Pacific Pay Later Industry Volume Billion Forecast, by End User 2019 & 2032
- Table 17: Asia Pacific Pay Later Industry Revenue Million Forecast, by Country 2019 & 2032
- Table 18: Asia Pacific Pay Later Industry Volume Billion Forecast, by Country 2019 & 2032
- Table 19: China Asia Pacific Pay Later Industry Revenue (Million) Forecast, by Application 2019 & 2032
- Table 20: China Asia Pacific Pay Later Industry Volume (Billion) Forecast, by Application 2019 & 2032
- Table 21: Japan Asia Pacific Pay Later Industry Revenue (Million) Forecast, by Application 2019 & 2032
- Table 22: Japan Asia Pacific Pay Later Industry Volume (Billion) Forecast, by Application 2019 & 2032
- Table 23: South Korea Asia Pacific Pay Later Industry Revenue (Million) Forecast, by Application 2019 & 2032
- Table 24: South Korea Asia Pacific Pay Later Industry Volume (Billion) Forecast, by Application 2019 & 2032
- Table 25: India Asia Pacific Pay Later Industry Revenue (Million) Forecast, by Application 2019 & 2032
- Table 26: India Asia Pacific Pay Later Industry Volume (Billion) Forecast, by Application 2019 & 2032
- Table 27: Australia Asia Pacific Pay Later Industry Revenue (Million) Forecast, by Application 2019 & 2032
- Table 28: Australia Asia Pacific Pay Later Industry Volume (Billion) Forecast, by Application 2019 & 2032
- Table 29: New Zealand Asia Pacific Pay Later Industry Revenue (Million) Forecast, by Application 2019 & 2032
- Table 30: New Zealand Asia Pacific Pay Later Industry Volume (Billion) Forecast, by Application 2019 & 2032
- Table 31: Indonesia Asia Pacific Pay Later Industry Revenue (Million) Forecast, by Application 2019 & 2032
- Table 32: Indonesia Asia Pacific Pay Later Industry Volume (Billion) Forecast, by Application 2019 & 2032
- Table 33: Malaysia Asia Pacific Pay Later Industry Revenue (Million) Forecast, by Application 2019 & 2032
- Table 34: Malaysia Asia Pacific Pay Later Industry Volume (Billion) Forecast, by Application 2019 & 2032
- Table 35: Singapore Asia Pacific Pay Later Industry Revenue (Million) Forecast, by Application 2019 & 2032
- Table 36: Singapore Asia Pacific Pay Later Industry Volume (Billion) Forecast, by Application 2019 & 2032
- Table 37: Thailand Asia Pacific Pay Later Industry Revenue (Million) Forecast, by Application 2019 & 2032
- Table 38: Thailand Asia Pacific Pay Later Industry Volume (Billion) Forecast, by Application 2019 & 2032
- Table 39: Vietnam Asia Pacific Pay Later Industry Revenue (Million) Forecast, by Application 2019 & 2032
- Table 40: Vietnam Asia Pacific Pay Later Industry Volume (Billion) Forecast, by Application 2019 & 2032
- Table 41: Philippines Asia Pacific Pay Later Industry Revenue (Million) Forecast, by Application 2019 & 2032
- Table 42: Philippines Asia Pacific Pay Later Industry Volume (Billion) Forecast, by Application 2019 & 2032
Frequently Asked Questions
1. What is the projected Compound Annual Growth Rate (CAGR) of the Asia Pacific Pay Later Industry?
The projected CAGR is approximately 16.56%.
2. Which companies are prominent players in the Asia Pacific Pay Later Industry?
Key companies in the market include Reepay, Akulaku, Hoolah, Atome, Pine Lab, Zest Money BNPL, Openpay (Australia), Rely (Singapore), Limepay (Australia), PayRight (Australia)**List Not Exhaustive.
3. What are the main segments of the Asia Pacific Pay Later Industry?
The market segments include Channel, Enterprise, End User.
4. Can you provide details about the market size?
The market size is estimated to be USD 155.72 Million as of 2022.
5. What are some drivers contributing to market growth?
Lack Of Credit Availability In Small Transaction Driving BNPL Services; Rise In The Value Of Digital Transaction In Asia Pacific.
6. What are the notable trends driving market growth?
Rising Digital Payments.
7. Are there any restraints impacting market growth?
Lack Of Credit Availability In Small Transaction Driving BNPL Services; Rise In The Value Of Digital Transaction In Asia Pacific.
8. Can you provide examples of recent developments in the market?
In June 2022, China E-commerce firm Kuaishou launched Sesame Credit's buy now and pay later (BNPL) service. Under the service users with a Sesame score of 550 and above will be able to order, receive, and try the products before paying on its e-commerce platform allowing its customers to easily return and exchange goods.
9. What pricing options are available for accessing the report?
Pricing options include single-user, multi-user, and enterprise licenses priced at USD 4750, USD 4950, and USD 6800 respectively.
10. Is the market size provided in terms of value or volume?
The market size is provided in terms of value, measured in Million and volume, measured in Billion.
11. Are there any specific market keywords associated with the report?
Yes, the market keyword associated with the report is "Asia Pacific Pay Later Industry," which aids in identifying and referencing the specific market segment covered.
12. How do I determine which pricing option suits my needs best?
The pricing options vary based on user requirements and access needs. Individual users may opt for single-user licenses, while businesses requiring broader access may choose multi-user or enterprise licenses for cost-effective access to the report.
13. Are there any additional resources or data provided in the Asia Pacific Pay Later Industry report?
While the report offers comprehensive insights, it's advisable to review the specific contents or supplementary materials provided to ascertain if additional resources or data are available.
14. How can I stay updated on further developments or reports in the Asia Pacific Pay Later Industry?
To stay informed about further developments, trends, and reports in the Asia Pacific Pay Later Industry, consider subscribing to industry newsletters, following relevant companies and organizations, or regularly checking reputable industry news sources and publications.
Methodology
Step 1 - Identification of Relevant Samples Size from Population Database


Step 2 - Approaches for Defining Global Market Size (Value, Volume* & Price*)

Note*: In applicable scenarios
Step 3 - Data Sources
Primary Research
- Web Analytics
- Survey Reports
- Research Institute
- Latest Research Reports
- Opinion Leaders
Secondary Research
- Annual Reports
- White Paper
- Latest Press Release
- Industry Association
- Paid Database
- Investor Presentations

Step 4 - Data Triangulation
Involves using different sources of information in order to increase the validity of a study
These sources are likely to be stakeholders in a program - participants, other researchers, program staff, other community members, and so on.
Then we put all data in single framework & apply various statistical tools to find out the dynamic on the market.
During the analysis stage, feedback from the stakeholder groups would be compared to determine areas of agreement as well as areas of divergence
