

Key Insights
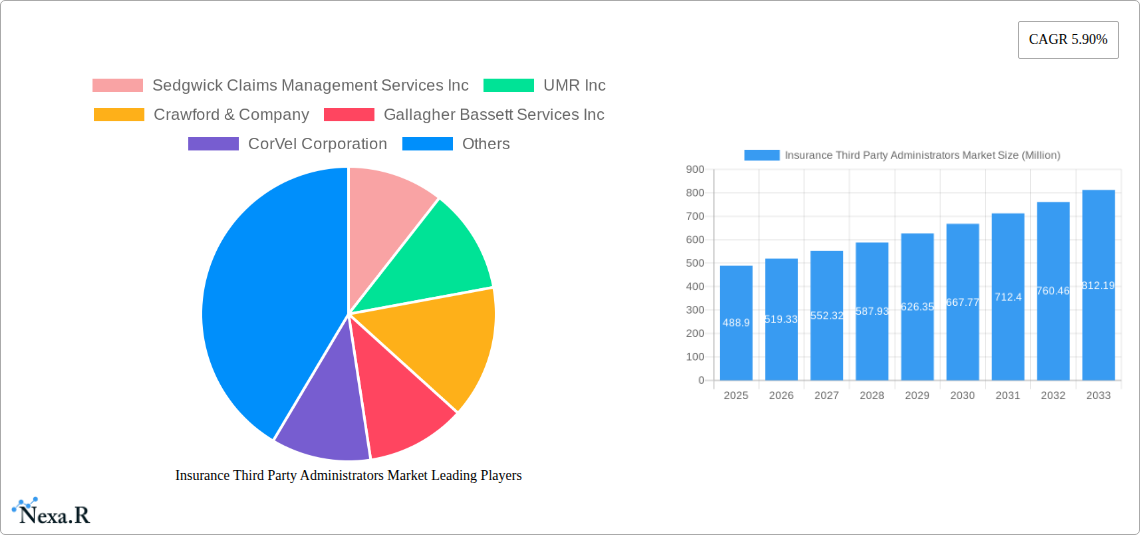
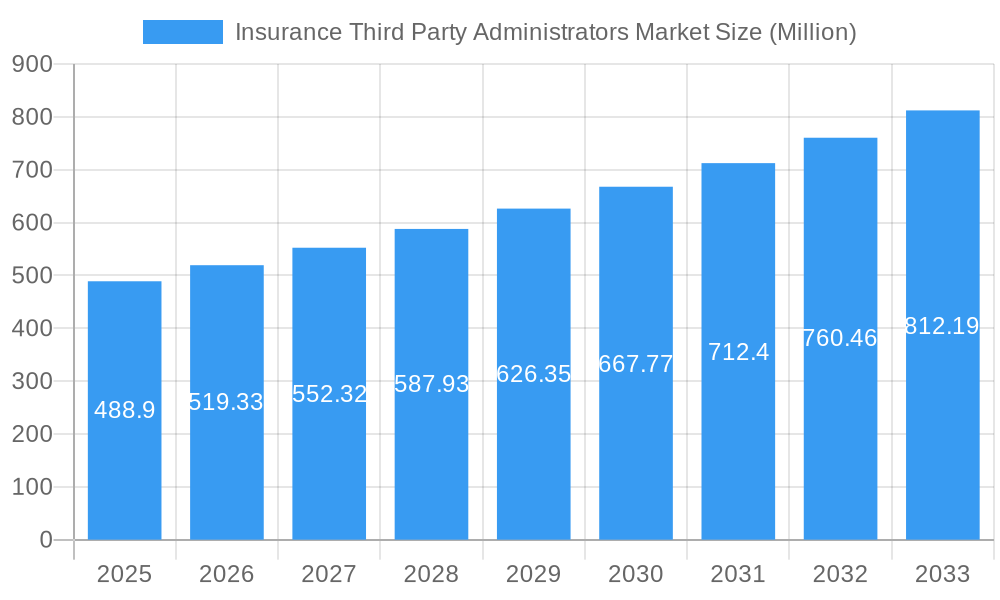
The Insurance Third Party Administrators (TPA) market, valued at $488.90 million in 2025, is projected to experience robust growth, driven by a Compound Annual Growth Rate (CAGR) of 5.90% from 2025 to 2033. This expansion is fueled by several key factors. Increasing healthcare costs and the complexity of insurance claims processing are compelling insurers to outsource these functions to specialized TPAs, improving efficiency and reducing administrative burdens. Furthermore, the rising adoption of advanced technologies, such as artificial intelligence (AI) and machine learning (ML), within the TPA sector is streamlining claims management, fraud detection, and customer service, leading to higher accuracy and cost savings. The growing prevalence of chronic diseases and an aging global population also contribute to increased demand for TPA services, as these demographics often require more extensive and complex claim management. Competition among established players like Sedgwick Claims Management Services Inc., UMR Inc., and Crawford & Company is driving innovation and service enhancements, further fueling market growth.
Insurance Third Party Administrators Market Market Size (In Million)
The market segmentation, while not explicitly detailed, likely includes distinctions based on service type (claims processing, utilization management, etc.), industry vertical (healthcare, workers' compensation, etc.), and geographical region. Geographical expansion, particularly in emerging markets with developing insurance sectors, represents a significant growth opportunity for TPA providers. However, potential restraints include regulatory complexities and data security concerns surrounding sensitive patient information. Maintaining data integrity and complying with evolving privacy regulations are crucial for TPAs to sustain growth and retain client trust. The forecast period (2025-2033) suggests continued expansion driven by the aforementioned factors, with a likely increase in market consolidation through mergers and acquisitions as larger firms seek to expand their market share and service offerings.
Insurance Third Party Administrators Market Company Market Share
Insurance Third Party Administrators Market: A Comprehensive Report (2019-2033)
This in-depth report provides a comprehensive analysis of the Insurance Third Party Administrators (TPA) market, encompassing market dynamics, growth trends, regional dominance, product landscapes, key players, and future outlook. The study period covers 2019-2033, with 2025 as the base year and forecast period extending to 2033. The report uses data from the historical period (2019-2024) and incorporates valuable insights from the parent market (Insurance Services) and the child market (Healthcare TPA). The market size is valued in million units.
Insurance Third Party Administrators Market Market Dynamics & Structure
This section analyzes the intricate dynamics of the Insurance TPA market. We delve into market concentration, revealing the share held by key players and exploring the competitive landscape. Technological advancements, regulatory shifts, and the presence of substitute products are examined, providing a holistic understanding of the market’s structure. The report also assesses end-user demographics and the impact of mergers and acquisitions (M&A) activities.
- Market Concentration: The market exhibits a moderately concentrated structure with xx% market share controlled by the top 5 players. (Further breakdown available in the full report).
- Technological Innovation: Increased adoption of AI and machine learning for claims processing and fraud detection are driving innovation. However, data security concerns and integration challenges pose barriers to wider adoption.
- Regulatory Framework: Varying regulatory landscapes across different regions create both opportunities and challenges for TPA providers. Compliance costs and varying data privacy regulations impact operational efficiency.
- Competitive Substitutes: Insurers increasingly explore in-house solutions to compete with TPAs. This creates pressure on TPAs to enhance their service offerings and value propositions.
- M&A Trends: The sector has witnessed a notable increase in M&A activity in recent years, with xx deals recorded between 2019 and 2024. This consolidation trend is expected to continue, driven by the need for scale and expansion into new markets. For example, the acquisition of Raksha Insurance by Medi Assist in March 2023 exemplifies this trend.
Insurance Third Party Administrators Market Growth Trends & Insights
This section provides a detailed analysis of the Insurance TPA market's growth trajectory, leveraging proprietary data and market intelligence. We explore market size evolution, adoption rates across different segments, the impact of technological disruptions, and shifts in consumer behavior influencing market demand. Key metrics like Compound Annual Growth Rate (CAGR) and market penetration are analyzed to provide a clear picture of market expansion. We project a CAGR of xx% during the forecast period (2025-2033), driven by factors such as increasing healthcare costs and the rising adoption of managed care.
(600 words of detailed analysis on market size, CAGR, adoption rates, technological disruptions, and consumer behavior shifts would be included here).
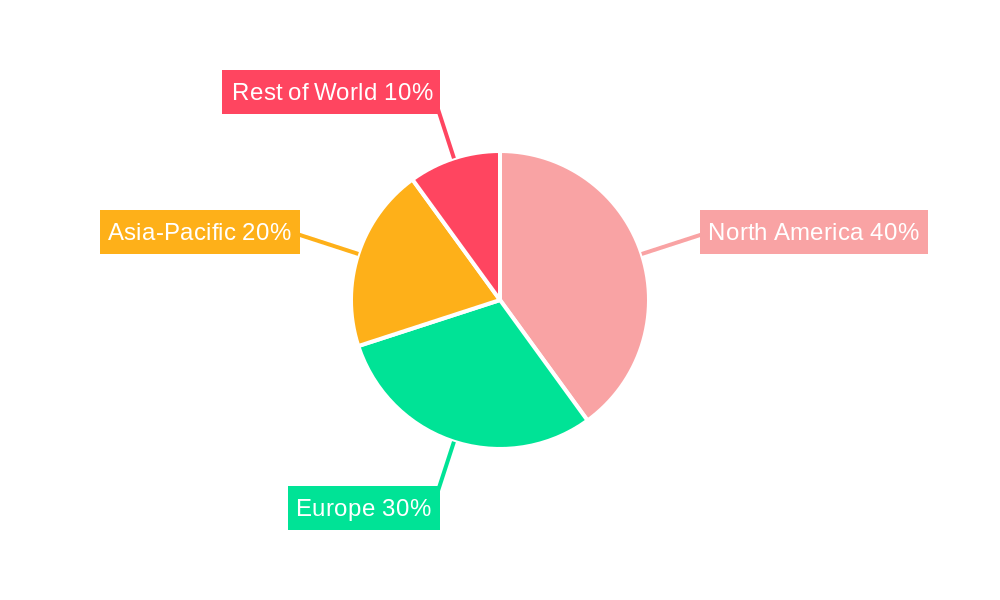
Dominant Regions, Countries, or Segments in Insurance Third Party Administrators Market
This section identifies the leading regions, countries, and market segments driving the Insurance TPA market's growth. A comprehensive analysis explores the dominance factors, such as economic policies, infrastructure development, and regulatory frameworks impacting market expansion. We detail market share and growth potential for each key region/segment.
- North America: The region dominates the market, driven by strong healthcare infrastructure, high insurance penetration, and the presence of major TPA providers.
- Europe: The market is experiencing steady growth, driven by increasing government initiatives promoting health insurance coverage and technological advancements.
- Asia-Pacific: This region showcases significant growth potential, fueled by rapidly rising healthcare expenditure, expanding insurance coverage, and favorable regulatory policies. (Further regional breakdowns with specific country examples included in the full report)
(600 words of detailed analysis on the factors driving regional dominance including market share and growth potential for each region would be included here).
Insurance Third Party Administrators Market Product Landscape
The Insurance TPA market offers a range of products and services, including claims administration, utilization management, provider network management, and other related services. Innovations focus on enhancing efficiency, accuracy, and cost-effectiveness through technology such as AI-powered claims processing, advanced analytics for fraud detection, and secure data management platforms. These advancements offer improved accuracy and reduced processing times, leading to greater client satisfaction.
Key Drivers, Barriers & Challenges in Insurance Third Party Administrators Market
Key Drivers: The market is propelled by factors including the increasing demand for efficient claims processing, rising healthcare costs, and the need for specialized expertise in managing complex insurance claims. Technological advancements such as AI and automation are further accelerating market growth.
Key Barriers & Challenges: Intense competition, stringent regulatory requirements, and the increasing adoption of in-house solutions by insurers present significant challenges. Data security and privacy concerns, along with the need for continuous technological upgrades, are also major hurdles. The impact of these challenges is quantified within the full report. (Quantifiable impacts of challenges like supply chain issues, regulatory hurdles and competitive pressure will be elaborated here.)
Emerging Opportunities in Insurance Third Party Administrators Market
The Insurance TPA market presents opportunities in several areas. Expanding into untapped markets, particularly in developing economies, represents significant potential. The development and adoption of specialized TPA services for niche insurance segments (e.g., travel, pet) also offer promising opportunities. Further exploration of data analytics to improve cost management for insurers remains a key opportunity.
Growth Accelerators in the Insurance Third Party Administrators Market Industry
Long-term growth is driven by technological breakthroughs, strategic partnerships between TPAs and healthcare providers, and expanding into new geographic markets. Focus on providing value-added services beyond basic claims processing, such as risk management and analytics, will be critical to sustained growth.
Key Players Shaping the Insurance Third Party Administrators Market Market
- Sedgwick Claims Management Services Inc.
- UMR Inc.
- Crawford & Company
- Gallagher Bassett Services Inc.
- CorVel Corporation
- Helmsman Management Services LLC
- ESIS Inc.
- Healthscope Benefits
- Maritain Health
(List Not Exhaustive)
Notable Milestones in Insurance Third Party Administrators Market Sector
- March 2023: Medi Assist's acquisition of Raksha Insurance expands its retail capabilities and strengthens its presence in India.
- December 2022: Sedgwick launched a new resource solutions business unit in the UK, enhancing its claims handling capabilities.
In-Depth Insurance Third Party Administrators Market Market Outlook
The Insurance TPA market is poised for significant growth over the forecast period. The continued adoption of technology, the rising demand for efficient claims management, and strategic partnerships will drive market expansion. Focusing on value-added services, specializing in niche areas, and leveraging data analytics will be critical for success in this dynamic market.
Insurance Third Party Administrators Market Segmentation
-
1. Insurance Type
- 1.1. Healthcare Insurance
- 1.2. Retirement Plans
- 1.3. Commercial General Liability Insurance
- 1.4. Others Insurance Types (Motor Insurance)
Insurance Third Party Administrators Market Segmentation By Geography
-
1. North America
- 1.1. United States
- 1.2. Canada
-
2. Europe
- 2.1. United Kingdom
- 2.2. Germany
- 2.3. Rest of Europe
-
3. Asia Pacific
- 3.1. China
- 3.2. India
- 3.3. Rest of Asia Pacific
-
4. Middle East and Africa
- 4.1. United Arab Emirates
- 4.2. Saudi Arabia
- 4.3. Rest of Middle East and Africa
- 5. Rest of the World
Insurance Third Party Administrators Market Regional Market Share
Geographic Coverage of Insurance Third Party Administrators Market
Insurance Third Party Administrators Market REPORT HIGHLIGHTS
| Aspects | Details |
|---|---|
| Study Period | 2020-2034 |
| Base Year | 2025 |
| Estimated Year | 2026 |
| Forecast Period | 2026-2034 |
| Historical Period | 2020-2025 |
| Growth Rate | CAGR of 5.90% from 2020-2034 |
| Segmentation |
|
Table of Contents
- 1. Introduction
- 1.1. Research Scope
- 1.2. Market Segmentation
- 1.3. Research Objective
- 1.4. Definitions and Assumptions
- 2. Executive Summary
- 2.1. Market Snapshot
- 3. Market Dynamics
- 3.1. Market Drivers
- 3.2. Market Restrains
- 3.3. Market Trends
- 3.4. Market Opportunities
- 4. Market Factor Analysis
- 4.1. Porters Five Forces
- 4.1.1. Bargaining Power of Suppliers
- 4.1.2. Bargaining Power of Buyers
- 4.1.3. Threat of New Entrants
- 4.1.4. Threat of Substitutes
- 4.1.5. Competitive Rivalry
- 4.2. PESTEL analysis
- 4.3. BCG Analysis
- 4.3.1. Stars (High Growth, High Market Share)
- 4.3.2. Cash Cows (Low Growth, High Market Share)
- 4.3.3. Question Mark (High Growth, Low Market Share)
- 4.3.4. Dogs (Low Growth, Low Market Share)
- 4.4. Ansoff Matrix Analysis
- 4.5. Supply Chain Analysis
- 4.6. Regulatory Landscape
- 4.7. Current Market Potential and Opportunity Assessment (TAM–SAM–SOM Framework)
- 4.8. NRP Analyst Note
- 4.1. Porters Five Forces
- 5. Market Analysis, Insights and Forecast 2021-2033
- 5.1. Market Analysis, Insights and Forecast - by Insurance Type
- 5.1.1. Healthcare Insurance
- 5.1.2. Retirement Plans
- 5.1.3. Commercial General Liability Insurance
- 5.1.4. Others Insurance Types (Motor Insurance)
- 5.2. Market Analysis, Insights and Forecast - by Region
- 5.2.1. North America
- 5.2.2. Europe
- 5.2.3. Asia Pacific
- 5.2.4. Middle East and Africa
- 5.2.5. Rest of the World
- 5.1. Market Analysis, Insights and Forecast - by Insurance Type
- 6. Global Insurance Third Party Administrators Market Analysis, Insights and Forecast, 2021-2033
- 6.1. Market Analysis, Insights and Forecast - by Insurance Type
- 6.1.1. Healthcare Insurance
- 6.1.2. Retirement Plans
- 6.1.3. Commercial General Liability Insurance
- 6.1.4. Others Insurance Types (Motor Insurance)
- 6.1. Market Analysis, Insights and Forecast - by Insurance Type
- 7. North America Insurance Third Party Administrators Market Analysis, Insights and Forecast, 2020-2032
- 7.1. Market Analysis, Insights and Forecast - by Insurance Type
- 7.1.1. Healthcare Insurance
- 7.1.2. Retirement Plans
- 7.1.3. Commercial General Liability Insurance
- 7.1.4. Others Insurance Types (Motor Insurance)
- 7.1. Market Analysis, Insights and Forecast - by Insurance Type
- 8. Europe Insurance Third Party Administrators Market Analysis, Insights and Forecast, 2020-2032
- 8.1. Market Analysis, Insights and Forecast - by Insurance Type
- 8.1.1. Healthcare Insurance
- 8.1.2. Retirement Plans
- 8.1.3. Commercial General Liability Insurance
- 8.1.4. Others Insurance Types (Motor Insurance)
- 8.1. Market Analysis, Insights and Forecast - by Insurance Type
- 9. Asia Pacific Insurance Third Party Administrators Market Analysis, Insights and Forecast, 2020-2032
- 9.1. Market Analysis, Insights and Forecast - by Insurance Type
- 9.1.1. Healthcare Insurance
- 9.1.2. Retirement Plans
- 9.1.3. Commercial General Liability Insurance
- 9.1.4. Others Insurance Types (Motor Insurance)
- 9.1. Market Analysis, Insights and Forecast - by Insurance Type
- 10. Middle East and Africa Insurance Third Party Administrators Market Analysis, Insights and Forecast, 2020-2032
- 10.1. Market Analysis, Insights and Forecast - by Insurance Type
- 10.1.1. Healthcare Insurance
- 10.1.2. Retirement Plans
- 10.1.3. Commercial General Liability Insurance
- 10.1.4. Others Insurance Types (Motor Insurance)
- 10.1. Market Analysis, Insights and Forecast - by Insurance Type
- 11. Rest of the World Insurance Third Party Administrators Market Analysis, Insights and Forecast, 2020-2032
- 11.1. Market Analysis, Insights and Forecast - by Insurance Type
- 11.1.1. Healthcare Insurance
- 11.1.2. Retirement Plans
- 11.1.3. Commercial General Liability Insurance
- 11.1.4. Others Insurance Types (Motor Insurance)
- 11.1. Market Analysis, Insights and Forecast - by Insurance Type
- 12. Competitive Analysis
- 12.1. Company Profiles
- 12.1.1 Sedgwick Claims Management Services Inc
- 12.1.1.1. Company Overview
- 12.1.1.2. Products
- 12.1.1.3. Company Financials
- 12.1.1.4. SWOT Analysis
- 12.1.2 UMR Inc
- 12.1.2.1. Company Overview
- 12.1.2.2. Products
- 12.1.2.3. Company Financials
- 12.1.2.4. SWOT Analysis
- 12.1.3 Crawford & Company
- 12.1.3.1. Company Overview
- 12.1.3.2. Products
- 12.1.3.3. Company Financials
- 12.1.3.4. SWOT Analysis
- 12.1.4 Gallagher Bassett Services Inc
- 12.1.4.1. Company Overview
- 12.1.4.2. Products
- 12.1.4.3. Company Financials
- 12.1.4.4. SWOT Analysis
- 12.1.5 CorVel Corporation
- 12.1.5.1. Company Overview
- 12.1.5.2. Products
- 12.1.5.3. Company Financials
- 12.1.5.4. SWOT Analysis
- 12.1.6 Helmsman Management Services LLC
- 12.1.6.1. Company Overview
- 12.1.6.2. Products
- 12.1.6.3. Company Financials
- 12.1.6.4. SWOT Analysis
- 12.1.7 ESIS Inc
- 12.1.7.1. Company Overview
- 12.1.7.2. Products
- 12.1.7.3. Company Financials
- 12.1.7.4. SWOT Analysis
- 12.1.8 Healthscope Benefits
- 12.1.8.1. Company Overview
- 12.1.8.2. Products
- 12.1.8.3. Company Financials
- 12.1.8.4. SWOT Analysis
- 12.1.9 Maritain Health**List Not Exhaustive
- 12.1.9.1. Company Overview
- 12.1.9.2. Products
- 12.1.9.3. Company Financials
- 12.1.9.4. SWOT Analysis
- 12.1.1 Sedgwick Claims Management Services Inc
- 12.2. Market Entropy
- 12.2.1 Company's Key Areas Served
- 12.2.2 Recent Developments
- 12.3. Company Market Share Analysis 2025
- 12.3.1 Top 5 Companies Market Share Analysis
- 12.3.2 Top 3 Companies Market Share Analysis
- 12.4. List of Potential Customers
- 13. Research Methodology
List of Figures
- Figure 1: Global Insurance Third Party Administrators Market Revenue Breakdown (Million, %) by Region 2025 & 2033
- Figure 2: Global Insurance Third Party Administrators Market Volume Breakdown (Billion, %) by Region 2025 & 2033
- Figure 3: North America Insurance Third Party Administrators Market Revenue (Million), by Insurance Type 2025 & 2033
- Figure 4: North America Insurance Third Party Administrators Market Volume (Billion), by Insurance Type 2025 & 2033
- Figure 5: North America Insurance Third Party Administrators Market Revenue Share (%), by Insurance Type 2025 & 2033
- Figure 6: North America Insurance Third Party Administrators Market Volume Share (%), by Insurance Type 2025 & 2033
- Figure 7: North America Insurance Third Party Administrators Market Revenue (Million), by Country 2025 & 2033
- Figure 8: North America Insurance Third Party Administrators Market Volume (Billion), by Country 2025 & 2033
- Figure 9: North America Insurance Third Party Administrators Market Revenue Share (%), by Country 2025 & 2033
- Figure 10: North America Insurance Third Party Administrators Market Volume Share (%), by Country 2025 & 2033
- Figure 11: Europe Insurance Third Party Administrators Market Revenue (Million), by Insurance Type 2025 & 2033
- Figure 12: Europe Insurance Third Party Administrators Market Volume (Billion), by Insurance Type 2025 & 2033
- Figure 13: Europe Insurance Third Party Administrators Market Revenue Share (%), by Insurance Type 2025 & 2033
- Figure 14: Europe Insurance Third Party Administrators Market Volume Share (%), by Insurance Type 2025 & 2033
- Figure 15: Europe Insurance Third Party Administrators Market Revenue (Million), by Country 2025 & 2033
- Figure 16: Europe Insurance Third Party Administrators Market Volume (Billion), by Country 2025 & 2033
- Figure 17: Europe Insurance Third Party Administrators Market Revenue Share (%), by Country 2025 & 2033
- Figure 18: Europe Insurance Third Party Administrators Market Volume Share (%), by Country 2025 & 2033
- Figure 19: Asia Pacific Insurance Third Party Administrators Market Revenue (Million), by Insurance Type 2025 & 2033
- Figure 20: Asia Pacific Insurance Third Party Administrators Market Volume (Billion), by Insurance Type 2025 & 2033
- Figure 21: Asia Pacific Insurance Third Party Administrators Market Revenue Share (%), by Insurance Type 2025 & 2033
- Figure 22: Asia Pacific Insurance Third Party Administrators Market Volume Share (%), by Insurance Type 2025 & 2033
- Figure 23: Asia Pacific Insurance Third Party Administrators Market Revenue (Million), by Country 2025 & 2033
- Figure 24: Asia Pacific Insurance Third Party Administrators Market Volume (Billion), by Country 2025 & 2033
- Figure 25: Asia Pacific Insurance Third Party Administrators Market Revenue Share (%), by Country 2025 & 2033
- Figure 26: Asia Pacific Insurance Third Party Administrators Market Volume Share (%), by Country 2025 & 2033
- Figure 27: Middle East and Africa Insurance Third Party Administrators Market Revenue (Million), by Insurance Type 2025 & 2033
- Figure 28: Middle East and Africa Insurance Third Party Administrators Market Volume (Billion), by Insurance Type 2025 & 2033
- Figure 29: Middle East and Africa Insurance Third Party Administrators Market Revenue Share (%), by Insurance Type 2025 & 2033
- Figure 30: Middle East and Africa Insurance Third Party Administrators Market Volume Share (%), by Insurance Type 2025 & 2033
- Figure 31: Middle East and Africa Insurance Third Party Administrators Market Revenue (Million), by Country 2025 & 2033
- Figure 32: Middle East and Africa Insurance Third Party Administrators Market Volume (Billion), by Country 2025 & 2033
- Figure 33: Middle East and Africa Insurance Third Party Administrators Market Revenue Share (%), by Country 2025 & 2033
- Figure 34: Middle East and Africa Insurance Third Party Administrators Market Volume Share (%), by Country 2025 & 2033
- Figure 35: Rest of the World Insurance Third Party Administrators Market Revenue (Million), by Insurance Type 2025 & 2033
- Figure 36: Rest of the World Insurance Third Party Administrators Market Volume (Billion), by Insurance Type 2025 & 2033
- Figure 37: Rest of the World Insurance Third Party Administrators Market Revenue Share (%), by Insurance Type 2025 & 2033
- Figure 38: Rest of the World Insurance Third Party Administrators Market Volume Share (%), by Insurance Type 2025 & 2033
- Figure 39: Rest of the World Insurance Third Party Administrators Market Revenue (Million), by Country 2025 & 2033
- Figure 40: Rest of the World Insurance Third Party Administrators Market Volume (Billion), by Country 2025 & 2033
- Figure 41: Rest of the World Insurance Third Party Administrators Market Revenue Share (%), by Country 2025 & 2033
- Figure 42: Rest of the World Insurance Third Party Administrators Market Volume Share (%), by Country 2025 & 2033
List of Tables
- Table 1: Global Insurance Third Party Administrators Market Revenue Million Forecast, by Insurance Type 2020 & 2033
- Table 2: Global Insurance Third Party Administrators Market Volume Billion Forecast, by Insurance Type 2020 & 2033
- Table 3: Global Insurance Third Party Administrators Market Revenue Million Forecast, by Region 2020 & 2033
- Table 4: Global Insurance Third Party Administrators Market Volume Billion Forecast, by Region 2020 & 2033
- Table 5: Global Insurance Third Party Administrators Market Revenue Million Forecast, by Insurance Type 2020 & 2033
- Table 6: Global Insurance Third Party Administrators Market Volume Billion Forecast, by Insurance Type 2020 & 2033
- Table 7: Global Insurance Third Party Administrators Market Revenue Million Forecast, by Country 2020 & 2033
- Table 8: Global Insurance Third Party Administrators Market Volume Billion Forecast, by Country 2020 & 2033
- Table 9: United States Insurance Third Party Administrators Market Revenue (Million) Forecast, by Application 2020 & 2033
- Table 10: United States Insurance Third Party Administrators Market Volume (Billion) Forecast, by Application 2020 & 2033
- Table 11: Canada Insurance Third Party Administrators Market Revenue (Million) Forecast, by Application 2020 & 2033
- Table 12: Canada Insurance Third Party Administrators Market Volume (Billion) Forecast, by Application 2020 & 2033
- Table 13: Global Insurance Third Party Administrators Market Revenue Million Forecast, by Insurance Type 2020 & 2033
- Table 14: Global Insurance Third Party Administrators Market Volume Billion Forecast, by Insurance Type 2020 & 2033
- Table 15: Global Insurance Third Party Administrators Market Revenue Million Forecast, by Country 2020 & 2033
- Table 16: Global Insurance Third Party Administrators Market Volume Billion Forecast, by Country 2020 & 2033
- Table 17: United Kingdom Insurance Third Party Administrators Market Revenue (Million) Forecast, by Application 2020 & 2033
- Table 18: United Kingdom Insurance Third Party Administrators Market Volume (Billion) Forecast, by Application 2020 & 2033
- Table 19: Germany Insurance Third Party Administrators Market Revenue (Million) Forecast, by Application 2020 & 2033
- Table 20: Germany Insurance Third Party Administrators Market Volume (Billion) Forecast, by Application 2020 & 2033
- Table 21: Rest of Europe Insurance Third Party Administrators Market Revenue (Million) Forecast, by Application 2020 & 2033
- Table 22: Rest of Europe Insurance Third Party Administrators Market Volume (Billion) Forecast, by Application 2020 & 2033
- Table 23: Global Insurance Third Party Administrators Market Revenue Million Forecast, by Insurance Type 2020 & 2033
- Table 24: Global Insurance Third Party Administrators Market Volume Billion Forecast, by Insurance Type 2020 & 2033
- Table 25: Global Insurance Third Party Administrators Market Revenue Million Forecast, by Country 2020 & 2033
- Table 26: Global Insurance Third Party Administrators Market Volume Billion Forecast, by Country 2020 & 2033
- Table 27: China Insurance Third Party Administrators Market Revenue (Million) Forecast, by Application 2020 & 2033
- Table 28: China Insurance Third Party Administrators Market Volume (Billion) Forecast, by Application 2020 & 2033
- Table 29: India Insurance Third Party Administrators Market Revenue (Million) Forecast, by Application 2020 & 2033
- Table 30: India Insurance Third Party Administrators Market Volume (Billion) Forecast, by Application 2020 & 2033
- Table 31: Rest of Asia Pacific Insurance Third Party Administrators Market Revenue (Million) Forecast, by Application 2020 & 2033
- Table 32: Rest of Asia Pacific Insurance Third Party Administrators Market Volume (Billion) Forecast, by Application 2020 & 2033
- Table 33: Global Insurance Third Party Administrators Market Revenue Million Forecast, by Insurance Type 2020 & 2033
- Table 34: Global Insurance Third Party Administrators Market Volume Billion Forecast, by Insurance Type 2020 & 2033
- Table 35: Global Insurance Third Party Administrators Market Revenue Million Forecast, by Country 2020 & 2033
- Table 36: Global Insurance Third Party Administrators Market Volume Billion Forecast, by Country 2020 & 2033
- Table 37: United Arab Emirates Insurance Third Party Administrators Market Revenue (Million) Forecast, by Application 2020 & 2033
- Table 38: United Arab Emirates Insurance Third Party Administrators Market Volume (Billion) Forecast, by Application 2020 & 2033
- Table 39: Saudi Arabia Insurance Third Party Administrators Market Revenue (Million) Forecast, by Application 2020 & 2033
- Table 40: Saudi Arabia Insurance Third Party Administrators Market Volume (Billion) Forecast, by Application 2020 & 2033
- Table 41: Rest of Middle East and Africa Insurance Third Party Administrators Market Revenue (Million) Forecast, by Application 2020 & 2033
- Table 42: Rest of Middle East and Africa Insurance Third Party Administrators Market Volume (Billion) Forecast, by Application 2020 & 2033
- Table 43: Global Insurance Third Party Administrators Market Revenue Million Forecast, by Insurance Type 2020 & 2033
- Table 44: Global Insurance Third Party Administrators Market Volume Billion Forecast, by Insurance Type 2020 & 2033
- Table 45: Global Insurance Third Party Administrators Market Revenue Million Forecast, by Country 2020 & 2033
- Table 46: Global Insurance Third Party Administrators Market Volume Billion Forecast, by Country 2020 & 2033
Frequently Asked Questions
1. What is the projected Compound Annual Growth Rate (CAGR) of the Insurance Third Party Administrators Market?
The projected CAGR is approximately 5.90%.
2. Which companies are prominent players in the Insurance Third Party Administrators Market?
Key companies in the market include Sedgwick Claims Management Services Inc, UMR Inc, Crawford & Company, Gallagher Bassett Services Inc, CorVel Corporation, Helmsman Management Services LLC, ESIS Inc, Healthscope Benefits, Maritain Health**List Not Exhaustive.
3. What are the main segments of the Insurance Third Party Administrators Market?
The market segments include Insurance Type.
4. Can you provide details about the market size?
The market size is estimated to be USD 488.90 Million as of 2022.
5. What are some drivers contributing to market growth?
Increasing Demand for Cost Effective Healthcare Solutions; Rise in Digitalization and Automation is Driving the Market.
6. What are the notable trends driving market growth?
Increasing Healthcare Insurance TPAs is Fuelling the Market.
7. Are there any restraints impacting market growth?
Increasing Demand for Cost Effective Healthcare Solutions; Rise in Digitalization and Automation is Driving the Market.
8. Can you provide examples of recent developments in the market?
March 2023: To grow, Medi Assist, a third-party administrator for health insurance, acquired Raksha Insurance. Medi Assist, based in Bengaluru, will be able to increase significantly its retail capabilities and fortify its position in the nation's interior thanks to the agreement.December 2022: Sedgwick set up a new business unit focused on resource solutions for its insurance clients in the United Kingdom. Sedgwick's experience and technical expertise help clients with temporary and permanent placements across claims handling divisions.
9. What pricing options are available for accessing the report?
Pricing options include single-user, multi-user, and enterprise licenses priced at USD 4750, USD 5250, and USD 8750 respectively.
10. Is the market size provided in terms of value or volume?
The market size is provided in terms of value, measured in Million and volume, measured in Billion.
11. Are there any specific market keywords associated with the report?
Yes, the market keyword associated with the report is "Insurance Third Party Administrators Market," which aids in identifying and referencing the specific market segment covered.
12. How do I determine which pricing option suits my needs best?
The pricing options vary based on user requirements and access needs. Individual users may opt for single-user licenses, while businesses requiring broader access may choose multi-user or enterprise licenses for cost-effective access to the report.
13. Are there any additional resources or data provided in the Insurance Third Party Administrators Market report?
While the report offers comprehensive insights, it's advisable to review the specific contents or supplementary materials provided to ascertain if additional resources or data are available.
14. How can I stay updated on further developments or reports in the Insurance Third Party Administrators Market?
To stay informed about further developments, trends, and reports in the Insurance Third Party Administrators Market, consider subscribing to industry newsletters, following relevant companies and organizations, or regularly checking reputable industry news sources and publications.
Methodology
Step 1 - Identification of Relevant Samples Size from Population Database


Step 2 - Approaches for Defining Global Market Size (Value, Volume* & Price*)

Note*: In applicable scenarios
Step 3 - Data Sources
Primary Research
- Web Analytics
- Survey Reports
- Research Institute
- Latest Research Reports
- Opinion Leaders
Secondary Research
- Annual Reports
- White Paper
- Latest Press Release
- Industry Association
- Paid Database
- Investor Presentations

Step 4 - Data Triangulation
Involves using different sources of information in order to increase the validity of a study
These sources are likely to be stakeholders in a program - participants, other researchers, program staff, other community members, and so on.
Then we put all data in single framework & apply various statistical tools to find out the dynamic on the market.
During the analysis stage, feedback from the stakeholder groups would be compared to determine areas of agreement as well as areas of divergence