

Key Insights
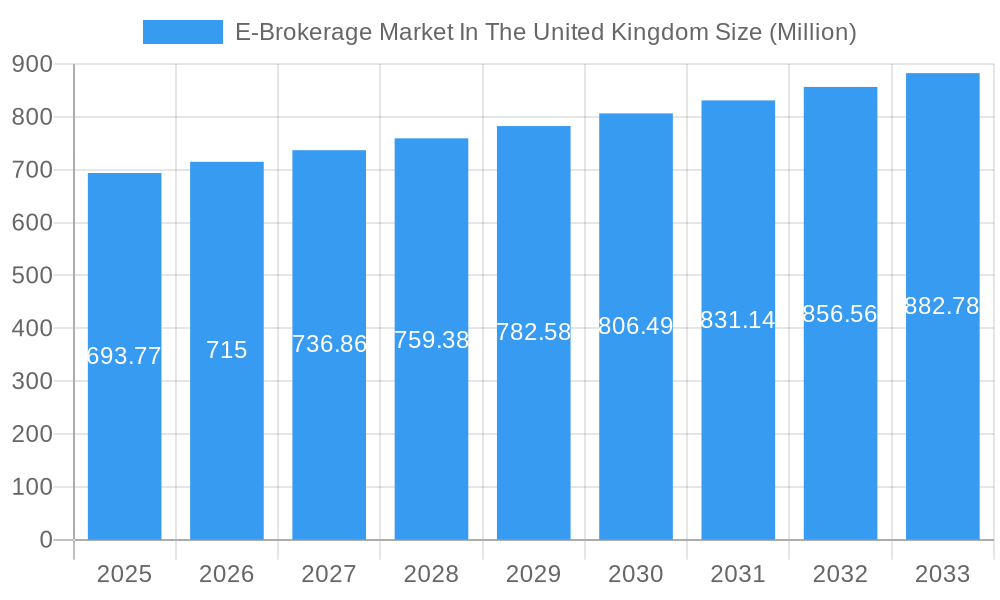
The UK e-brokerage market, valued at £693.77 million in 2025, is projected to experience steady growth, driven by increasing mobile penetration, rising digital literacy, and a growing preference for convenient, online investment platforms. The 2.83% CAGR suggests a gradual but consistent expansion over the forecast period (2025-2033). Key players like eToro, Pepperstone, Plus500, Capital.com, IG Group, City Index, Robinhood, AvaTrade, Monesta Markets, and Stocktrade are vying for market share, employing strategies such as advanced trading platforms, competitive commission structures, and educational resources to attract and retain clients. Regulatory changes and investor education initiatives are shaping the market landscape, fostering increased transparency and investor confidence. The market's segmentation, while not explicitly provided, likely includes segments based on client type (e.g., retail, institutional), asset class (e.g., stocks, forex, crypto), and service offerings (e.g., trading platforms, research tools, advisory services). Competition is fierce, and success hinges on delivering a seamless user experience, robust security measures, and innovative trading solutions.
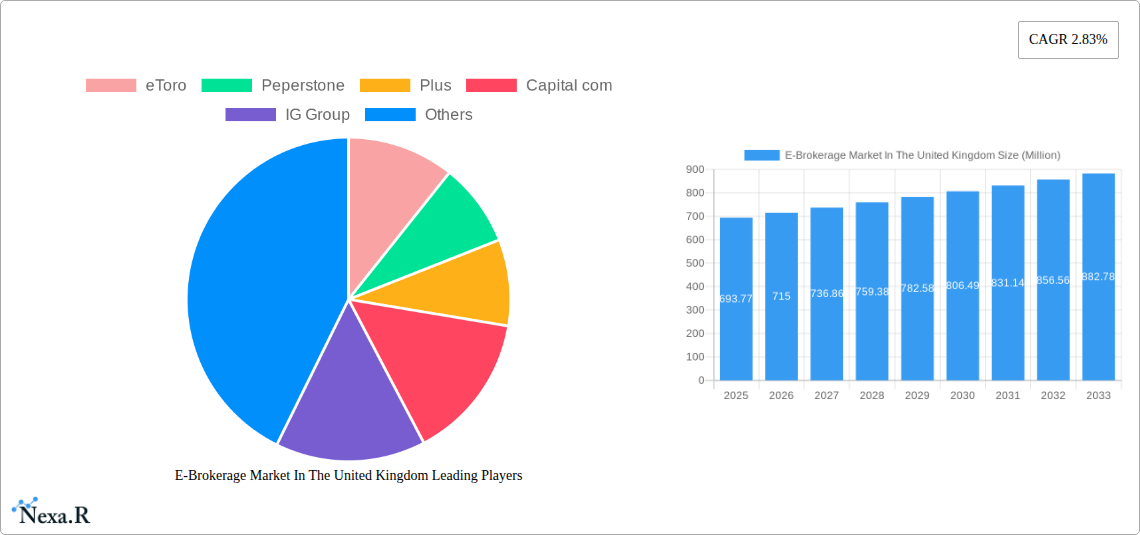
E-Brokerage Market In The United Kingdom Market Size (In Million)
The market's growth is anticipated to be influenced by macroeconomic factors, including interest rate fluctuations and overall economic conditions. Technological advancements will continue to play a crucial role, with the adoption of AI-powered trading tools and personalized investment recommendations likely driving future growth. Furthermore, the increasing popularity of fractional share trading and the rise of robo-advisors are expected to broaden the accessibility of the market to a wider range of investors. While regulatory scrutiny might present some challenges, the long-term outlook for the UK e-brokerage market remains positive, underpinned by sustained demand for online investment services. Growth will likely be influenced by the success of firms in attracting younger investors and adapting to evolving investor preferences.
E-Brokerage Market In The United Kingdom Company Market Share
E-Brokerage Market in the United Kingdom: A Comprehensive Market Report (2019-2033)
This in-depth report provides a comprehensive analysis of the UK e-brokerage market, covering market dynamics, growth trends, key players, and future outlook. With a study period spanning 2019-2033 (base year 2025), this report is an essential resource for industry professionals, investors, and anyone seeking to understand this rapidly evolving sector. The report leverages extensive data analysis and expert insights to deliver actionable intelligence on the parent market (Financial Services) and the child market (Online Brokerage). The market size is projected in millions.
E-Brokerage Market In The United Kingdom Market Dynamics & Structure
This section analyzes the competitive landscape, regulatory environment, and technological advancements shaping the UK e-brokerage market. We examine market concentration, identifying key players and their market share percentages. The report also delves into M&A activity within the sector, quantifying deal volumes and their impact on market structure. Technological innovation drivers, such as AI-powered trading tools and enhanced mobile platforms, are assessed. Regulatory frameworks, including those impacting data privacy and financial security, are scrutinized for their influence on market growth. Further, the report explores the impact of competitive product substitutes and evolving end-user demographics.
- Market Concentration: XX% dominated by top 5 players (2024).
- M&A Activity (2019-2024): XX deals, with an average deal value of £XX million.
- Technological Innovation: Focus on AI, enhanced mobile apps, and blockchain integration.
- Regulatory Landscape: Impact of FCA regulations and data privacy laws.
- Competitive Substitutes: Traditional brokerage firms and robo-advisors.
- End-User Demographics: Shift towards younger, tech-savvy investors.
E-Brokerage Market In The United Kingdom Growth Trends & Insights
This section presents a detailed analysis of the UK e-brokerage market's growth trajectory from 2019 to 2033. We examine market size evolution, highlighting significant year-on-year changes and overall Compound Annual Growth Rate (CAGR). The analysis incorporates adoption rates of e-brokerage services among different investor segments, exploring factors influencing user behavior. Technological disruptions, such as the rise of commission-free trading and crypto asset trading capabilities, are evaluated for their impact on market growth and consumer preferences.
- Market Size (2019): £XX million
- Market Size (2024): £XX million
- Market Size (2025): £XX million (Estimated)
- Market Size (2033): £XX million (Forecast)
- CAGR (2025-2033): XX%
- Market Penetration (2024): XX%
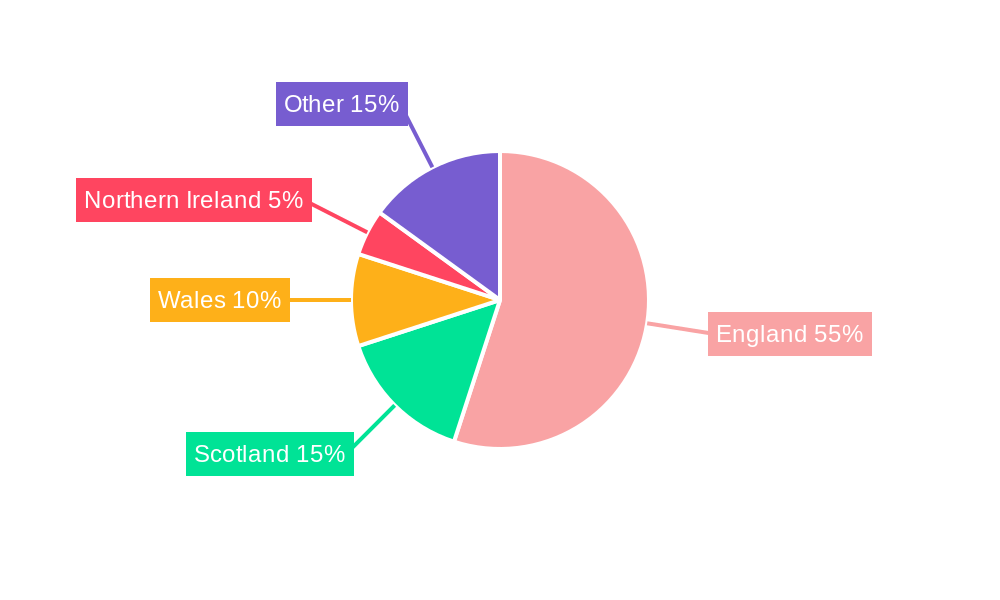
Dominant Regions, Countries, or Segments in E-Brokerage Market In The United Kingdom
This section identifies the leading regions, countries, or segments driving market growth within the UK. It analyzes the factors contributing to their dominance, including economic policies, infrastructure development, and investor demographics. The analysis incorporates market share data and growth potential projections for each segment. Key drivers are identified using bullet points, enabling a concise understanding of regional variations in market performance.
- London: Leading region due to high concentration of financial institutions and tech talent. Market share in 2024: XX%
- South East England: Strong growth due to increasing affluence and tech adoption. Market share in 2024: XX%
- Segments: Active traders, passive investors, beginners. Active traders currently drive market growth (2024 market share: XX%).
E-Brokerage Market In The United Kingdom Product Landscape
This section explores the range of products offered within the UK e-brokerage market. It highlights innovative features, such as fractional share trading, advanced charting tools, and social trading capabilities. The analysis also examines product performance metrics, including user engagement, transaction volumes, and customer satisfaction. Key differentiators and technological advancements are discussed to provide a comprehensive view of the product landscape.
Key Drivers, Barriers & Challenges in E-Brokerage Market In The United Kingdom
This section identifies the key factors driving market growth and the challenges hindering its expansion. Growth drivers are explored including technological advancements, favourable economic conditions, and supportive regulatory environments. Challenges include increased competition, evolving regulatory landscapes, and potential cybersecurity threats. The impact of these factors on market growth is quantitatively assessed where possible.
- Key Drivers: Technological innovation, increasing mobile penetration, rising investor interest in digital assets.
- Key Challenges: Stringent regulatory compliance, cybersecurity risks, increasing competition.
Emerging Opportunities in E-Brokerage Market In The United Kingdom
This section explores emerging trends and opportunities within the UK e-brokerage market. It focuses on untapped market segments, innovative applications of technology, and evolving investor preferences.
- Opportunities: Expansion into underserved demographics, integration of AI-powered investment advice, expansion into ESG investing.
Growth Accelerators in the E-Brokerage Market In The United Kingdom Industry
This section details factors that could accelerate long-term market growth. This includes strategic partnerships, technological breakthroughs, and proactive market expansion strategies.
Key Players Shaping the E-Brokerage Market In The United Kingdom Market
- eToro
- Peperstone
- Plus500
- Capital.com
- IG Group
- City Index
- Robinhood
- AvaTrade
- Monesta Markets
- Stocktrade
Notable Milestones in E-Brokerage Market In The United Kingdom Sector
- March 2023: Cenkos and FinnCap merger, creating a larger brokerage firm.
- July 2023: Public.com launches commission-free trading in the UK.
In-Depth E-Brokerage Market In The United Kingdom Market Outlook
The UK e-brokerage market is poised for continued growth driven by technological advancements, increasing financial literacy, and evolving investor preferences. Strategic partnerships and expansion into niche segments present significant opportunities. The market is expected to experience a sustained period of expansion, with significant potential for further consolidation and innovation.
E-Brokerage Market In The United Kingdom Segmentation
-
1. Investor
- 1.1. Retail
- 1.2. Institutional
-
2. Operation
- 2.1. Domestic
- 2.2. Foreign
E-Brokerage Market In The United Kingdom Segmentation By Geography
-
1. North America
- 1.1. United States
- 1.2. Canada
- 1.3. Mexico
-
2. South America
- 2.1. Brazil
- 2.2. Argentina
- 2.3. Rest of South America
-
3. Europe
- 3.1. United Kingdom
- 3.2. Germany
- 3.3. France
- 3.4. Italy
- 3.5. Spain
- 3.6. Russia
- 3.7. Benelux
- 3.8. Nordics
- 3.9. Rest of Europe
-
4. Middle East & Africa
- 4.1. Turkey
- 4.2. Israel
- 4.3. GCC
- 4.4. North Africa
- 4.5. South Africa
- 4.6. Rest of Middle East & Africa
-
5. Asia Pacific
- 5.1. China
- 5.2. India
- 5.3. Japan
- 5.4. South Korea
- 5.5. ASEAN
- 5.6. Oceania
- 5.7. Rest of Asia Pacific
E-Brokerage Market In The United Kingdom Regional Market Share
Geographic Coverage of E-Brokerage Market In The United Kingdom
E-Brokerage Market In The United Kingdom REPORT HIGHLIGHTS
| Aspects | Details |
|---|---|
| Study Period | 2020-2034 |
| Base Year | 2025 |
| Estimated Year | 2026 |
| Forecast Period | 2026-2034 |
| Historical Period | 2020-2025 |
| Growth Rate | CAGR of 2.83% from 2020-2034 |
| Segmentation |
|
Table of Contents
- 1. Introduction
- 1.1. Research Scope
- 1.2. Market Segmentation
- 1.3. Research Objective
- 1.4. Definitions and Assumptions
- 2. Executive Summary
- 2.1. Market Snapshot
- 3. Market Dynamics
- 3.1. Market Drivers
- 3.2. Market Restrains
- 3.3. Market Trends
- 3.4. Market Opportunities
- 4. Market Factor Analysis
- 4.1. Porters Five Forces
- 4.1.1. Bargaining Power of Suppliers
- 4.1.2. Bargaining Power of Buyers
- 4.1.3. Threat of New Entrants
- 4.1.4. Threat of Substitutes
- 4.1.5. Competitive Rivalry
- 4.2. PESTEL analysis
- 4.3. BCG Analysis
- 4.3.1. Stars (High Growth, High Market Share)
- 4.3.2. Cash Cows (Low Growth, High Market Share)
- 4.3.3. Question Mark (High Growth, Low Market Share)
- 4.3.4. Dogs (Low Growth, Low Market Share)
- 4.4. Ansoff Matrix Analysis
- 4.5. Supply Chain Analysis
- 4.6. Regulatory Landscape
- 4.7. Current Market Potential and Opportunity Assessment (TAM–SAM–SOM Framework)
- 4.8. NRP Analyst Note
- 4.1. Porters Five Forces
- 5. Market Analysis, Insights and Forecast 2021-2033
- 5.1. Market Analysis, Insights and Forecast - by Investor
- 5.1.1. Retail
- 5.1.2. Institutional
- 5.2. Market Analysis, Insights and Forecast - by Operation
- 5.2.1. Domestic
- 5.2.2. Foreign
- 5.3. Market Analysis, Insights and Forecast - by Region
- 5.3.1. North America
- 5.3.2. South America
- 5.3.3. Europe
- 5.3.4. Middle East & Africa
- 5.3.5. Asia Pacific
- 5.1. Market Analysis, Insights and Forecast - by Investor
- 6. Global E-Brokerage Market In The United Kingdom Analysis, Insights and Forecast, 2021-2033
- 6.1. Market Analysis, Insights and Forecast - by Investor
- 6.1.1. Retail
- 6.1.2. Institutional
- 6.2. Market Analysis, Insights and Forecast - by Operation
- 6.2.1. Domestic
- 6.2.2. Foreign
- 6.1. Market Analysis, Insights and Forecast - by Investor
- 7. North America E-Brokerage Market In The United Kingdom Analysis, Insights and Forecast, 2020-2032
- 7.1. Market Analysis, Insights and Forecast - by Investor
- 7.1.1. Retail
- 7.1.2. Institutional
- 7.2. Market Analysis, Insights and Forecast - by Operation
- 7.2.1. Domestic
- 7.2.2. Foreign
- 7.1. Market Analysis, Insights and Forecast - by Investor
- 8. South America E-Brokerage Market In The United Kingdom Analysis, Insights and Forecast, 2020-2032
- 8.1. Market Analysis, Insights and Forecast - by Investor
- 8.1.1. Retail
- 8.1.2. Institutional
- 8.2. Market Analysis, Insights and Forecast - by Operation
- 8.2.1. Domestic
- 8.2.2. Foreign
- 8.1. Market Analysis, Insights and Forecast - by Investor
- 9. Europe E-Brokerage Market In The United Kingdom Analysis, Insights and Forecast, 2020-2032
- 9.1. Market Analysis, Insights and Forecast - by Investor
- 9.1.1. Retail
- 9.1.2. Institutional
- 9.2. Market Analysis, Insights and Forecast - by Operation
- 9.2.1. Domestic
- 9.2.2. Foreign
- 9.1. Market Analysis, Insights and Forecast - by Investor
- 10. Middle East & Africa E-Brokerage Market In The United Kingdom Analysis, Insights and Forecast, 2020-2032
- 10.1. Market Analysis, Insights and Forecast - by Investor
- 10.1.1. Retail
- 10.1.2. Institutional
- 10.2. Market Analysis, Insights and Forecast - by Operation
- 10.2.1. Domestic
- 10.2.2. Foreign
- 10.1. Market Analysis, Insights and Forecast - by Investor
- 11. Asia Pacific E-Brokerage Market In The United Kingdom Analysis, Insights and Forecast, 2020-2032
- 11.1. Market Analysis, Insights and Forecast - by Investor
- 11.1.1. Retail
- 11.1.2. Institutional
- 11.2. Market Analysis, Insights and Forecast - by Operation
- 11.2.1. Domestic
- 11.2.2. Foreign
- 11.1. Market Analysis, Insights and Forecast - by Investor
- 12. Competitive Analysis
- 12.1. Company Profiles
- 12.1.1 eToro
- 12.1.1.1. Company Overview
- 12.1.1.2. Products
- 12.1.1.3. Company Financials
- 12.1.1.4. SWOT Analysis
- 12.1.2 Peperstone
- 12.1.2.1. Company Overview
- 12.1.2.2. Products
- 12.1.2.3. Company Financials
- 12.1.2.4. SWOT Analysis
- 12.1.3 Plus
- 12.1.3.1. Company Overview
- 12.1.3.2. Products
- 12.1.3.3. Company Financials
- 12.1.3.4. SWOT Analysis
- 12.1.4 Capital com
- 12.1.4.1. Company Overview
- 12.1.4.2. Products
- 12.1.4.3. Company Financials
- 12.1.4.4. SWOT Analysis
- 12.1.5 IG Group
- 12.1.5.1. Company Overview
- 12.1.5.2. Products
- 12.1.5.3. Company Financials
- 12.1.5.4. SWOT Analysis
- 12.1.6 City Index
- 12.1.6.1. Company Overview
- 12.1.6.2. Products
- 12.1.6.3. Company Financials
- 12.1.6.4. SWOT Analysis
- 12.1.7 Robinhood
- 12.1.7.1. Company Overview
- 12.1.7.2. Products
- 12.1.7.3. Company Financials
- 12.1.7.4. SWOT Analysis
- 12.1.8 AvaTrade
- 12.1.8.1. Company Overview
- 12.1.8.2. Products
- 12.1.8.3. Company Financials
- 12.1.8.4. SWOT Analysis
- 12.1.9 Monesta Markets
- 12.1.9.1. Company Overview
- 12.1.9.2. Products
- 12.1.9.3. Company Financials
- 12.1.9.4. SWOT Analysis
- 12.1.10 Stocktrade
- 12.1.10.1. Company Overview
- 12.1.10.2. Products
- 12.1.10.3. Company Financials
- 12.1.10.4. SWOT Analysis
- 12.1.1 eToro
- 12.2. Market Entropy
- 12.2.1 Company's Key Areas Served
- 12.2.2 Recent Developments
- 12.3. Company Market Share Analysis 2025
- 12.3.1 Top 5 Companies Market Share Analysis
- 12.3.2 Top 3 Companies Market Share Analysis
- 12.4. List of Potential Customers
- 13. Research Methodology
List of Figures
- Figure 1: Global E-Brokerage Market In The United Kingdom Revenue Breakdown (Million, %) by Region 2025 & 2033
- Figure 2: Global E-Brokerage Market In The United Kingdom Volume Breakdown (Million, %) by Region 2025 & 2033
- Figure 3: North America E-Brokerage Market In The United Kingdom Revenue (Million), by Investor 2025 & 2033
- Figure 4: North America E-Brokerage Market In The United Kingdom Volume (Million), by Investor 2025 & 2033
- Figure 5: North America E-Brokerage Market In The United Kingdom Revenue Share (%), by Investor 2025 & 2033
- Figure 6: North America E-Brokerage Market In The United Kingdom Volume Share (%), by Investor 2025 & 2033
- Figure 7: North America E-Brokerage Market In The United Kingdom Revenue (Million), by Operation 2025 & 2033
- Figure 8: North America E-Brokerage Market In The United Kingdom Volume (Million), by Operation 2025 & 2033
- Figure 9: North America E-Brokerage Market In The United Kingdom Revenue Share (%), by Operation 2025 & 2033
- Figure 10: North America E-Brokerage Market In The United Kingdom Volume Share (%), by Operation 2025 & 2033
- Figure 11: North America E-Brokerage Market In The United Kingdom Revenue (Million), by Country 2025 & 2033
- Figure 12: North America E-Brokerage Market In The United Kingdom Volume (Million), by Country 2025 & 2033
- Figure 13: North America E-Brokerage Market In The United Kingdom Revenue Share (%), by Country 2025 & 2033
- Figure 14: North America E-Brokerage Market In The United Kingdom Volume Share (%), by Country 2025 & 2033
- Figure 15: South America E-Brokerage Market In The United Kingdom Revenue (Million), by Investor 2025 & 2033
- Figure 16: South America E-Brokerage Market In The United Kingdom Volume (Million), by Investor 2025 & 2033
- Figure 17: South America E-Brokerage Market In The United Kingdom Revenue Share (%), by Investor 2025 & 2033
- Figure 18: South America E-Brokerage Market In The United Kingdom Volume Share (%), by Investor 2025 & 2033
- Figure 19: South America E-Brokerage Market In The United Kingdom Revenue (Million), by Operation 2025 & 2033
- Figure 20: South America E-Brokerage Market In The United Kingdom Volume (Million), by Operation 2025 & 2033
- Figure 21: South America E-Brokerage Market In The United Kingdom Revenue Share (%), by Operation 2025 & 2033
- Figure 22: South America E-Brokerage Market In The United Kingdom Volume Share (%), by Operation 2025 & 2033
- Figure 23: South America E-Brokerage Market In The United Kingdom Revenue (Million), by Country 2025 & 2033
- Figure 24: South America E-Brokerage Market In The United Kingdom Volume (Million), by Country 2025 & 2033
- Figure 25: South America E-Brokerage Market In The United Kingdom Revenue Share (%), by Country 2025 & 2033
- Figure 26: South America E-Brokerage Market In The United Kingdom Volume Share (%), by Country 2025 & 2033
- Figure 27: Europe E-Brokerage Market In The United Kingdom Revenue (Million), by Investor 2025 & 2033
- Figure 28: Europe E-Brokerage Market In The United Kingdom Volume (Million), by Investor 2025 & 2033
- Figure 29: Europe E-Brokerage Market In The United Kingdom Revenue Share (%), by Investor 2025 & 2033
- Figure 30: Europe E-Brokerage Market In The United Kingdom Volume Share (%), by Investor 2025 & 2033
- Figure 31: Europe E-Brokerage Market In The United Kingdom Revenue (Million), by Operation 2025 & 2033
- Figure 32: Europe E-Brokerage Market In The United Kingdom Volume (Million), by Operation 2025 & 2033
- Figure 33: Europe E-Brokerage Market In The United Kingdom Revenue Share (%), by Operation 2025 & 2033
- Figure 34: Europe E-Brokerage Market In The United Kingdom Volume Share (%), by Operation 2025 & 2033
- Figure 35: Europe E-Brokerage Market In The United Kingdom Revenue (Million), by Country 2025 & 2033
- Figure 36: Europe E-Brokerage Market In The United Kingdom Volume (Million), by Country 2025 & 2033
- Figure 37: Europe E-Brokerage Market In The United Kingdom Revenue Share (%), by Country 2025 & 2033
- Figure 38: Europe E-Brokerage Market In The United Kingdom Volume Share (%), by Country 2025 & 2033
- Figure 39: Middle East & Africa E-Brokerage Market In The United Kingdom Revenue (Million), by Investor 2025 & 2033
- Figure 40: Middle East & Africa E-Brokerage Market In The United Kingdom Volume (Million), by Investor 2025 & 2033
- Figure 41: Middle East & Africa E-Brokerage Market In The United Kingdom Revenue Share (%), by Investor 2025 & 2033
- Figure 42: Middle East & Africa E-Brokerage Market In The United Kingdom Volume Share (%), by Investor 2025 & 2033
- Figure 43: Middle East & Africa E-Brokerage Market In The United Kingdom Revenue (Million), by Operation 2025 & 2033
- Figure 44: Middle East & Africa E-Brokerage Market In The United Kingdom Volume (Million), by Operation 2025 & 2033
- Figure 45: Middle East & Africa E-Brokerage Market In The United Kingdom Revenue Share (%), by Operation 2025 & 2033
- Figure 46: Middle East & Africa E-Brokerage Market In The United Kingdom Volume Share (%), by Operation 2025 & 2033
- Figure 47: Middle East & Africa E-Brokerage Market In The United Kingdom Revenue (Million), by Country 2025 & 2033
- Figure 48: Middle East & Africa E-Brokerage Market In The United Kingdom Volume (Million), by Country 2025 & 2033
- Figure 49: Middle East & Africa E-Brokerage Market In The United Kingdom Revenue Share (%), by Country 2025 & 2033
- Figure 50: Middle East & Africa E-Brokerage Market In The United Kingdom Volume Share (%), by Country 2025 & 2033
- Figure 51: Asia Pacific E-Brokerage Market In The United Kingdom Revenue (Million), by Investor 2025 & 2033
- Figure 52: Asia Pacific E-Brokerage Market In The United Kingdom Volume (Million), by Investor 2025 & 2033
- Figure 53: Asia Pacific E-Brokerage Market In The United Kingdom Revenue Share (%), by Investor 2025 & 2033
- Figure 54: Asia Pacific E-Brokerage Market In The United Kingdom Volume Share (%), by Investor 2025 & 2033
- Figure 55: Asia Pacific E-Brokerage Market In The United Kingdom Revenue (Million), by Operation 2025 & 2033
- Figure 56: Asia Pacific E-Brokerage Market In The United Kingdom Volume (Million), by Operation 2025 & 2033
- Figure 57: Asia Pacific E-Brokerage Market In The United Kingdom Revenue Share (%), by Operation 2025 & 2033
- Figure 58: Asia Pacific E-Brokerage Market In The United Kingdom Volume Share (%), by Operation 2025 & 2033
- Figure 59: Asia Pacific E-Brokerage Market In The United Kingdom Revenue (Million), by Country 2025 & 2033
- Figure 60: Asia Pacific E-Brokerage Market In The United Kingdom Volume (Million), by Country 2025 & 2033
- Figure 61: Asia Pacific E-Brokerage Market In The United Kingdom Revenue Share (%), by Country 2025 & 2033
- Figure 62: Asia Pacific E-Brokerage Market In The United Kingdom Volume Share (%), by Country 2025 & 2033
List of Tables
- Table 1: Global E-Brokerage Market In The United Kingdom Revenue Million Forecast, by Investor 2020 & 2033
- Table 2: Global E-Brokerage Market In The United Kingdom Volume Million Forecast, by Investor 2020 & 2033
- Table 3: Global E-Brokerage Market In The United Kingdom Revenue Million Forecast, by Operation 2020 & 2033
- Table 4: Global E-Brokerage Market In The United Kingdom Volume Million Forecast, by Operation 2020 & 2033
- Table 5: Global E-Brokerage Market In The United Kingdom Revenue Million Forecast, by Region 2020 & 2033
- Table 6: Global E-Brokerage Market In The United Kingdom Volume Million Forecast, by Region 2020 & 2033
- Table 7: Global E-Brokerage Market In The United Kingdom Revenue Million Forecast, by Investor 2020 & 2033
- Table 8: Global E-Brokerage Market In The United Kingdom Volume Million Forecast, by Investor 2020 & 2033
- Table 9: Global E-Brokerage Market In The United Kingdom Revenue Million Forecast, by Operation 2020 & 2033
- Table 10: Global E-Brokerage Market In The United Kingdom Volume Million Forecast, by Operation 2020 & 2033
- Table 11: Global E-Brokerage Market In The United Kingdom Revenue Million Forecast, by Country 2020 & 2033
- Table 12: Global E-Brokerage Market In The United Kingdom Volume Million Forecast, by Country 2020 & 2033
- Table 13: United States E-Brokerage Market In The United Kingdom Revenue (Million) Forecast, by Application 2020 & 2033
- Table 14: United States E-Brokerage Market In The United Kingdom Volume (Million) Forecast, by Application 2020 & 2033
- Table 15: Canada E-Brokerage Market In The United Kingdom Revenue (Million) Forecast, by Application 2020 & 2033
- Table 16: Canada E-Brokerage Market In The United Kingdom Volume (Million) Forecast, by Application 2020 & 2033
- Table 17: Mexico E-Brokerage Market In The United Kingdom Revenue (Million) Forecast, by Application 2020 & 2033
- Table 18: Mexico E-Brokerage Market In The United Kingdom Volume (Million) Forecast, by Application 2020 & 2033
- Table 19: Global E-Brokerage Market In The United Kingdom Revenue Million Forecast, by Investor 2020 & 2033
- Table 20: Global E-Brokerage Market In The United Kingdom Volume Million Forecast, by Investor 2020 & 2033
- Table 21: Global E-Brokerage Market In The United Kingdom Revenue Million Forecast, by Operation 2020 & 2033
- Table 22: Global E-Brokerage Market In The United Kingdom Volume Million Forecast, by Operation 2020 & 2033
- Table 23: Global E-Brokerage Market In The United Kingdom Revenue Million Forecast, by Country 2020 & 2033
- Table 24: Global E-Brokerage Market In The United Kingdom Volume Million Forecast, by Country 2020 & 2033
- Table 25: Brazil E-Brokerage Market In The United Kingdom Revenue (Million) Forecast, by Application 2020 & 2033
- Table 26: Brazil E-Brokerage Market In The United Kingdom Volume (Million) Forecast, by Application 2020 & 2033
- Table 27: Argentina E-Brokerage Market In The United Kingdom Revenue (Million) Forecast, by Application 2020 & 2033
- Table 28: Argentina E-Brokerage Market In The United Kingdom Volume (Million) Forecast, by Application 2020 & 2033
- Table 29: Rest of South America E-Brokerage Market In The United Kingdom Revenue (Million) Forecast, by Application 2020 & 2033
- Table 30: Rest of South America E-Brokerage Market In The United Kingdom Volume (Million) Forecast, by Application 2020 & 2033
- Table 31: Global E-Brokerage Market In The United Kingdom Revenue Million Forecast, by Investor 2020 & 2033
- Table 32: Global E-Brokerage Market In The United Kingdom Volume Million Forecast, by Investor 2020 & 2033
- Table 33: Global E-Brokerage Market In The United Kingdom Revenue Million Forecast, by Operation 2020 & 2033
- Table 34: Global E-Brokerage Market In The United Kingdom Volume Million Forecast, by Operation 2020 & 2033
- Table 35: Global E-Brokerage Market In The United Kingdom Revenue Million Forecast, by Country 2020 & 2033
- Table 36: Global E-Brokerage Market In The United Kingdom Volume Million Forecast, by Country 2020 & 2033
- Table 37: United Kingdom E-Brokerage Market In The United Kingdom Revenue (Million) Forecast, by Application 2020 & 2033
- Table 38: United Kingdom E-Brokerage Market In The United Kingdom Volume (Million) Forecast, by Application 2020 & 2033
- Table 39: Germany E-Brokerage Market In The United Kingdom Revenue (Million) Forecast, by Application 2020 & 2033
- Table 40: Germany E-Brokerage Market In The United Kingdom Volume (Million) Forecast, by Application 2020 & 2033
- Table 41: France E-Brokerage Market In The United Kingdom Revenue (Million) Forecast, by Application 2020 & 2033
- Table 42: France E-Brokerage Market In The United Kingdom Volume (Million) Forecast, by Application 2020 & 2033
- Table 43: Italy E-Brokerage Market In The United Kingdom Revenue (Million) Forecast, by Application 2020 & 2033
- Table 44: Italy E-Brokerage Market In The United Kingdom Volume (Million) Forecast, by Application 2020 & 2033
- Table 45: Spain E-Brokerage Market In The United Kingdom Revenue (Million) Forecast, by Application 2020 & 2033
- Table 46: Spain E-Brokerage Market In The United Kingdom Volume (Million) Forecast, by Application 2020 & 2033
- Table 47: Russia E-Brokerage Market In The United Kingdom Revenue (Million) Forecast, by Application 2020 & 2033
- Table 48: Russia E-Brokerage Market In The United Kingdom Volume (Million) Forecast, by Application 2020 & 2033
- Table 49: Benelux E-Brokerage Market In The United Kingdom Revenue (Million) Forecast, by Application 2020 & 2033
- Table 50: Benelux E-Brokerage Market In The United Kingdom Volume (Million) Forecast, by Application 2020 & 2033
- Table 51: Nordics E-Brokerage Market In The United Kingdom Revenue (Million) Forecast, by Application 2020 & 2033
- Table 52: Nordics E-Brokerage Market In The United Kingdom Volume (Million) Forecast, by Application 2020 & 2033
- Table 53: Rest of Europe E-Brokerage Market In The United Kingdom Revenue (Million) Forecast, by Application 2020 & 2033
- Table 54: Rest of Europe E-Brokerage Market In The United Kingdom Volume (Million) Forecast, by Application 2020 & 2033
- Table 55: Global E-Brokerage Market In The United Kingdom Revenue Million Forecast, by Investor 2020 & 2033
- Table 56: Global E-Brokerage Market In The United Kingdom Volume Million Forecast, by Investor 2020 & 2033
- Table 57: Global E-Brokerage Market In The United Kingdom Revenue Million Forecast, by Operation 2020 & 2033
- Table 58: Global E-Brokerage Market In The United Kingdom Volume Million Forecast, by Operation 2020 & 2033
- Table 59: Global E-Brokerage Market In The United Kingdom Revenue Million Forecast, by Country 2020 & 2033
- Table 60: Global E-Brokerage Market In The United Kingdom Volume Million Forecast, by Country 2020 & 2033
- Table 61: Turkey E-Brokerage Market In The United Kingdom Revenue (Million) Forecast, by Application 2020 & 2033
- Table 62: Turkey E-Brokerage Market In The United Kingdom Volume (Million) Forecast, by Application 2020 & 2033
- Table 63: Israel E-Brokerage Market In The United Kingdom Revenue (Million) Forecast, by Application 2020 & 2033
- Table 64: Israel E-Brokerage Market In The United Kingdom Volume (Million) Forecast, by Application 2020 & 2033
- Table 65: GCC E-Brokerage Market In The United Kingdom Revenue (Million) Forecast, by Application 2020 & 2033
- Table 66: GCC E-Brokerage Market In The United Kingdom Volume (Million) Forecast, by Application 2020 & 2033
- Table 67: North Africa E-Brokerage Market In The United Kingdom Revenue (Million) Forecast, by Application 2020 & 2033
- Table 68: North Africa E-Brokerage Market In The United Kingdom Volume (Million) Forecast, by Application 2020 & 2033
- Table 69: South Africa E-Brokerage Market In The United Kingdom Revenue (Million) Forecast, by Application 2020 & 2033
- Table 70: South Africa E-Brokerage Market In The United Kingdom Volume (Million) Forecast, by Application 2020 & 2033
- Table 71: Rest of Middle East & Africa E-Brokerage Market In The United Kingdom Revenue (Million) Forecast, by Application 2020 & 2033
- Table 72: Rest of Middle East & Africa E-Brokerage Market In The United Kingdom Volume (Million) Forecast, by Application 2020 & 2033
- Table 73: Global E-Brokerage Market In The United Kingdom Revenue Million Forecast, by Investor 2020 & 2033
- Table 74: Global E-Brokerage Market In The United Kingdom Volume Million Forecast, by Investor 2020 & 2033
- Table 75: Global E-Brokerage Market In The United Kingdom Revenue Million Forecast, by Operation 2020 & 2033
- Table 76: Global E-Brokerage Market In The United Kingdom Volume Million Forecast, by Operation 2020 & 2033
- Table 77: Global E-Brokerage Market In The United Kingdom Revenue Million Forecast, by Country 2020 & 2033
- Table 78: Global E-Brokerage Market In The United Kingdom Volume Million Forecast, by Country 2020 & 2033
- Table 79: China E-Brokerage Market In The United Kingdom Revenue (Million) Forecast, by Application 2020 & 2033
- Table 80: China E-Brokerage Market In The United Kingdom Volume (Million) Forecast, by Application 2020 & 2033
- Table 81: India E-Brokerage Market In The United Kingdom Revenue (Million) Forecast, by Application 2020 & 2033
- Table 82: India E-Brokerage Market In The United Kingdom Volume (Million) Forecast, by Application 2020 & 2033
- Table 83: Japan E-Brokerage Market In The United Kingdom Revenue (Million) Forecast, by Application 2020 & 2033
- Table 84: Japan E-Brokerage Market In The United Kingdom Volume (Million) Forecast, by Application 2020 & 2033
- Table 85: South Korea E-Brokerage Market In The United Kingdom Revenue (Million) Forecast, by Application 2020 & 2033
- Table 86: South Korea E-Brokerage Market In The United Kingdom Volume (Million) Forecast, by Application 2020 & 2033
- Table 87: ASEAN E-Brokerage Market In The United Kingdom Revenue (Million) Forecast, by Application 2020 & 2033
- Table 88: ASEAN E-Brokerage Market In The United Kingdom Volume (Million) Forecast, by Application 2020 & 2033
- Table 89: Oceania E-Brokerage Market In The United Kingdom Revenue (Million) Forecast, by Application 2020 & 2033
- Table 90: Oceania E-Brokerage Market In The United Kingdom Volume (Million) Forecast, by Application 2020 & 2033
- Table 91: Rest of Asia Pacific E-Brokerage Market In The United Kingdom Revenue (Million) Forecast, by Application 2020 & 2033
- Table 92: Rest of Asia Pacific E-Brokerage Market In The United Kingdom Volume (Million) Forecast, by Application 2020 & 2033
Frequently Asked Questions
1. What is the projected Compound Annual Growth Rate (CAGR) of the E-Brokerage Market In The United Kingdom?
The projected CAGR is approximately 2.83%.
2. Which companies are prominent players in the E-Brokerage Market In The United Kingdom?
Key companies in the market include eToro, Peperstone, Plus, Capital com, IG Group, City Index, Robinhood, AvaTrade, Monesta Markets, Stocktrade.
3. What are the main segments of the E-Brokerage Market In The United Kingdom?
The market segments include Investor, Operation.
4. Can you provide details about the market size?
The market size is estimated to be USD 693.77 Million as of 2022.
5. What are some drivers contributing to market growth?
Convenience and Cost-Effectiveness; Real Time Analysis of Market Available In E-Brokerage Platforms.
6. What are the notable trends driving market growth?
Rising Digital Innovation & Adoption of Artificial Intelligence (AI) and Machine Learning (ML).
7. Are there any restraints impacting market growth?
Convenience and Cost-Effectiveness; Real Time Analysis of Market Available In E-Brokerage Platforms.
8. Can you provide examples of recent developments in the market?
In March 2023, the United Kingdom broking firm Cenkos merged with FinnCap. Post merger both companies own a 50% share of the new firm with the company being named FinnCap. The merger will strengthen the position of both firms with an increase in clients and new customers.
9. What pricing options are available for accessing the report?
Pricing options include single-user, multi-user, and enterprise licenses priced at USD 3800, USD 4500, and USD 5800 respectively.
10. Is the market size provided in terms of value or volume?
The market size is provided in terms of value, measured in Million and volume, measured in Million.
11. Are there any specific market keywords associated with the report?
Yes, the market keyword associated with the report is "E-Brokerage Market In The United Kingdom," which aids in identifying and referencing the specific market segment covered.
12. How do I determine which pricing option suits my needs best?
The pricing options vary based on user requirements and access needs. Individual users may opt for single-user licenses, while businesses requiring broader access may choose multi-user or enterprise licenses for cost-effective access to the report.
13. Are there any additional resources or data provided in the E-Brokerage Market In The United Kingdom report?
While the report offers comprehensive insights, it's advisable to review the specific contents or supplementary materials provided to ascertain if additional resources or data are available.
14. How can I stay updated on further developments or reports in the E-Brokerage Market In The United Kingdom?
To stay informed about further developments, trends, and reports in the E-Brokerage Market In The United Kingdom, consider subscribing to industry newsletters, following relevant companies and organizations, or regularly checking reputable industry news sources and publications.
Methodology
Step 1 - Identification of Relevant Samples Size from Population Database


Step 2 - Approaches for Defining Global Market Size (Value, Volume* & Price*)

Note*: In applicable scenarios
Step 3 - Data Sources
Primary Research
- Web Analytics
- Survey Reports
- Research Institute
- Latest Research Reports
- Opinion Leaders
Secondary Research
- Annual Reports
- White Paper
- Latest Press Release
- Industry Association
- Paid Database
- Investor Presentations

Step 4 - Data Triangulation
Involves using different sources of information in order to increase the validity of a study
These sources are likely to be stakeholders in a program - participants, other researchers, program staff, other community members, and so on.
Then we put all data in single framework & apply various statistical tools to find out the dynamic on the market.
During the analysis stage, feedback from the stakeholder groups would be compared to determine areas of agreement as well as areas of divergence