

Key Insights
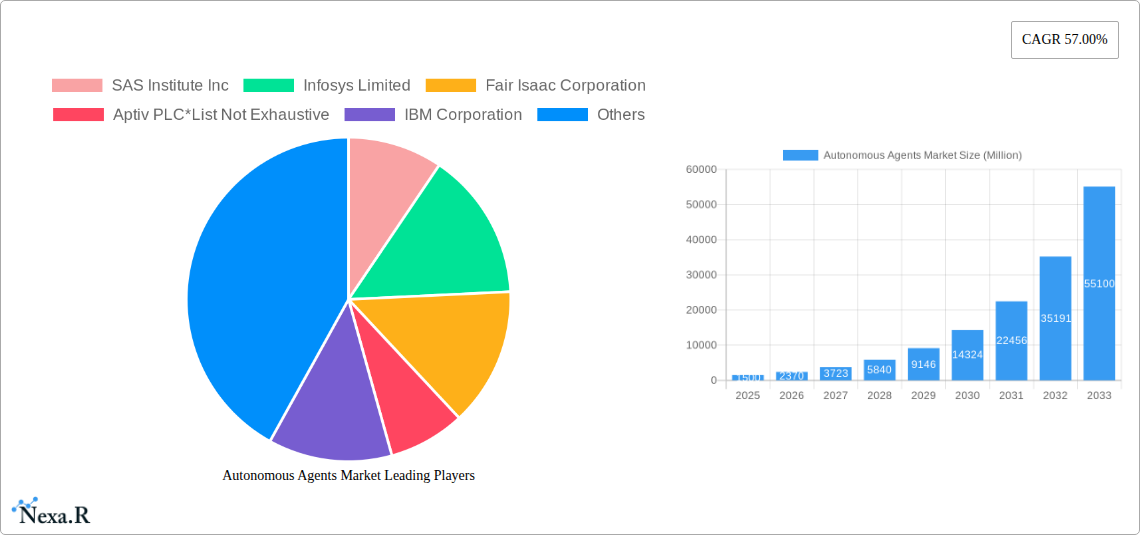
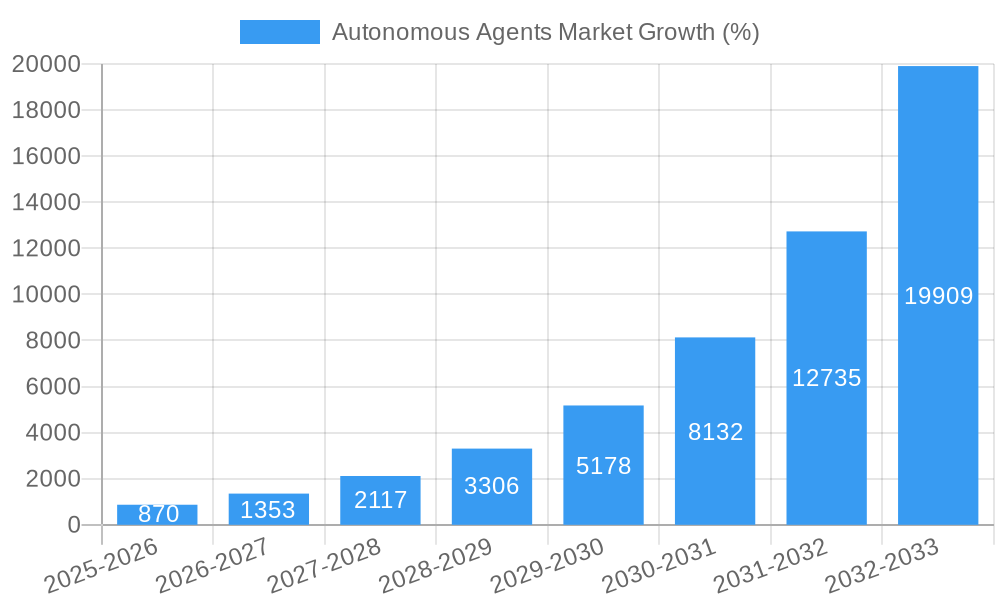
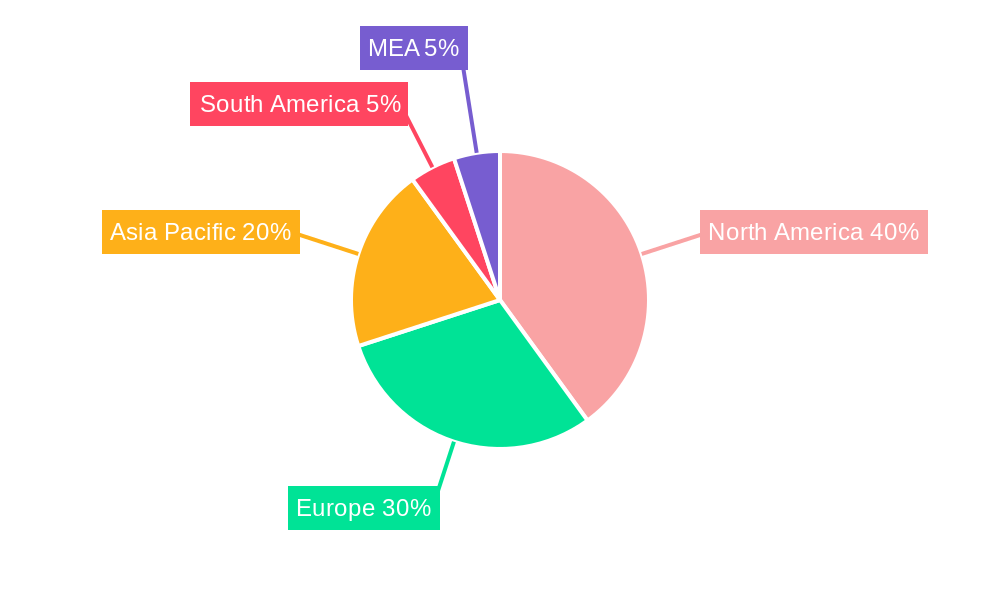
The Autonomous Agents market is experiencing explosive growth, projected to reach a significant size by 2033, driven by a remarkable Compound Annual Growth Rate (CAGR) of 57%. This surge is fueled by several key factors. The increasing adoption of cloud-based solutions provides scalability and accessibility, while advancements in artificial intelligence (AI) and machine learning (ML) are enhancing the capabilities and sophistication of these agents. Furthermore, the rising demand for automation across various industries, particularly in BFSI, IT & Telecom, and Healthcare, is a major catalyst. Large enterprises are leading the adoption, recognizing the potential for increased efficiency, reduced operational costs, and improved decision-making. However, challenges remain, including concerns regarding data security, regulatory hurdles surrounding AI deployment, and the need for skilled professionals to develop and maintain these complex systems. The market segmentation reveals a strong preference for cloud deployment, indicating a trend towards flexible and scalable solutions. Geographic distribution suggests North America and Europe currently hold significant market share, but the Asia-Pacific region is poised for rapid growth, driven by increasing digitalization and technological advancements in countries like China and India.
The competitive landscape is dynamic, with established players like SAS Institute, IBM, and Microsoft alongside emerging innovators like Affectiva and Fetch.ai. This competition fosters innovation and drives down costs, making autonomous agents accessible to a wider range of businesses. Future growth will be significantly influenced by technological breakthroughs in AI and ML, the development of more robust security measures, and the creation of standardized regulatory frameworks. The continued expansion into new industry verticals, particularly those with substantial data processing needs like transportation and logistics, will further propel market expansion. The forecast period (2025-2033) presents significant opportunities for both established and emerging players to capitalize on this rapidly evolving market. Strategic partnerships, acquisitions, and the development of innovative applications will be crucial for achieving competitive advantage in this burgeoning sector.
Autonomous Agents Market: A Comprehensive Market Analysis (2019-2033)
This comprehensive report provides a detailed analysis of the Autonomous Agents market, encompassing market dynamics, growth trends, regional dominance, product landscape, and key players. The study period covers 2019-2033, with a base year of 2025 and a forecast period of 2025-2033. The report segments the market by deployment type (Cloud, On-Premises), organization size (SMEs, Large Enterprises), and industry vertical (BFSI, IT & Telecom, Healthcare, Manufacturing, Transportation & Mobility, Other). The market is projected to reach xx Million by 2033.
Autonomous Agents Market Market Dynamics & Structure
The Autonomous Agents market exhibits a moderately concentrated structure, with key players such as SAS Institute Inc, Infosys Limited, Fair Isaac Corporation, Aptiv PLC, IBM Corporation, Google LLC, Nuance Communications, Salesforce com Inc, Microsoft Corporation, Affectiva Inc, Amazon Web Services Inc, Fetch ai, Oracle Corporation, Intel Corporation, and SAP SE holding significant market share. However, the market is witnessing increased competition from emerging players and startups.
- Market Concentration: The top 5 players hold approximately xx% of the market share in 2025.
- Technological Innovation: Advancements in AI, machine learning, and natural language processing are key drivers. However, challenges remain in ensuring robustness, explainability, and ethical considerations.
- Regulatory Frameworks: Evolving data privacy regulations (e.g., GDPR, CCPA) and industry-specific compliance requirements impact market growth.
- Competitive Substitutes: Traditional rule-based systems pose competition, although autonomous agents offer superior adaptability and efficiency.
- End-User Demographics: Large enterprises are currently the dominant adopters, but SMEs are showing increasing interest.
- M&A Trends: The number of M&A deals in the Autonomous Agents market increased to xx in 2024, driven by the need for technological expansion and market consolidation.
Autonomous Agents Market Growth Trends & Insights
The Autonomous Agents market witnessed robust growth during the historical period (2019-2024), expanding at a CAGR of xx%. This growth is primarily attributed to the increasing adoption of AI-powered solutions across various industries. The market size reached xx Million in 2024 and is projected to reach xx Million in 2025, further expanding at a CAGR of xx% during the forecast period (2025-2033). Factors like rising demand for automation, improved computational power, and the availability of large datasets are driving this growth. However, concerns related to data security and ethical considerations may pose some challenges. The market penetration rate is expected to increase from xx% in 2025 to xx% by 2033. Technological disruptions, particularly in the areas of edge computing and blockchain technology, are expected to further accelerate market growth. Consumer behavior shifts towards personalized and automated services are also fueling demand.
Dominant Regions, Countries, or Segments in Autonomous Agents Market
North America currently holds the largest market share in the Autonomous Agents market, driven by significant investments in AI and the presence of major technology companies. Europe follows closely, with strong adoption across various sectors. Within segments, the Cloud deployment type is experiencing the fastest growth, exceeding On-Premises deployment. Large enterprises are leading adoption rates, due to their resources and ability to implement complex solutions. The BFSI and IT & Telecom sectors are currently the most significant adopters, owing to their high demand for automation and data analysis capabilities.
- Key Drivers:
- North America: High investment in R&D, advanced technological infrastructure.
- Europe: Strong government support for digital transformation initiatives, stringent data privacy regulations.
- Cloud Deployment: Scalability, cost-effectiveness, ease of implementation.
- Large Enterprises: Resource availability, strategic focus on digital transformation.
- BFSI: High demand for fraud detection, risk management, and personalized customer service.
- IT & Telecom: Need for efficient network management, customer support, and cybersecurity.
Autonomous Agents Market Product Landscape
Autonomous agents are evolving rapidly, featuring improved capabilities in natural language processing, decision-making, and integration with existing systems. New products are incorporating enhanced security features and explainable AI techniques to address concerns about transparency and accountability. The focus is shifting towards developing agents that can seamlessly integrate with various platforms and offer customized solutions for different industry needs. Unique selling propositions are centered around improved efficiency, reduced operational costs, and enhanced user experience.
Key Drivers, Barriers & Challenges in Autonomous Agents Market
Key Drivers: The increasing need for automation, data-driven decision making, and personalized customer experiences fuels market growth. Technological advancements in AI and machine learning are driving the development of more sophisticated and adaptable agents. Government initiatives promoting digital transformation further accelerate adoption.
Key Challenges: The high cost of development and implementation, the complexity of integrating autonomous agents with existing systems, and concerns around data security and ethical implications pose challenges. Supply chain disruptions can impact the availability of necessary components, potentially slowing down market growth.
Emerging Opportunities in Autonomous Agents Market
Untapped markets include sectors such as agriculture, energy, and education, where the adoption of autonomous agents can significantly improve efficiency and productivity. Emerging opportunities lie in developing agents that can operate in complex and dynamic environments. Furthermore, the development of more explainable and transparent AI solutions will address concerns about trust and accountability, promoting wider adoption.
Growth Accelerators in the Autonomous Agents Market Industry
Strategic partnerships between technology providers and industry leaders are accelerating market growth. Focus on developing agents with specialized capabilities for specific industries will further expand market adoption. Continuous technological advancements, particularly in AI and machine learning, are essential for driving innovation and creating new applications for autonomous agents.
Key Players Shaping the Autonomous Agents Market Market
- SAS Institute Inc
- Infosys Limited
- Fair Isaac Corporation
- Aptiv PLC
- IBM Corporation
- Google LLC
- Nuance Communications
- Salesforce com Inc
- Microsoft Corporation
- Affectiva Inc
- Amazon Web Services Inc
- Fetch ai
- Oracle Corporation
- Intel Corporation
- SAP SE
Notable Milestones in Autonomous Agents Market Sector
- 2022 Q3: Launch of a new autonomous agent platform by Google LLC, integrating enhanced security features.
- 2023 Q1: Partnership between IBM Corporation and a leading financial institution to develop a fraud detection system.
- 2024 Q2: Acquisition of a promising AI startup by Microsoft Corporation, expanding its portfolio of autonomous agents.
In-Depth Autonomous Agents Market Market Outlook
The Autonomous Agents market is poised for sustained growth, driven by ongoing technological advancements, increased investment in AI, and rising demand for automation across various industries. Strategic opportunities exist in developing specialized agents for niche markets and in addressing the challenges of data security, transparency, and ethical considerations. The future market potential is significant, with widespread adoption expected across diverse sectors.
Autonomous Agents Market Segmentation
-
1. Deployment Type
- 1.1. Cloud
- 1.2. On-Premises
-
2. Organization Size
- 2.1. Small & Medium-Sized Enterprises (SMEs)
- 2.2. Large Enterprises
-
3. Industry Vertical
- 3.1. BFSI
- 3.2. IT &Telecom
- 3.3. Healthcare
- 3.4. Manufacturing
- 3.5. Transportation & Mobility
- 3.6. Other Industry Verticals
Autonomous Agents Market Segmentation By Geography
- 1. North America
- 2. Europe
- 3. Asia Pacific
- 4. Latin America
- 5. Middle East
Autonomous Agents Market REPORT HIGHLIGHTS
| Aspects | Details |
|---|---|
| Study Period | 2019-2033 |
| Base Year | 2024 |
| Estimated Year | 2025 |
| Forecast Period | 2025-2033 |
| Historical Period | 2019-2024 |
| Growth Rate | CAGR of 57.00% from 2019-2033 |
| Segmentation |
|
Table of Contents
- 1. Introduction
- 1.1. Research Scope
- 1.2. Market Segmentation
- 1.3. Research Methodology
- 1.4. Definitions and Assumptions
- 2. Executive Summary
- 2.1. Introduction
- 3. Market Dynamics
- 3.1. Introduction
- 3.2. Market Drivers
- 3.2.1. ; Rising Number of AI Applications; Growing Presence of Parallel Computational Resources
- 3.3. Market Restrains
- 3.3.1. Maintaining the Privacy and Integrity of Patient Data
- 3.4. Market Trends
- 3.4.1. Transportation and Mobility Segments to Dominate the Market
- 4. Market Factor Analysis
- 4.1. Porters Five Forces
- 4.2. Supply/Value Chain
- 4.3. PESTEL analysis
- 4.4. Market Entropy
- 4.5. Patent/Trademark Analysis
- 5. Global Autonomous Agents Market Analysis, Insights and Forecast, 2019-2031
- 5.1. Market Analysis, Insights and Forecast - by Deployment Type
- 5.1.1. Cloud
- 5.1.2. On-Premises
- 5.2. Market Analysis, Insights and Forecast - by Organization Size
- 5.2.1. Small & Medium-Sized Enterprises (SMEs)
- 5.2.2. Large Enterprises
- 5.3. Market Analysis, Insights and Forecast - by Industry Vertical
- 5.3.1. BFSI
- 5.3.2. IT &Telecom
- 5.3.3. Healthcare
- 5.3.4. Manufacturing
- 5.3.5. Transportation & Mobility
- 5.3.6. Other Industry Verticals
- 5.4. Market Analysis, Insights and Forecast - by Region
- 5.4.1. North America
- 5.4.2. Europe
- 5.4.3. Asia Pacific
- 5.4.4. Latin America
- 5.4.5. Middle East
- 5.1. Market Analysis, Insights and Forecast - by Deployment Type
- 6. North America Autonomous Agents Market Analysis, Insights and Forecast, 2019-2031
- 6.1. Market Analysis, Insights and Forecast - by Deployment Type
- 6.1.1. Cloud
- 6.1.2. On-Premises
- 6.2. Market Analysis, Insights and Forecast - by Organization Size
- 6.2.1. Small & Medium-Sized Enterprises (SMEs)
- 6.2.2. Large Enterprises
- 6.3. Market Analysis, Insights and Forecast - by Industry Vertical
- 6.3.1. BFSI
- 6.3.2. IT &Telecom
- 6.3.3. Healthcare
- 6.3.4. Manufacturing
- 6.3.5. Transportation & Mobility
- 6.3.6. Other Industry Verticals
- 6.1. Market Analysis, Insights and Forecast - by Deployment Type
- 7. Europe Autonomous Agents Market Analysis, Insights and Forecast, 2019-2031
- 7.1. Market Analysis, Insights and Forecast - by Deployment Type
- 7.1.1. Cloud
- 7.1.2. On-Premises
- 7.2. Market Analysis, Insights and Forecast - by Organization Size
- 7.2.1. Small & Medium-Sized Enterprises (SMEs)
- 7.2.2. Large Enterprises
- 7.3. Market Analysis, Insights and Forecast - by Industry Vertical
- 7.3.1. BFSI
- 7.3.2. IT &Telecom
- 7.3.3. Healthcare
- 7.3.4. Manufacturing
- 7.3.5. Transportation & Mobility
- 7.3.6. Other Industry Verticals
- 7.1. Market Analysis, Insights and Forecast - by Deployment Type
- 8. Asia Pacific Autonomous Agents Market Analysis, Insights and Forecast, 2019-2031
- 8.1. Market Analysis, Insights and Forecast - by Deployment Type
- 8.1.1. Cloud
- 8.1.2. On-Premises
- 8.2. Market Analysis, Insights and Forecast - by Organization Size
- 8.2.1. Small & Medium-Sized Enterprises (SMEs)
- 8.2.2. Large Enterprises
- 8.3. Market Analysis, Insights and Forecast - by Industry Vertical
- 8.3.1. BFSI
- 8.3.2. IT &Telecom
- 8.3.3. Healthcare
- 8.3.4. Manufacturing
- 8.3.5. Transportation & Mobility
- 8.3.6. Other Industry Verticals
- 8.1. Market Analysis, Insights and Forecast - by Deployment Type
- 9. Latin America Autonomous Agents Market Analysis, Insights and Forecast, 2019-2031
- 9.1. Market Analysis, Insights and Forecast - by Deployment Type
- 9.1.1. Cloud
- 9.1.2. On-Premises
- 9.2. Market Analysis, Insights and Forecast - by Organization Size
- 9.2.1. Small & Medium-Sized Enterprises (SMEs)
- 9.2.2. Large Enterprises
- 9.3. Market Analysis, Insights and Forecast - by Industry Vertical
- 9.3.1. BFSI
- 9.3.2. IT &Telecom
- 9.3.3. Healthcare
- 9.3.4. Manufacturing
- 9.3.5. Transportation & Mobility
- 9.3.6. Other Industry Verticals
- 9.1. Market Analysis, Insights and Forecast - by Deployment Type
- 10. Middle East Autonomous Agents Market Analysis, Insights and Forecast, 2019-2031
- 10.1. Market Analysis, Insights and Forecast - by Deployment Type
- 10.1.1. Cloud
- 10.1.2. On-Premises
- 10.2. Market Analysis, Insights and Forecast - by Organization Size
- 10.2.1. Small & Medium-Sized Enterprises (SMEs)
- 10.2.2. Large Enterprises
- 10.3. Market Analysis, Insights and Forecast - by Industry Vertical
- 10.3.1. BFSI
- 10.3.2. IT &Telecom
- 10.3.3. Healthcare
- 10.3.4. Manufacturing
- 10.3.5. Transportation & Mobility
- 10.3.6. Other Industry Verticals
- 10.1. Market Analysis, Insights and Forecast - by Deployment Type
- 11. North America Autonomous Agents Market Analysis, Insights and Forecast, 2019-2031
- 11.1. Market Analysis, Insights and Forecast - By Country/Sub-region
- 11.1.1 United States
- 11.1.2 Canada
- 11.1.3 Mexico
- 12. Europe Autonomous Agents Market Analysis, Insights and Forecast, 2019-2031
- 12.1. Market Analysis, Insights and Forecast - By Country/Sub-region
- 12.1.1 Germany
- 12.1.2 United Kingdom
- 12.1.3 France
- 12.1.4 Spain
- 12.1.5 Italy
- 12.1.6 Spain
- 12.1.7 Belgium
- 12.1.8 Netherland
- 12.1.9 Nordics
- 12.1.10 Rest of Europe
- 13. Asia Pacific Autonomous Agents Market Analysis, Insights and Forecast, 2019-2031
- 13.1. Market Analysis, Insights and Forecast - By Country/Sub-region
- 13.1.1 China
- 13.1.2 Japan
- 13.1.3 India
- 13.1.4 South Korea
- 13.1.5 Southeast Asia
- 13.1.6 Australia
- 13.1.7 Indonesia
- 13.1.8 Phillipes
- 13.1.9 Singapore
- 13.1.10 Thailandc
- 13.1.11 Rest of Asia Pacific
- 14. South America Autonomous Agents Market Analysis, Insights and Forecast, 2019-2031
- 14.1. Market Analysis, Insights and Forecast - By Country/Sub-region
- 14.1.1 Brazil
- 14.1.2 Argentina
- 14.1.3 Peru
- 14.1.4 Chile
- 14.1.5 Colombia
- 14.1.6 Ecuador
- 14.1.7 Venezuela
- 14.1.8 Rest of South America
- 15. North America Autonomous Agents Market Analysis, Insights and Forecast, 2019-2031
- 15.1. Market Analysis, Insights and Forecast - By Country/Sub-region
- 15.1.1 United States
- 15.1.2 Canada
- 15.1.3 Mexico
- 16. MEA Autonomous Agents Market Analysis, Insights and Forecast, 2019-2031
- 16.1. Market Analysis, Insights and Forecast - By Country/Sub-region
- 16.1.1 United Arab Emirates
- 16.1.2 Saudi Arabia
- 16.1.3 South Africa
- 16.1.4 Rest of Middle East and Africa
- 17. Competitive Analysis
- 17.1. Global Market Share Analysis 2024
- 17.2. Company Profiles
- 17.2.1 SAS Institute Inc
- 17.2.1.1. Overview
- 17.2.1.2. Products
- 17.2.1.3. SWOT Analysis
- 17.2.1.4. Recent Developments
- 17.2.1.5. Financials (Based on Availability)
- 17.2.2 Infosys Limited
- 17.2.2.1. Overview
- 17.2.2.2. Products
- 17.2.2.3. SWOT Analysis
- 17.2.2.4. Recent Developments
- 17.2.2.5. Financials (Based on Availability)
- 17.2.3 Fair Isaac Corporation
- 17.2.3.1. Overview
- 17.2.3.2. Products
- 17.2.3.3. SWOT Analysis
- 17.2.3.4. Recent Developments
- 17.2.3.5. Financials (Based on Availability)
- 17.2.4 Aptiv PLC*List Not Exhaustive
- 17.2.4.1. Overview
- 17.2.4.2. Products
- 17.2.4.3. SWOT Analysis
- 17.2.4.4. Recent Developments
- 17.2.4.5. Financials (Based on Availability)
- 17.2.5 IBM Corporation
- 17.2.5.1. Overview
- 17.2.5.2. Products
- 17.2.5.3. SWOT Analysis
- 17.2.5.4. Recent Developments
- 17.2.5.5. Financials (Based on Availability)
- 17.2.6 Google LLC
- 17.2.6.1. Overview
- 17.2.6.2. Products
- 17.2.6.3. SWOT Analysis
- 17.2.6.4. Recent Developments
- 17.2.6.5. Financials (Based on Availability)
- 17.2.7 Nuance Communications
- 17.2.7.1. Overview
- 17.2.7.2. Products
- 17.2.7.3. SWOT Analysis
- 17.2.7.4. Recent Developments
- 17.2.7.5. Financials (Based on Availability)
- 17.2.8 Salesforce com Inc
- 17.2.8.1. Overview
- 17.2.8.2. Products
- 17.2.8.3. SWOT Analysis
- 17.2.8.4. Recent Developments
- 17.2.8.5. Financials (Based on Availability)
- 17.2.9 Microsoft Corporation
- 17.2.9.1. Overview
- 17.2.9.2. Products
- 17.2.9.3. SWOT Analysis
- 17.2.9.4. Recent Developments
- 17.2.9.5. Financials (Based on Availability)
- 17.2.10 Affectiva Inc
- 17.2.10.1. Overview
- 17.2.10.2. Products
- 17.2.10.3. SWOT Analysis
- 17.2.10.4. Recent Developments
- 17.2.10.5. Financials (Based on Availability)
- 17.2.11 Amazon Web Services Inc
- 17.2.11.1. Overview
- 17.2.11.2. Products
- 17.2.11.3. SWOT Analysis
- 17.2.11.4. Recent Developments
- 17.2.11.5. Financials (Based on Availability)
- 17.2.12 Fetch ai
- 17.2.12.1. Overview
- 17.2.12.2. Products
- 17.2.12.3. SWOT Analysis
- 17.2.12.4. Recent Developments
- 17.2.12.5. Financials (Based on Availability)
- 17.2.13 Oracle Corporation
- 17.2.13.1. Overview
- 17.2.13.2. Products
- 17.2.13.3. SWOT Analysis
- 17.2.13.4. Recent Developments
- 17.2.13.5. Financials (Based on Availability)
- 17.2.14 Intel Corporation
- 17.2.14.1. Overview
- 17.2.14.2. Products
- 17.2.14.3. SWOT Analysis
- 17.2.14.4. Recent Developments
- 17.2.14.5. Financials (Based on Availability)
- 17.2.15 SAP SE
- 17.2.15.1. Overview
- 17.2.15.2. Products
- 17.2.15.3. SWOT Analysis
- 17.2.15.4. Recent Developments
- 17.2.15.5. Financials (Based on Availability)
- 17.2.1 SAS Institute Inc
List of Figures
- Figure 1: Global Autonomous Agents Market Revenue Breakdown (Million, %) by Region 2024 & 2032
- Figure 2: North America Autonomous Agents Market Revenue (Million), by Country 2024 & 2032
- Figure 3: North America Autonomous Agents Market Revenue Share (%), by Country 2024 & 2032
- Figure 4: Europe Autonomous Agents Market Revenue (Million), by Country 2024 & 2032
- Figure 5: Europe Autonomous Agents Market Revenue Share (%), by Country 2024 & 2032
- Figure 6: Asia Pacific Autonomous Agents Market Revenue (Million), by Country 2024 & 2032
- Figure 7: Asia Pacific Autonomous Agents Market Revenue Share (%), by Country 2024 & 2032
- Figure 8: South America Autonomous Agents Market Revenue (Million), by Country 2024 & 2032
- Figure 9: South America Autonomous Agents Market Revenue Share (%), by Country 2024 & 2032
- Figure 10: North America Autonomous Agents Market Revenue (Million), by Country 2024 & 2032
- Figure 11: North America Autonomous Agents Market Revenue Share (%), by Country 2024 & 2032
- Figure 12: MEA Autonomous Agents Market Revenue (Million), by Country 2024 & 2032
- Figure 13: MEA Autonomous Agents Market Revenue Share (%), by Country 2024 & 2032
- Figure 14: North America Autonomous Agents Market Revenue (Million), by Deployment Type 2024 & 2032
- Figure 15: North America Autonomous Agents Market Revenue Share (%), by Deployment Type 2024 & 2032
- Figure 16: North America Autonomous Agents Market Revenue (Million), by Organization Size 2024 & 2032
- Figure 17: North America Autonomous Agents Market Revenue Share (%), by Organization Size 2024 & 2032
- Figure 18: North America Autonomous Agents Market Revenue (Million), by Industry Vertical 2024 & 2032
- Figure 19: North America Autonomous Agents Market Revenue Share (%), by Industry Vertical 2024 & 2032
- Figure 20: North America Autonomous Agents Market Revenue (Million), by Country 2024 & 2032
- Figure 21: North America Autonomous Agents Market Revenue Share (%), by Country 2024 & 2032
- Figure 22: Europe Autonomous Agents Market Revenue (Million), by Deployment Type 2024 & 2032
- Figure 23: Europe Autonomous Agents Market Revenue Share (%), by Deployment Type 2024 & 2032
- Figure 24: Europe Autonomous Agents Market Revenue (Million), by Organization Size 2024 & 2032
- Figure 25: Europe Autonomous Agents Market Revenue Share (%), by Organization Size 2024 & 2032
- Figure 26: Europe Autonomous Agents Market Revenue (Million), by Industry Vertical 2024 & 2032
- Figure 27: Europe Autonomous Agents Market Revenue Share (%), by Industry Vertical 2024 & 2032
- Figure 28: Europe Autonomous Agents Market Revenue (Million), by Country 2024 & 2032
- Figure 29: Europe Autonomous Agents Market Revenue Share (%), by Country 2024 & 2032
- Figure 30: Asia Pacific Autonomous Agents Market Revenue (Million), by Deployment Type 2024 & 2032
- Figure 31: Asia Pacific Autonomous Agents Market Revenue Share (%), by Deployment Type 2024 & 2032
- Figure 32: Asia Pacific Autonomous Agents Market Revenue (Million), by Organization Size 2024 & 2032
- Figure 33: Asia Pacific Autonomous Agents Market Revenue Share (%), by Organization Size 2024 & 2032
- Figure 34: Asia Pacific Autonomous Agents Market Revenue (Million), by Industry Vertical 2024 & 2032
- Figure 35: Asia Pacific Autonomous Agents Market Revenue Share (%), by Industry Vertical 2024 & 2032
- Figure 36: Asia Pacific Autonomous Agents Market Revenue (Million), by Country 2024 & 2032
- Figure 37: Asia Pacific Autonomous Agents Market Revenue Share (%), by Country 2024 & 2032
- Figure 38: Latin America Autonomous Agents Market Revenue (Million), by Deployment Type 2024 & 2032
- Figure 39: Latin America Autonomous Agents Market Revenue Share (%), by Deployment Type 2024 & 2032
- Figure 40: Latin America Autonomous Agents Market Revenue (Million), by Organization Size 2024 & 2032
- Figure 41: Latin America Autonomous Agents Market Revenue Share (%), by Organization Size 2024 & 2032
- Figure 42: Latin America Autonomous Agents Market Revenue (Million), by Industry Vertical 2024 & 2032
- Figure 43: Latin America Autonomous Agents Market Revenue Share (%), by Industry Vertical 2024 & 2032
- Figure 44: Latin America Autonomous Agents Market Revenue (Million), by Country 2024 & 2032
- Figure 45: Latin America Autonomous Agents Market Revenue Share (%), by Country 2024 & 2032
- Figure 46: Middle East Autonomous Agents Market Revenue (Million), by Deployment Type 2024 & 2032
- Figure 47: Middle East Autonomous Agents Market Revenue Share (%), by Deployment Type 2024 & 2032
- Figure 48: Middle East Autonomous Agents Market Revenue (Million), by Organization Size 2024 & 2032
- Figure 49: Middle East Autonomous Agents Market Revenue Share (%), by Organization Size 2024 & 2032
- Figure 50: Middle East Autonomous Agents Market Revenue (Million), by Industry Vertical 2024 & 2032
- Figure 51: Middle East Autonomous Agents Market Revenue Share (%), by Industry Vertical 2024 & 2032
- Figure 52: Middle East Autonomous Agents Market Revenue (Million), by Country 2024 & 2032
- Figure 53: Middle East Autonomous Agents Market Revenue Share (%), by Country 2024 & 2032
List of Tables
- Table 1: Global Autonomous Agents Market Revenue Million Forecast, by Region 2019 & 2032
- Table 2: Global Autonomous Agents Market Revenue Million Forecast, by Deployment Type 2019 & 2032
- Table 3: Global Autonomous Agents Market Revenue Million Forecast, by Organization Size 2019 & 2032
- Table 4: Global Autonomous Agents Market Revenue Million Forecast, by Industry Vertical 2019 & 2032
- Table 5: Global Autonomous Agents Market Revenue Million Forecast, by Region 2019 & 2032
- Table 6: Global Autonomous Agents Market Revenue Million Forecast, by Country 2019 & 2032
- Table 7: United States Autonomous Agents Market Revenue (Million) Forecast, by Application 2019 & 2032
- Table 8: Canada Autonomous Agents Market Revenue (Million) Forecast, by Application 2019 & 2032
- Table 9: Mexico Autonomous Agents Market Revenue (Million) Forecast, by Application 2019 & 2032
- Table 10: Global Autonomous Agents Market Revenue Million Forecast, by Country 2019 & 2032
- Table 11: Germany Autonomous Agents Market Revenue (Million) Forecast, by Application 2019 & 2032
- Table 12: United Kingdom Autonomous Agents Market Revenue (Million) Forecast, by Application 2019 & 2032
- Table 13: France Autonomous Agents Market Revenue (Million) Forecast, by Application 2019 & 2032
- Table 14: Spain Autonomous Agents Market Revenue (Million) Forecast, by Application 2019 & 2032
- Table 15: Italy Autonomous Agents Market Revenue (Million) Forecast, by Application 2019 & 2032
- Table 16: Spain Autonomous Agents Market Revenue (Million) Forecast, by Application 2019 & 2032
- Table 17: Belgium Autonomous Agents Market Revenue (Million) Forecast, by Application 2019 & 2032
- Table 18: Netherland Autonomous Agents Market Revenue (Million) Forecast, by Application 2019 & 2032
- Table 19: Nordics Autonomous Agents Market Revenue (Million) Forecast, by Application 2019 & 2032
- Table 20: Rest of Europe Autonomous Agents Market Revenue (Million) Forecast, by Application 2019 & 2032
- Table 21: Global Autonomous Agents Market Revenue Million Forecast, by Country 2019 & 2032
- Table 22: China Autonomous Agents Market Revenue (Million) Forecast, by Application 2019 & 2032
- Table 23: Japan Autonomous Agents Market Revenue (Million) Forecast, by Application 2019 & 2032
- Table 24: India Autonomous Agents Market Revenue (Million) Forecast, by Application 2019 & 2032
- Table 25: South Korea Autonomous Agents Market Revenue (Million) Forecast, by Application 2019 & 2032
- Table 26: Southeast Asia Autonomous Agents Market Revenue (Million) Forecast, by Application 2019 & 2032
- Table 27: Australia Autonomous Agents Market Revenue (Million) Forecast, by Application 2019 & 2032
- Table 28: Indonesia Autonomous Agents Market Revenue (Million) Forecast, by Application 2019 & 2032
- Table 29: Phillipes Autonomous Agents Market Revenue (Million) Forecast, by Application 2019 & 2032
- Table 30: Singapore Autonomous Agents Market Revenue (Million) Forecast, by Application 2019 & 2032
- Table 31: Thailandc Autonomous Agents Market Revenue (Million) Forecast, by Application 2019 & 2032
- Table 32: Rest of Asia Pacific Autonomous Agents Market Revenue (Million) Forecast, by Application 2019 & 2032
- Table 33: Global Autonomous Agents Market Revenue Million Forecast, by Country 2019 & 2032
- Table 34: Brazil Autonomous Agents Market Revenue (Million) Forecast, by Application 2019 & 2032
- Table 35: Argentina Autonomous Agents Market Revenue (Million) Forecast, by Application 2019 & 2032
- Table 36: Peru Autonomous Agents Market Revenue (Million) Forecast, by Application 2019 & 2032
- Table 37: Chile Autonomous Agents Market Revenue (Million) Forecast, by Application 2019 & 2032
- Table 38: Colombia Autonomous Agents Market Revenue (Million) Forecast, by Application 2019 & 2032
- Table 39: Ecuador Autonomous Agents Market Revenue (Million) Forecast, by Application 2019 & 2032
- Table 40: Venezuela Autonomous Agents Market Revenue (Million) Forecast, by Application 2019 & 2032
- Table 41: Rest of South America Autonomous Agents Market Revenue (Million) Forecast, by Application 2019 & 2032
- Table 42: Global Autonomous Agents Market Revenue Million Forecast, by Country 2019 & 2032
- Table 43: United States Autonomous Agents Market Revenue (Million) Forecast, by Application 2019 & 2032
- Table 44: Canada Autonomous Agents Market Revenue (Million) Forecast, by Application 2019 & 2032
- Table 45: Mexico Autonomous Agents Market Revenue (Million) Forecast, by Application 2019 & 2032
- Table 46: Global Autonomous Agents Market Revenue Million Forecast, by Country 2019 & 2032
- Table 47: United Arab Emirates Autonomous Agents Market Revenue (Million) Forecast, by Application 2019 & 2032
- Table 48: Saudi Arabia Autonomous Agents Market Revenue (Million) Forecast, by Application 2019 & 2032
- Table 49: South Africa Autonomous Agents Market Revenue (Million) Forecast, by Application 2019 & 2032
- Table 50: Rest of Middle East and Africa Autonomous Agents Market Revenue (Million) Forecast, by Application 2019 & 2032
- Table 51: Global Autonomous Agents Market Revenue Million Forecast, by Deployment Type 2019 & 2032
- Table 52: Global Autonomous Agents Market Revenue Million Forecast, by Organization Size 2019 & 2032
- Table 53: Global Autonomous Agents Market Revenue Million Forecast, by Industry Vertical 2019 & 2032
- Table 54: Global Autonomous Agents Market Revenue Million Forecast, by Country 2019 & 2032
- Table 55: Global Autonomous Agents Market Revenue Million Forecast, by Deployment Type 2019 & 2032
- Table 56: Global Autonomous Agents Market Revenue Million Forecast, by Organization Size 2019 & 2032
- Table 57: Global Autonomous Agents Market Revenue Million Forecast, by Industry Vertical 2019 & 2032
- Table 58: Global Autonomous Agents Market Revenue Million Forecast, by Country 2019 & 2032
- Table 59: Global Autonomous Agents Market Revenue Million Forecast, by Deployment Type 2019 & 2032
- Table 60: Global Autonomous Agents Market Revenue Million Forecast, by Organization Size 2019 & 2032
- Table 61: Global Autonomous Agents Market Revenue Million Forecast, by Industry Vertical 2019 & 2032
- Table 62: Global Autonomous Agents Market Revenue Million Forecast, by Country 2019 & 2032
- Table 63: Global Autonomous Agents Market Revenue Million Forecast, by Deployment Type 2019 & 2032
- Table 64: Global Autonomous Agents Market Revenue Million Forecast, by Organization Size 2019 & 2032
- Table 65: Global Autonomous Agents Market Revenue Million Forecast, by Industry Vertical 2019 & 2032
- Table 66: Global Autonomous Agents Market Revenue Million Forecast, by Country 2019 & 2032
- Table 67: Global Autonomous Agents Market Revenue Million Forecast, by Deployment Type 2019 & 2032
- Table 68: Global Autonomous Agents Market Revenue Million Forecast, by Organization Size 2019 & 2032
- Table 69: Global Autonomous Agents Market Revenue Million Forecast, by Industry Vertical 2019 & 2032
- Table 70: Global Autonomous Agents Market Revenue Million Forecast, by Country 2019 & 2032
Frequently Asked Questions
1. What is the projected Compound Annual Growth Rate (CAGR) of the Autonomous Agents Market?
The projected CAGR is approximately 57.00%.
2. Which companies are prominent players in the Autonomous Agents Market?
Key companies in the market include SAS Institute Inc, Infosys Limited, Fair Isaac Corporation, Aptiv PLC*List Not Exhaustive, IBM Corporation, Google LLC, Nuance Communications, Salesforce com Inc, Microsoft Corporation, Affectiva Inc, Amazon Web Services Inc, Fetch ai, Oracle Corporation, Intel Corporation, SAP SE.
3. What are the main segments of the Autonomous Agents Market?
The market segments include Deployment Type, Organization Size, Industry Vertical.
4. Can you provide details about the market size?
The market size is estimated to be USD XX Million as of 2022.
5. What are some drivers contributing to market growth?
; Rising Number of AI Applications; Growing Presence of Parallel Computational Resources.
6. What are the notable trends driving market growth?
Transportation and Mobility Segments to Dominate the Market.
7. Are there any restraints impacting market growth?
Maintaining the Privacy and Integrity of Patient Data.
8. Can you provide examples of recent developments in the market?
N/A
9. What pricing options are available for accessing the report?
Pricing options include single-user, multi-user, and enterprise licenses priced at USD 4750, USD 5250, and USD 8750 respectively.
10. Is the market size provided in terms of value or volume?
The market size is provided in terms of value, measured in Million.
11. Are there any specific market keywords associated with the report?
Yes, the market keyword associated with the report is "Autonomous Agents Market," which aids in identifying and referencing the specific market segment covered.
12. How do I determine which pricing option suits my needs best?
The pricing options vary based on user requirements and access needs. Individual users may opt for single-user licenses, while businesses requiring broader access may choose multi-user or enterprise licenses for cost-effective access to the report.
13. Are there any additional resources or data provided in the Autonomous Agents Market report?
While the report offers comprehensive insights, it's advisable to review the specific contents or supplementary materials provided to ascertain if additional resources or data are available.
14. How can I stay updated on further developments or reports in the Autonomous Agents Market?
To stay informed about further developments, trends, and reports in the Autonomous Agents Market, consider subscribing to industry newsletters, following relevant companies and organizations, or regularly checking reputable industry news sources and publications.
Methodology
Step 1 - Identification of Relevant Samples Size from Population Database


Step 2 - Approaches for Defining Global Market Size (Value, Volume* & Price*)

Note*: In applicable scenarios
Step 3 - Data Sources
Primary Research
- Web Analytics
- Survey Reports
- Research Institute
- Latest Research Reports
- Opinion Leaders
Secondary Research
- Annual Reports
- White Paper
- Latest Press Release
- Industry Association
- Paid Database
- Investor Presentations

Step 4 - Data Triangulation
Involves using different sources of information in order to increase the validity of a study
These sources are likely to be stakeholders in a program - participants, other researchers, program staff, other community members, and so on.
Then we put all data in single framework & apply various statistical tools to find out the dynamic on the market.
During the analysis stage, feedback from the stakeholder groups would be compared to determine areas of agreement as well as areas of divergence
