

Key Insights
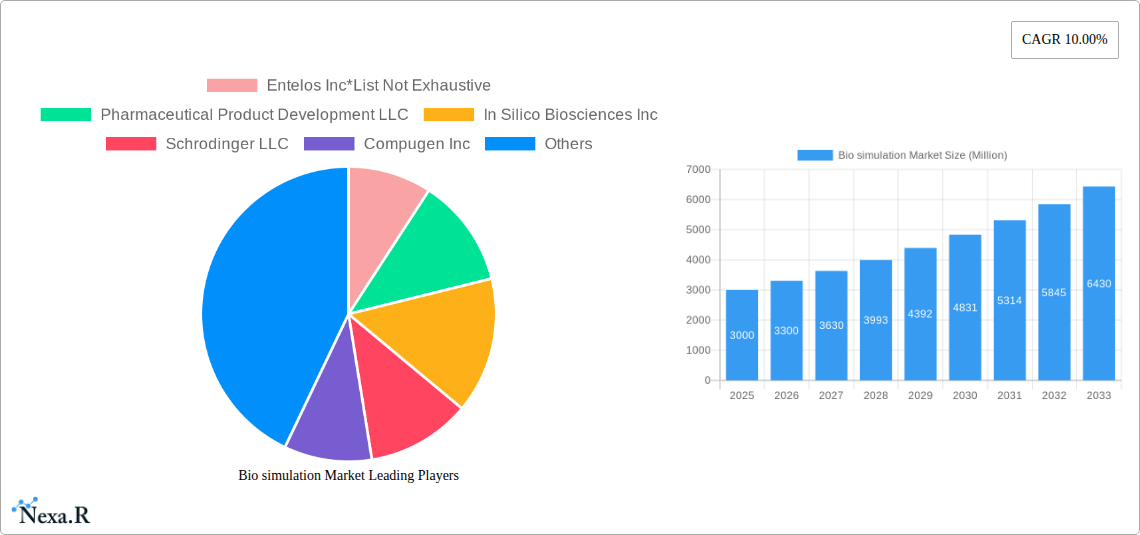
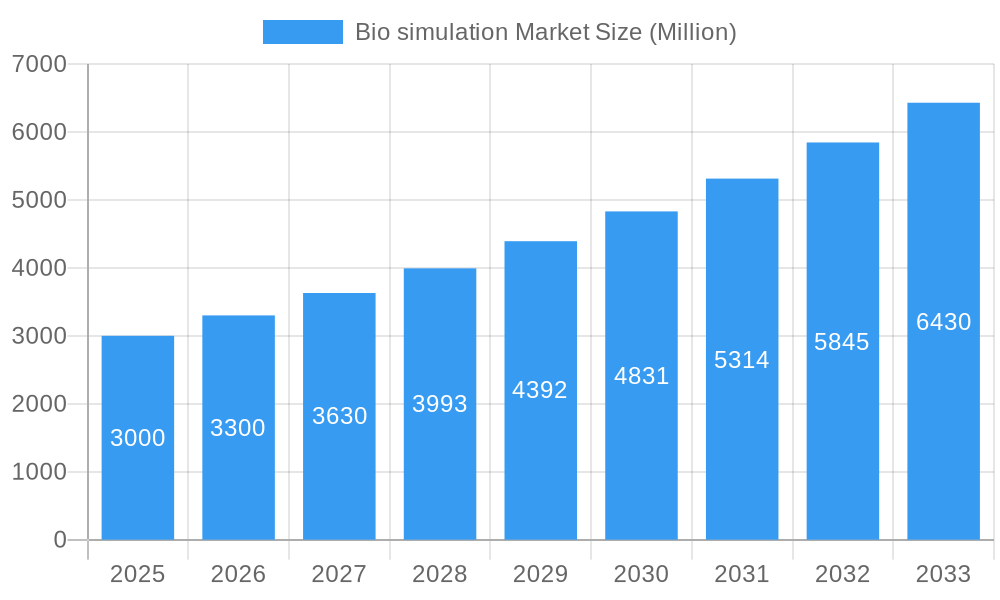
The global Bio simulation Market is projected to experience robust growth, reaching an estimated market size of approximately USD 3,000 million by 2025 and expanding significantly by 2033. This expansion is driven by an impressive Compound Annual Growth Rate (CAGR) of 10.00%, indicating a dynamic and rapidly evolving landscape. The increasing demand for efficient drug discovery and development processes, coupled with the rising complexity of biological systems, are primary catalysts for this upward trajectory. Bio simulation offers a powerful, cost-effective, and time-saving alternative to traditional experimental methods, enabling researchers to model, predict, and optimize biological processes. The market is segmented into Software and Services, with applications spanning Preclinical and Clinical Drug Development, Drug Discovery, and other crucial areas. Pharmaceutical and Biotechnology Companies, along with Contract Research Organizations (CROs), are the dominant end-users, leveraging these advanced technologies to accelerate their research pipelines and bring life-saving therapies to market faster.
Bio simulation Market Market Size (In Billion)
Further analysis reveals that advancements in computational power, sophisticated algorithms, and the integration of artificial intelligence and machine learning are propelling the bio simulation market forward. These technologies are enhancing the accuracy and predictive capabilities of simulation models, leading to a reduction in costly and time-consuming wet-lab experiments. Key trends include the growing adoption of physiologically based pharmacokinetic (PBPK) modeling, systems biology approaches, and the increasing use of simulations in personalized medicine. While the market presents substantial opportunities, certain restraints, such as the high initial investment for advanced simulation software and the need for skilled personnel, may temper growth in specific regions or for smaller organizations. However, the undeniable benefits of reduced development timelines, lower failure rates in clinical trials, and improved understanding of disease mechanisms are expected to outweigh these challenges, ensuring sustained market expansion across the forecast period.
Bio simulation Market Company Market Share
Bio simulation Market: Revolutionizing Drug Development and Precision Medicine
This comprehensive report offers an in-depth analysis of the global Bio simulation Market, a rapidly evolving sector crucial for accelerating drug discovery, optimizing preclinical and clinical development, and advancing personalized medicine. The report provides a detailed market outlook, growth trends, regional dominance, product landscape, key drivers, emerging opportunities, and competitive intelligence, catering to pharmaceutical and biotechnology companies, contract research organizations (CROs), and other stakeholders. The study period spans from 2019 to 2033, with a base and estimated year of 2025, and a forecast period from 2025 to 2033, including historical data from 2019 to 2024.
Bio simulation Market Dynamics & Structure
The Bio simulation Market is characterized by a moderately consolidated structure, driven by continuous technological innovation and increasing R&D investments within the pharmaceutical and biotechnology industries. Key drivers of innovation include advancements in computational power, sophisticated algorithms, and the growing demand for reduced R&D timelines and costs associated with drug development. Regulatory frameworks, while stringent, are also evolving to accommodate and encourage the use of advanced simulation tools. Competitive product substitutes are emerging from alternative research methodologies, but the inherent speed and cost-effectiveness of bio simulation present a significant advantage. End-user demographics are dominated by pharmaceutical and biotechnology companies, with a growing presence of contract research organizations (CROs) leveraging these technologies for outsourced research. Mergers and acquisitions (M&A) are an ongoing trend, with larger players acquiring specialized bio simulation companies to expand their service offerings and market reach. For instance, the acquisition of smaller, niche bio simulation firms by established software providers contributes to market consolidation. Barriers to adoption include the initial investment in software and hardware, the need for specialized expertise, and the validation of simulation results against experimental data.
- Market Concentration: Moderately consolidated, with key players investing heavily in R&D.
- Technological Innovation Drivers: Increased computational power, AI integration, machine learning, and advanced algorithms.
- Regulatory Frameworks: Evolving to support simulation-based drug development, requiring robust validation processes.
- Competitive Product Substitutes: Traditional experimental methods, though increasingly complemented by simulation.
- End-User Demographics: Pharmaceutical and Biotechnology Companies (estimated xx% market share), CROs (estimated xx% market share), Academia, and Government Research Institutions.
- M&A Trends: Ongoing consolidation through acquisitions of specialized bio simulation providers by larger companies.
Bio simulation Market Growth Trends & Insights
The global Bio simulation Market is poised for substantial growth, driven by its indispensable role in modernizing drug discovery and development processes. The market size is projected to witness significant expansion, fueled by an increasing adoption rate of simulation technologies across all phases of the drug lifecycle. Technological disruptions, such as the integration of artificial intelligence (AI) and machine learning (ML) into simulation platforms, are further accelerating innovation and enhancing predictive capabilities. These advancements are enabling more accurate predictions of drug efficacy, toxicity, and pharmacokinetics, thereby reducing the need for extensive and costly wet-lab experiments. Consumer behavior shifts within the pharmaceutical and biotechnology sectors are also contributing to this growth; companies are increasingly prioritizing cost-efficiency, faster time-to-market, and the development of highly targeted therapies, all of which bio simulation directly supports. The CAGR for the Bio simulation Market is estimated to be xx% over the forecast period, indicating robust expansion. Market penetration is deepening as more research institutions and smaller biotech firms recognize the strategic advantages of adopting these advanced computational tools. The ability of bio simulation to model complex biological systems and predict the behavior of novel drug candidates before significant investment is a key factor driving this increasing reliance. Furthermore, the push for personalized medicine, which requires an in-depth understanding of individual patient responses to therapies, is a significant long-term growth driver. The complexity of biologics and the challenges in their development also necessitate sophisticated simulation approaches.
Dominant Regions, Countries, or Segments in Bio simulation Market
The Product: Software segment is currently the dominant force within the Bio simulation Market, driven by continuous innovation and its foundational role in enabling various simulation applications. Within this segment, Application: Preclinical and Clinical Drug Development holds the largest market share, as the imperative to accelerate and de-risk these crucial stages of drug research propels demand for sophisticated software solutions. Pharmaceutical and Biotechnology Companies are the leading end-users, representing the primary consumer base for bio simulation software and services.
North America, particularly the United States, has emerged as the leading region in the Bio simulation Market. This dominance is attributed to several factors:
- Robust Pharmaceutical and Biotechnology Ecosystem: The region boasts a high concentration of leading pharmaceutical and biotechnology companies, alongside a vibrant startup culture actively engaged in cutting-edge drug discovery.
- Significant R&D Investments: substantial government and private sector funding allocated to life sciences research and development fuels the adoption of advanced technologies like bio simulation.
- Technological Advovacy and Infrastructure: A strong emphasis on technological innovation and the availability of advanced computational infrastructure, including high-performance computing (HPC) clusters, facilitate the complex calculations required for bio simulation.
- Favorable Regulatory Environment: While stringent, the regulatory landscape in North America encourages the adoption of validated computational tools that can demonstrate efficiency and safety improvements in drug development.
- Presence of Key Market Players: Many of the prominent bio simulation software and service providers are headquartered in or have a significant presence in North America, further bolstering regional market growth.
The market share of the Software segment is estimated at xx% of the total market, with Preclinical and Clinical Drug Development applications accounting for an estimated xx% of the bio simulation software market. Pharmaceutical and Biotechnology Companies are projected to command over xx% of the end-user market share. The growth potential in this region is further amplified by strategic partnerships between academic institutions and industry players, fostering a collaborative environment for innovation.
Bio simulation Market Product Landscape
The Bio simulation Market's product landscape is characterized by a dynamic array of software solutions and specialized services designed to address the intricate challenges of drug discovery and development. Software offerings encompass platforms for molecular modeling, pharmacokinetics/pharmacodynamics (PK/PD) analysis, systems biology modeling, and in silico drug design. These tools are increasingly incorporating AI and ML algorithms to enhance predictive accuracy and speed up analysis. Services, on the other hand, provide expert consultation, custom model development, and data analysis, empowering organizations to leverage bio simulation without extensive in-house expertise. Unique selling propositions often lie in the software's ability to integrate diverse biological data, its user-friendly interface, and its validated predictive capabilities. Technological advancements are focusing on multi-scale modeling, bridging the gap between molecular-level interactions and whole-body responses, and the development of cloud-based simulation platforms for enhanced accessibility and collaboration.
Key Drivers, Barriers & Challenges in Bio simulation Market
Key Drivers:
The Bio simulation Market is propelled by several key drivers. The relentless pursuit of reduced drug development timelines and costs is paramount, with simulation offering a faster, more cost-effective alternative to traditional experimental methods. The increasing complexity of novel drug modalities, such as biologics and gene therapies, necessitates sophisticated in silico approaches for their development and understanding. Furthermore, the growing emphasis on personalized medicine, requiring tailored treatment strategies, is driving the demand for simulation tools that can predict individual patient responses. Advancements in computational power and algorithms, including AI and ML, are continuously enhancing the accuracy and predictive capabilities of bio simulation platforms.
Barriers & Challenges:
Despite its promise, the Bio simulation Market faces several challenges. The high initial investment in specialized software, hardware, and skilled personnel can be a significant barrier, particularly for smaller organizations. The need for robust validation of simulation results against experimental data remains a critical requirement, adding complexity and time to the process. Integrating diverse and often disparate biological data sets into unified simulation models is another technical hurdle. Regulatory acceptance, while growing, still requires continuous efforts to establish standardized validation frameworks. Competitive pressures from established experimental research methodologies and the inherent complexity of biological systems also present ongoing challenges. Supply chain issues for specialized hardware and the availability of highly trained bioinformaticians and computational biologists can also impact market growth.
Emerging Opportunities in Bio simulation Market
Emerging opportunities in the Bio simulation Market are abundant and poised to reshape the future of pharmaceutical R&D. The untapped potential in areas like rare disease research, where experimental models are scarce and costly, presents a significant avenue for growth. The application of bio simulation in the development of vaccines and infectious disease therapeutics is gaining traction, especially in response to global health crises. Furthermore, the integration of real-world evidence (RWE) into simulation models offers a powerful opportunity to enhance the predictive accuracy and clinical relevance of in silico predictions. The expansion of AI-driven drug discovery platforms, which heavily rely on bio simulation, is creating new markets for advanced computational solutions. Evolving consumer preferences for targeted and effective therapies are also driving innovation in the simulation of complex biological pathways and drug-target interactions. The growing interest in microbiome research and its impact on drug metabolism and efficacy also presents a fertile ground for bio simulation applications.
Growth Accelerators in the Bio simulation Market Industry
Several catalysts are accelerating the growth of the Bio simulation Market. Technological breakthroughs, such as the development of more sophisticated AI algorithms for predicting protein-ligand interactions and drug toxicity, are significantly enhancing the capabilities of simulation platforms. Strategic partnerships between software providers, pharmaceutical companies, and academic institutions are fostering collaboration, accelerating innovation, and facilitating the validation of simulation models. Market expansion strategies, including the development of user-friendly cloud-based platforms and the provision of comprehensive training and support services, are making bio simulation more accessible to a wider range of users. The increasing adoption of these technologies by contract research organizations (CROs) to offer specialized bio simulation services also acts as a significant growth accelerator, expanding the reach of these solutions. The ongoing push for precision medicine and the need to understand complex disease mechanisms are also powerful underlying forces driving sustained growth.
Key Players Shaping the Bio simulation Market Market
- Entelos Inc
- Pharmaceutical Product Development LLC
- In Silico Biosciences Inc
- Schrodinger LLC
- Compugen Inc
- Biovia
- Leadscope Inc
- Certara L P
- Simulations Plus Inc
- Genedata
Notable Milestones in Bio simulation Market Sector
- June 2022: Certara announced the launch of a new version of its Immunogenicity (IG), Immuno-Oncology (IO), and Vaccine Simulators, enhancing its capabilities to predict drug performance and address critical questions in novel biologic therapy development.
- April 2021: Applied BioMath launched its first software solution, Applied BioMath Assess, designed to assist project leaders and protein engineers in evaluating challenges encountered during the development of biotherapeutics.
In-Depth Bio simulation Market Market Outlook
The future outlook for the Bio simulation Market is exceptionally promising, driven by sustained growth accelerators and burgeoning opportunities. The increasing integration of AI and machine learning will further refine predictive accuracy, leading to more efficient and successful drug development pipelines. Strategic partnerships will continue to be pivotal in fostering innovation and expanding market reach, particularly in areas like novel biologics and personalized medicine. The expansion of cloud-based platforms will democratize access to powerful simulation tools, empowering a broader spectrum of research institutions and companies. The Bio simulation Market is set to play an increasingly critical role in addressing unmet medical needs, accelerating therapeutic breakthroughs, and ushering in an era of more precise and effective healthcare solutions. The growing imperative for cost containment and faster market entry within the pharmaceutical industry will further solidify bio simulation's position as an indispensable tool.
Bio simulation Market Segmentation
-
1. Product
- 1.1. Software
- 1.2. Services
-
2. Application
- 2.1. Preclinical and Clinical Drug Development
- 2.2. Drug Discovery
- 2.3. Others
-
3. End User
- 3.1. Pharmaceutical and Biotechnology Companies
- 3.2. Contract Research Organizations
- 3.3. Others
Bio simulation Market Segmentation By Geography
-
1. North America
- 1.1. United States
- 1.2. Canada
- 1.3. Mexico
-
2. Europe
- 2.1. Germany
- 2.2. United Kingdom
- 2.3. France
- 2.4. Italy
- 2.5. Spain
- 2.6. Rest of Europe
-
3. Asia Pacific
- 3.1. China
- 3.2. Japan
- 3.3. India
- 3.4. Australia
- 3.5. South Korea
- 3.6. Rest of Asia Pacific
-
4. Middle East and Africa
- 4.1. GCC
- 4.2. South Africa
- 4.3. Rest of Middle East and Africa
-
5. South America
- 5.1. Brazil
- 5.2. Argentina
- 5.3. Rest of South America
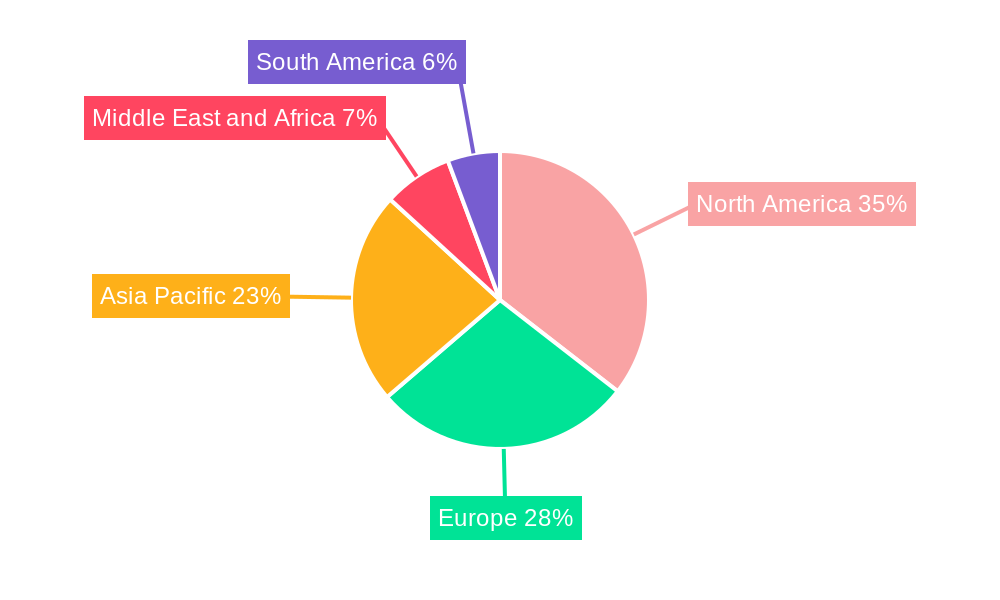
Bio simulation Market Regional Market Share
Geographic Coverage of Bio simulation Market
Bio simulation Market REPORT HIGHLIGHTS
| Aspects | Details |
|---|---|
| Study Period | 2020-2034 |
| Base Year | 2025 |
| Estimated Year | 2026 |
| Forecast Period | 2026-2034 |
| Historical Period | 2020-2025 |
| Growth Rate | CAGR of 16.7% from 2020-2034 |
| Segmentation |
|
Table of Contents
- 1. Introduction
- 1.1. Research Scope
- 1.2. Market Segmentation
- 1.3. Research Objective
- 1.4. Definitions and Assumptions
- 2. Executive Summary
- 2.1. Market Snapshot
- 3. Market Dynamics
- 3.1. Market Drivers
- 3.2. Market Restrains
- 3.3. Market Trends
- 3.4. Market Opportunities
- 4. Market Factor Analysis
- 4.1. Porters Five Forces
- 4.1.1. Bargaining Power of Suppliers
- 4.1.2. Bargaining Power of Buyers
- 4.1.3. Threat of New Entrants
- 4.1.4. Threat of Substitutes
- 4.1.5. Competitive Rivalry
- 4.2. PESTEL analysis
- 4.3. BCG Analysis
- 4.3.1. Stars (High Growth, High Market Share)
- 4.3.2. Cash Cows (Low Growth, High Market Share)
- 4.3.3. Question Mark (High Growth, Low Market Share)
- 4.3.4. Dogs (Low Growth, Low Market Share)
- 4.4. Ansoff Matrix Analysis
- 4.5. Supply Chain Analysis
- 4.6. Regulatory Landscape
- 4.7. Current Market Potential and Opportunity Assessment (TAM–SAM–SOM Framework)
- 4.8. NRP Analyst Note
- 4.1. Porters Five Forces
- 5. Market Analysis, Insights and Forecast 2021-2033
- 5.1. Market Analysis, Insights and Forecast - by Product
- 5.1.1. Software
- 5.1.2. Services
- 5.2. Market Analysis, Insights and Forecast - by Application
- 5.2.1. Preclinical and Clinical Drug Development
- 5.2.2. Drug Discovery
- 5.2.3. Others
- 5.3. Market Analysis, Insights and Forecast - by End User
- 5.3.1. Pharmaceutical and Biotechnology Companies
- 5.3.2. Contract Research Organizations
- 5.3.3. Others
- 5.4. Market Analysis, Insights and Forecast - by Region
- 5.4.1. North America
- 5.4.2. Europe
- 5.4.3. Asia Pacific
- 5.4.4. Middle East and Africa
- 5.4.5. South America
- 5.1. Market Analysis, Insights and Forecast - by Product
- 6. Global Bio simulation Market Analysis, Insights and Forecast, 2021-2033
- 6.1. Market Analysis, Insights and Forecast - by Product
- 6.1.1. Software
- 6.1.2. Services
- 6.2. Market Analysis, Insights and Forecast - by Application
- 6.2.1. Preclinical and Clinical Drug Development
- 6.2.2. Drug Discovery
- 6.2.3. Others
- 6.3. Market Analysis, Insights and Forecast - by End User
- 6.3.1. Pharmaceutical and Biotechnology Companies
- 6.3.2. Contract Research Organizations
- 6.3.3. Others
- 6.1. Market Analysis, Insights and Forecast - by Product
- 7. North America Bio simulation Market Analysis, Insights and Forecast, 2020-2032
- 7.1. Market Analysis, Insights and Forecast - by Product
- 7.1.1. Software
- 7.1.2. Services
- 7.2. Market Analysis, Insights and Forecast - by Application
- 7.2.1. Preclinical and Clinical Drug Development
- 7.2.2. Drug Discovery
- 7.2.3. Others
- 7.3. Market Analysis, Insights and Forecast - by End User
- 7.3.1. Pharmaceutical and Biotechnology Companies
- 7.3.2. Contract Research Organizations
- 7.3.3. Others
- 7.1. Market Analysis, Insights and Forecast - by Product
- 8. Europe Bio simulation Market Analysis, Insights and Forecast, 2020-2032
- 8.1. Market Analysis, Insights and Forecast - by Product
- 8.1.1. Software
- 8.1.2. Services
- 8.2. Market Analysis, Insights and Forecast - by Application
- 8.2.1. Preclinical and Clinical Drug Development
- 8.2.2. Drug Discovery
- 8.2.3. Others
- 8.3. Market Analysis, Insights and Forecast - by End User
- 8.3.1. Pharmaceutical and Biotechnology Companies
- 8.3.2. Contract Research Organizations
- 8.3.3. Others
- 8.1. Market Analysis, Insights and Forecast - by Product
- 9. Asia Pacific Bio simulation Market Analysis, Insights and Forecast, 2020-2032
- 9.1. Market Analysis, Insights and Forecast - by Product
- 9.1.1. Software
- 9.1.2. Services
- 9.2. Market Analysis, Insights and Forecast - by Application
- 9.2.1. Preclinical and Clinical Drug Development
- 9.2.2. Drug Discovery
- 9.2.3. Others
- 9.3. Market Analysis, Insights and Forecast - by End User
- 9.3.1. Pharmaceutical and Biotechnology Companies
- 9.3.2. Contract Research Organizations
- 9.3.3. Others
- 9.1. Market Analysis, Insights and Forecast - by Product
- 10. Middle East and Africa Bio simulation Market Analysis, Insights and Forecast, 2020-2032
- 10.1. Market Analysis, Insights and Forecast - by Product
- 10.1.1. Software
- 10.1.2. Services
- 10.2. Market Analysis, Insights and Forecast - by Application
- 10.2.1. Preclinical and Clinical Drug Development
- 10.2.2. Drug Discovery
- 10.2.3. Others
- 10.3. Market Analysis, Insights and Forecast - by End User
- 10.3.1. Pharmaceutical and Biotechnology Companies
- 10.3.2. Contract Research Organizations
- 10.3.3. Others
- 10.1. Market Analysis, Insights and Forecast - by Product
- 11. South America Bio simulation Market Analysis, Insights and Forecast, 2020-2032
- 11.1. Market Analysis, Insights and Forecast - by Product
- 11.1.1. Software
- 11.1.2. Services
- 11.2. Market Analysis, Insights and Forecast - by Application
- 11.2.1. Preclinical and Clinical Drug Development
- 11.2.2. Drug Discovery
- 11.2.3. Others
- 11.3. Market Analysis, Insights and Forecast - by End User
- 11.3.1. Pharmaceutical and Biotechnology Companies
- 11.3.2. Contract Research Organizations
- 11.3.3. Others
- 11.1. Market Analysis, Insights and Forecast - by Product
- 12. Competitive Analysis
- 12.1. Company Profiles
- 12.1.1 Entelos Inc*List Not Exhaustive
- 12.1.1.1. Company Overview
- 12.1.1.2. Products
- 12.1.1.3. Company Financials
- 12.1.1.4. SWOT Analysis
- 12.1.2 Pharmaceutical Product Development LLC
- 12.1.2.1. Company Overview
- 12.1.2.2. Products
- 12.1.2.3. Company Financials
- 12.1.2.4. SWOT Analysis
- 12.1.3 In Silico Biosciences Inc
- 12.1.3.1. Company Overview
- 12.1.3.2. Products
- 12.1.3.3. Company Financials
- 12.1.3.4. SWOT Analysis
- 12.1.4 Schrodinger LLC
- 12.1.4.1. Company Overview
- 12.1.4.2. Products
- 12.1.4.3. Company Financials
- 12.1.4.4. SWOT Analysis
- 12.1.5 Compugen Inc
- 12.1.5.1. Company Overview
- 12.1.5.2. Products
- 12.1.5.3. Company Financials
- 12.1.5.4. SWOT Analysis
- 12.1.6 Biovia
- 12.1.6.1. Company Overview
- 12.1.6.2. Products
- 12.1.6.3. Company Financials
- 12.1.6.4. SWOT Analysis
- 12.1.7 Leadscope Inc
- 12.1.7.1. Company Overview
- 12.1.7.2. Products
- 12.1.7.3. Company Financials
- 12.1.7.4. SWOT Analysis
- 12.1.8 Certara L P
- 12.1.8.1. Company Overview
- 12.1.8.2. Products
- 12.1.8.3. Company Financials
- 12.1.8.4. SWOT Analysis
- 12.1.9 Simulations Plus Inc
- 12.1.9.1. Company Overview
- 12.1.9.2. Products
- 12.1.9.3. Company Financials
- 12.1.9.4. SWOT Analysis
- 12.1.10 Genedata
- 12.1.10.1. Company Overview
- 12.1.10.2. Products
- 12.1.10.3. Company Financials
- 12.1.10.4. SWOT Analysis
- 12.1.1 Entelos Inc*List Not Exhaustive
- 12.2. Market Entropy
- 12.2.1 Company's Key Areas Served
- 12.2.2 Recent Developments
- 12.3. Company Market Share Analysis 2025
- 12.3.1 Top 5 Companies Market Share Analysis
- 12.3.2 Top 3 Companies Market Share Analysis
- 12.4. List of Potential Customers
- 13. Research Methodology
List of Figures
- Figure 1: Global Bio simulation Market Revenue Breakdown (billion, %) by Region 2025 & 2033
- Figure 2: North America Bio simulation Market Revenue (billion), by Product 2025 & 2033
- Figure 3: North America Bio simulation Market Revenue Share (%), by Product 2025 & 2033
- Figure 4: North America Bio simulation Market Revenue (billion), by Application 2025 & 2033
- Figure 5: North America Bio simulation Market Revenue Share (%), by Application 2025 & 2033
- Figure 6: North America Bio simulation Market Revenue (billion), by End User 2025 & 2033
- Figure 7: North America Bio simulation Market Revenue Share (%), by End User 2025 & 2033
- Figure 8: North America Bio simulation Market Revenue (billion), by Country 2025 & 2033
- Figure 9: North America Bio simulation Market Revenue Share (%), by Country 2025 & 2033
- Figure 10: Europe Bio simulation Market Revenue (billion), by Product 2025 & 2033
- Figure 11: Europe Bio simulation Market Revenue Share (%), by Product 2025 & 2033
- Figure 12: Europe Bio simulation Market Revenue (billion), by Application 2025 & 2033
- Figure 13: Europe Bio simulation Market Revenue Share (%), by Application 2025 & 2033
- Figure 14: Europe Bio simulation Market Revenue (billion), by End User 2025 & 2033
- Figure 15: Europe Bio simulation Market Revenue Share (%), by End User 2025 & 2033
- Figure 16: Europe Bio simulation Market Revenue (billion), by Country 2025 & 2033
- Figure 17: Europe Bio simulation Market Revenue Share (%), by Country 2025 & 2033
- Figure 18: Asia Pacific Bio simulation Market Revenue (billion), by Product 2025 & 2033
- Figure 19: Asia Pacific Bio simulation Market Revenue Share (%), by Product 2025 & 2033
- Figure 20: Asia Pacific Bio simulation Market Revenue (billion), by Application 2025 & 2033
- Figure 21: Asia Pacific Bio simulation Market Revenue Share (%), by Application 2025 & 2033
- Figure 22: Asia Pacific Bio simulation Market Revenue (billion), by End User 2025 & 2033
- Figure 23: Asia Pacific Bio simulation Market Revenue Share (%), by End User 2025 & 2033
- Figure 24: Asia Pacific Bio simulation Market Revenue (billion), by Country 2025 & 2033
- Figure 25: Asia Pacific Bio simulation Market Revenue Share (%), by Country 2025 & 2033
- Figure 26: Middle East and Africa Bio simulation Market Revenue (billion), by Product 2025 & 2033
- Figure 27: Middle East and Africa Bio simulation Market Revenue Share (%), by Product 2025 & 2033
- Figure 28: Middle East and Africa Bio simulation Market Revenue (billion), by Application 2025 & 2033
- Figure 29: Middle East and Africa Bio simulation Market Revenue Share (%), by Application 2025 & 2033
- Figure 30: Middle East and Africa Bio simulation Market Revenue (billion), by End User 2025 & 2033
- Figure 31: Middle East and Africa Bio simulation Market Revenue Share (%), by End User 2025 & 2033
- Figure 32: Middle East and Africa Bio simulation Market Revenue (billion), by Country 2025 & 2033
- Figure 33: Middle East and Africa Bio simulation Market Revenue Share (%), by Country 2025 & 2033
- Figure 34: South America Bio simulation Market Revenue (billion), by Product 2025 & 2033
- Figure 35: South America Bio simulation Market Revenue Share (%), by Product 2025 & 2033
- Figure 36: South America Bio simulation Market Revenue (billion), by Application 2025 & 2033
- Figure 37: South America Bio simulation Market Revenue Share (%), by Application 2025 & 2033
- Figure 38: South America Bio simulation Market Revenue (billion), by End User 2025 & 2033
- Figure 39: South America Bio simulation Market Revenue Share (%), by End User 2025 & 2033
- Figure 40: South America Bio simulation Market Revenue (billion), by Country 2025 & 2033
- Figure 41: South America Bio simulation Market Revenue Share (%), by Country 2025 & 2033
List of Tables
- Table 1: Global Bio simulation Market Revenue billion Forecast, by Product 2020 & 2033
- Table 2: Global Bio simulation Market Revenue billion Forecast, by Application 2020 & 2033
- Table 3: Global Bio simulation Market Revenue billion Forecast, by End User 2020 & 2033
- Table 4: Global Bio simulation Market Revenue billion Forecast, by Region 2020 & 2033
- Table 5: Global Bio simulation Market Revenue billion Forecast, by Product 2020 & 2033
- Table 6: Global Bio simulation Market Revenue billion Forecast, by Application 2020 & 2033
- Table 7: Global Bio simulation Market Revenue billion Forecast, by End User 2020 & 2033
- Table 8: Global Bio simulation Market Revenue billion Forecast, by Country 2020 & 2033
- Table 9: United States Bio simulation Market Revenue (billion) Forecast, by Application 2020 & 2033
- Table 10: Canada Bio simulation Market Revenue (billion) Forecast, by Application 2020 & 2033
- Table 11: Mexico Bio simulation Market Revenue (billion) Forecast, by Application 2020 & 2033
- Table 12: Global Bio simulation Market Revenue billion Forecast, by Product 2020 & 2033
- Table 13: Global Bio simulation Market Revenue billion Forecast, by Application 2020 & 2033
- Table 14: Global Bio simulation Market Revenue billion Forecast, by End User 2020 & 2033
- Table 15: Global Bio simulation Market Revenue billion Forecast, by Country 2020 & 2033
- Table 16: Germany Bio simulation Market Revenue (billion) Forecast, by Application 2020 & 2033
- Table 17: United Kingdom Bio simulation Market Revenue (billion) Forecast, by Application 2020 & 2033
- Table 18: France Bio simulation Market Revenue (billion) Forecast, by Application 2020 & 2033
- Table 19: Italy Bio simulation Market Revenue (billion) Forecast, by Application 2020 & 2033
- Table 20: Spain Bio simulation Market Revenue (billion) Forecast, by Application 2020 & 2033
- Table 21: Rest of Europe Bio simulation Market Revenue (billion) Forecast, by Application 2020 & 2033
- Table 22: Global Bio simulation Market Revenue billion Forecast, by Product 2020 & 2033
- Table 23: Global Bio simulation Market Revenue billion Forecast, by Application 2020 & 2033
- Table 24: Global Bio simulation Market Revenue billion Forecast, by End User 2020 & 2033
- Table 25: Global Bio simulation Market Revenue billion Forecast, by Country 2020 & 2033
- Table 26: China Bio simulation Market Revenue (billion) Forecast, by Application 2020 & 2033
- Table 27: Japan Bio simulation Market Revenue (billion) Forecast, by Application 2020 & 2033
- Table 28: India Bio simulation Market Revenue (billion) Forecast, by Application 2020 & 2033
- Table 29: Australia Bio simulation Market Revenue (billion) Forecast, by Application 2020 & 2033
- Table 30: South Korea Bio simulation Market Revenue (billion) Forecast, by Application 2020 & 2033
- Table 31: Rest of Asia Pacific Bio simulation Market Revenue (billion) Forecast, by Application 2020 & 2033
- Table 32: Global Bio simulation Market Revenue billion Forecast, by Product 2020 & 2033
- Table 33: Global Bio simulation Market Revenue billion Forecast, by Application 2020 & 2033
- Table 34: Global Bio simulation Market Revenue billion Forecast, by End User 2020 & 2033
- Table 35: Global Bio simulation Market Revenue billion Forecast, by Country 2020 & 2033
- Table 36: GCC Bio simulation Market Revenue (billion) Forecast, by Application 2020 & 2033
- Table 37: South Africa Bio simulation Market Revenue (billion) Forecast, by Application 2020 & 2033
- Table 38: Rest of Middle East and Africa Bio simulation Market Revenue (billion) Forecast, by Application 2020 & 2033
- Table 39: Global Bio simulation Market Revenue billion Forecast, by Product 2020 & 2033
- Table 40: Global Bio simulation Market Revenue billion Forecast, by Application 2020 & 2033
- Table 41: Global Bio simulation Market Revenue billion Forecast, by End User 2020 & 2033
- Table 42: Global Bio simulation Market Revenue billion Forecast, by Country 2020 & 2033
- Table 43: Brazil Bio simulation Market Revenue (billion) Forecast, by Application 2020 & 2033
- Table 44: Argentina Bio simulation Market Revenue (billion) Forecast, by Application 2020 & 2033
- Table 45: Rest of South America Bio simulation Market Revenue (billion) Forecast, by Application 2020 & 2033
Frequently Asked Questions
1. What is the projected Compound Annual Growth Rate (CAGR) of the Bio simulation Market?
The projected CAGR is approximately 16.7%.
2. Which companies are prominent players in the Bio simulation Market?
Key companies in the market include Entelos Inc*List Not Exhaustive, Pharmaceutical Product Development LLC, In Silico Biosciences Inc, Schrodinger LLC, Compugen Inc, Biovia, Leadscope Inc, Certara L P, Simulations Plus Inc, Genedata.
3. What are the main segments of the Bio simulation Market?
The market segments include Product, Application, End User.
4. Can you provide details about the market size?
The market size is estimated to be USD 4.24 billion as of 2022.
5. What are some drivers contributing to market growth?
Increasing Healthcare Expenditure; Growing Adoption of Biosimulation Software; High Drug Discovery and Development Costs.
6. What are the notable trends driving market growth?
Software Segment is Expected to Show Significant Growth Over the Forecast Period.
7. Are there any restraints impacting market growth?
Lack of Awareness Among Healthcare Professionals; Lack of Skilled Personnel.
8. Can you provide examples of recent developments in the market?
In June 2022, Certara announced a launch of a new version of its Immunogenicity (IG), Immuno-Oncology (IO), and Vaccine Simulators to help predict how drugs work and address key questions in the development of novel biologic therapies.
9. What pricing options are available for accessing the report?
Pricing options include single-user, multi-user, and enterprise licenses priced at USD 4750, USD 5250, and USD 8750 respectively.
10. Is the market size provided in terms of value or volume?
The market size is provided in terms of value, measured in billion.
11. Are there any specific market keywords associated with the report?
Yes, the market keyword associated with the report is "Bio simulation Market," which aids in identifying and referencing the specific market segment covered.
12. How do I determine which pricing option suits my needs best?
The pricing options vary based on user requirements and access needs. Individual users may opt for single-user licenses, while businesses requiring broader access may choose multi-user or enterprise licenses for cost-effective access to the report.
13. Are there any additional resources or data provided in the Bio simulation Market report?
While the report offers comprehensive insights, it's advisable to review the specific contents or supplementary materials provided to ascertain if additional resources or data are available.
14. How can I stay updated on further developments or reports in the Bio simulation Market?
To stay informed about further developments, trends, and reports in the Bio simulation Market, consider subscribing to industry newsletters, following relevant companies and organizations, or regularly checking reputable industry news sources and publications.
Methodology
Step 1 - Identification of Relevant Samples Size from Population Database


Step 2 - Approaches for Defining Global Market Size (Value, Volume* & Price*)

Note*: In applicable scenarios
Step 3 - Data Sources
Primary Research
- Web Analytics
- Survey Reports
- Research Institute
- Latest Research Reports
- Opinion Leaders
Secondary Research
- Annual Reports
- White Paper
- Latest Press Release
- Industry Association
- Paid Database
- Investor Presentations

Step 4 - Data Triangulation
Involves using different sources of information in order to increase the validity of a study
These sources are likely to be stakeholders in a program - participants, other researchers, program staff, other community members, and so on.
Then we put all data in single framework & apply various statistical tools to find out the dynamic on the market.
During the analysis stage, feedback from the stakeholder groups would be compared to determine areas of agreement as well as areas of divergence