

Key Insights
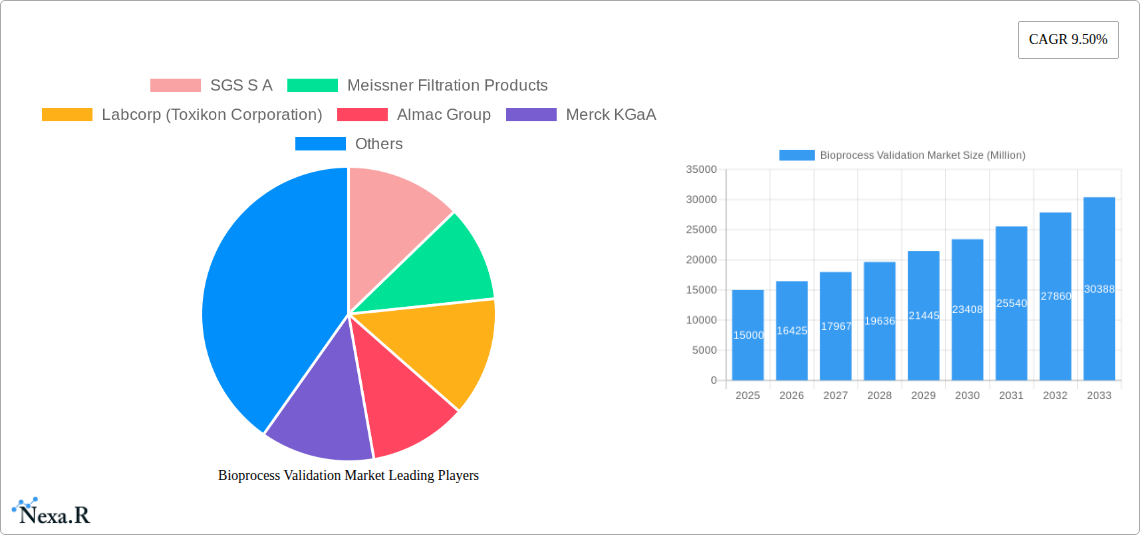
The bioprocess validation market is poised for substantial expansion, driven by escalating demand for biopharmaceuticals and sophisticated bioprocessing advancements. A projected Compound Annual Growth Rate (CAGR) of 9.7% indicates significant market value appreciation throughout the forecast period, from 2025 to 2033. Key growth catalysts include the rising incidence of chronic diseases requiring novel therapeutic solutions, the widespread adoption of cutting-edge bioprocessing methodologies such as single-use technologies and continuous manufacturing, and stringent regulatory mandates focused on product quality and patient safety. The pharmaceutical and biotechnology industries are the primary demand generators, with Contract Development and Manufacturing Organizations (CDMOs) assuming an increasingly vital role. Market segmentation by test type highlights a robust demand for extractables and leachables testing, microbiological testing, and physiochemical testing, reflecting the comprehensive validation requirements intrinsic to biopharmaceutical production. Within process components, filter elements, media containers, and bioreactors represent key segments, underscoring the critical nature of equipment validation in ensuring product integrity and process consistency. While North America and Europe currently dominate market share, the Asia-Pacific region is anticipated to experience accelerated growth, fueled by expanding biopharmaceutical manufacturing capacities and heightened sector investments. Despite challenges related to high testing expenditures and validation process intricacies, the overall market outlook remains exceptionally positive, supported by continuous innovation and supportive regulatory frameworks promising sustained growth in the foreseeable future.
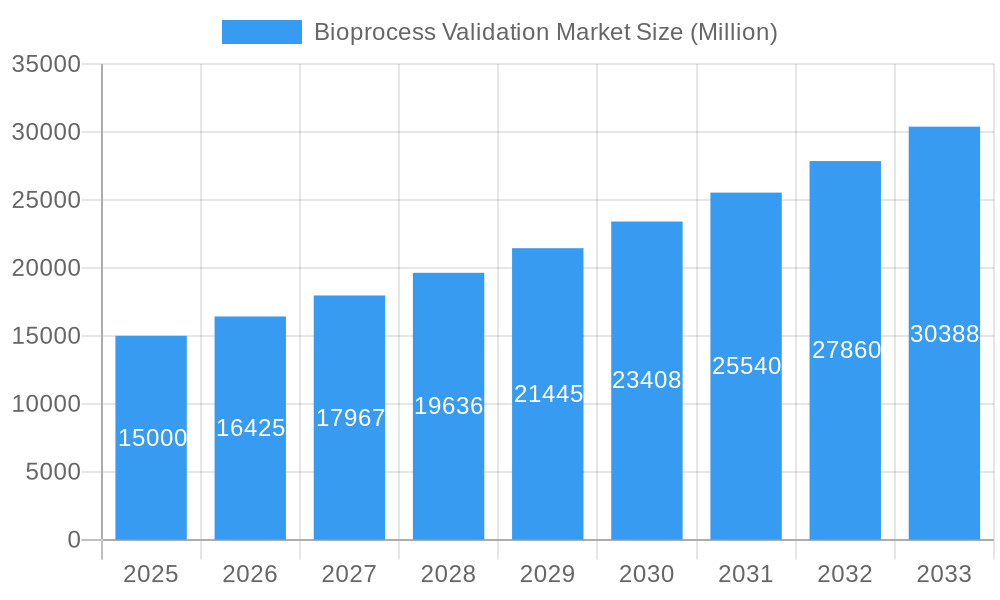
Bioprocess Validation Market Market Size (In Million)
Market segmentation offers deeper insights into its dynamic trajectory. The significant growth within the pharmaceutical and biotechnology sectors, coupled with increased outsourcing to CDMOs, directly fuels the demand for comprehensive validation services. The emergence of personalized medicine and cell and gene therapies further amplifies this demand, necessitating rigorous validation protocols to guarantee the safety and efficacy of these complex treatments. Among various testing categories, the imperative for thorough extractables and leachables testing underscores the stringent regulatory oversight concerning potential contaminants migrating from manufacturing materials. Similarly, the critical importance of microbiological and physiochemical testing emphasizes the necessity of maintaining the sterility and purity of biopharmaceutical products. This multifaceted growth, propelled by both technological innovation and regulatory imperatives, presents lucrative opportunities for market participants to innovate and broaden their service offerings within this continually evolving landscape.
Bioprocess Validation Market Company Market Share
Bioprocess Validation Market: A Comprehensive Report (2019-2033)
This comprehensive report provides a detailed analysis of the Bioprocess Validation Market, encompassing market dynamics, growth trends, regional segmentation, product landscape, key players, and future outlook. The study period spans from 2019 to 2033, with 2025 serving as the base and estimated year. The report delves into the parent market of Biotechnology and Pharmaceutical Services and the child market of Bioprocess Validation Testing Services, offering granular insights to industry professionals, investors, and stakeholders. The market size is projected to reach xx Million by 2033.
Bioprocess Validation Market Dynamics & Structure
The Bioprocess Validation Market is characterized by moderate concentration, with key players holding significant market share. Technological advancements, stringent regulatory frameworks (e.g., GMP guidelines), and the emergence of competitive substitutes are shaping market dynamics. The increasing demand for biologics fuels the growth of this market. The pharmaceutical and biotechnology sectors are the primary end-users, driving demand for robust validation services. M&A activity remains a significant driver, with xx deals recorded between 2019 and 2024, resulting in a market share consolidation of approximately xx%.
- Market Concentration: Moderately concentrated, with top 10 players holding approximately xx% market share.
- Technological Innovation: Driven by advancements in analytical techniques, automation, and data analytics. Barriers include high R&D costs and regulatory approval processes.
- Regulatory Framework: Stringent GMP guidelines and regulatory approvals significantly influence market dynamics.
- Competitive Substitutes: Limited direct substitutes; however, alternative testing methods and in-house validation capabilities pose indirect competition.
- End-User Demographics: Predominantly pharmaceutical and biotechnology companies, with increasing involvement of contract development and manufacturing organizations (CDMOs).
- M&A Trends: Consolidation through mergers and acquisitions is a prevalent trend, aiming to expand service offerings and geographic reach.
Bioprocess Validation Market Growth Trends & Insights
The Bioprocess Validation Market exhibits a robust growth trajectory, driven by factors such as the increasing demand for biologics, stringent regulatory requirements, and rising outsourcing of validation activities. The market size experienced a CAGR of xx% during the historical period (2019-2024) and is projected to maintain a CAGR of xx% during the forecast period (2025-2033). This growth is fueled by increasing adoption of advanced analytical techniques, automation of validation processes, and rising investments in research and development. Technological disruptions, particularly in analytical instrumentation and data management systems, are reshaping industry practices. Consumer behavior shifts reflect an increasing preference for outsourced validation services due to cost-effectiveness and expertise.
Dominant Regions, Countries, or Segments in Bioprocess Validation Market
North America currently dominates the Bioprocess Validation Market, driven by strong regulatory frameworks, high investments in R&D, and the presence of major pharmaceutical and biotechnology companies. Europe follows closely, with significant growth in Asia-Pacific expected in the coming years. Within market segments, Extractables Testing Services and Microbiological Testing Services hold the largest shares due to stringent regulatory requirements related to product safety and purity.
- By Test Type: Extractables Testing Services and Microbiological Testing Services are leading segments, with xx% and xx% market share respectively in 2025.
- By Process Component: Filter elements and bioreactors are major contributors to market growth, driven by their critical role in bioprocessing.
- By End User: Pharmaceutical & Biotechnology Companies segment leads with xx% market share, followed by CDMOs.
- Key Drivers:
- Strong regulatory environment in North America and Europe
- Increasing biologics production
- Rising outsourcing of validation services
- Technological advancements
Bioprocess Validation Market Product Landscape
The Bioprocess Validation Market offers a wide range of services, including extractables and leachables testing, microbiological testing, physiochemical testing, and integrity testing. Recent innovations focus on automation, high-throughput screening, and advanced analytical techniques. Key selling propositions include reduced testing times, enhanced accuracy, and compliance with stringent regulatory guidelines. Technological advancements encompass the integration of AI and machine learning for data analysis and process optimization.
Key Drivers, Barriers & Challenges in Bioprocess Validation Market
Key Drivers: The market is driven by the increasing demand for biologics, stringent regulatory compliance requirements, and the growing preference for outsourcing validation services. Technological advancements, particularly in automation and data analytics, further contribute to market expansion.
Key Challenges & Restraints: High costs associated with validation activities, stringent regulatory hurdles (e.g., obtaining approvals for new technologies), and intense competition among service providers present significant challenges. Supply chain disruptions can impact the availability of critical reagents and equipment, negatively affecting service delivery.
Emerging Opportunities in Bioprocess Validation Market
Emerging opportunities lie in the development of innovative testing methodologies, expansion into emerging markets (e.g., Asia-Pacific), and the integration of advanced technologies such as AI and machine learning. Untapped markets include personalized medicine and cell and gene therapies. The increasing adoption of continuous manufacturing processes also presents significant growth potential.
Growth Accelerators in the Bioprocess Validation Market Industry
Technological breakthroughs in analytical techniques and automation are significant growth accelerators. Strategic partnerships between validation service providers and biopharmaceutical companies foster innovation and market penetration. Expansion into emerging markets, driven by rising healthcare spending and increasing biologics production, further accelerates market growth.
Key Players Shaping the Bioprocess Validation Market Market
- SGS S A
- Meissner Filtration Products
- Labcorp (Toxikon Corporation)
- Almac Group
- Merck KGaA
- Eurofins Scientific
- Cobetter Filtration Equipments Co Ltd
- Pall Corporation
- Sartorius AG
- Thermo Fisher Scientific
- DOC S r l
Notable Milestones in Bioprocess Validation Market Sector
- May 2022: Qosina launched its new Bioprocess Resource Center, enhancing information accessibility for industry professionals.
- September 2022: Eppendorf SE expanded its bioprocess site in Jülich, Germany, indicating increased capacity and investment in the sector.
In-Depth Bioprocess Validation Market Market Outlook
The Bioprocess Validation Market is poised for sustained growth, driven by ongoing technological advancements, increasing demand for biologics, and the continued expansion of the pharmaceutical and biotechnology industries. Strategic partnerships, geographical expansion, and the development of innovative testing services will further shape the market landscape. The market's future potential is significant, presenting substantial opportunities for established players and new entrants alike.
Bioprocess Validation Market Segmentation
-
1. Test Type
- 1.1. Extractables Testing Services
- 1.2. Microbiological Testing Services
- 1.3. Physiochemical Testing Services
- 1.4. Integrity Testing Services
- 1.5. Compatibility Testing Services
- 1.6. Other Testing Services
-
2. Process Component
- 2.1. Filter Elements
- 2.2. Media containers and bags
- 2.3. Freezing And Thawing Process Bags
- 2.4. Mixing Systems
- 2.5. Bioreactors
- 2.6. Transfer Systems
- 2.7. Others
-
3. End User
- 3.1. Pharmaceutical & Biotechnology Companies
- 3.2. Contract Development & Manufacturing Organizations
- 3.3. Other End Users
Bioprocess Validation Market Segmentation By Geography
-
1. North America
- 1.1. United States
- 1.2. Canada
- 1.3. Mexico
-
2. Europe
- 2.1. Germany
- 2.2. United Kingdom
- 2.3. France
- 2.4. Italy
- 2.5. Spain
- 2.6. Rest of Europe
-
3. Asia Pacific
- 3.1. China
- 3.2. Japan
- 3.3. India
- 3.4. Australia
- 3.5. South Korea
- 3.6. Rest of Asia Pacific
-
4. Middle East and Africa
- 4.1. GCC
- 4.2. South Africa
- 4.3. Rest of Middle East and Africa
-
5. South America
- 5.1. Brazil
- 5.2. Argentina
- 5.3. Rest of South America
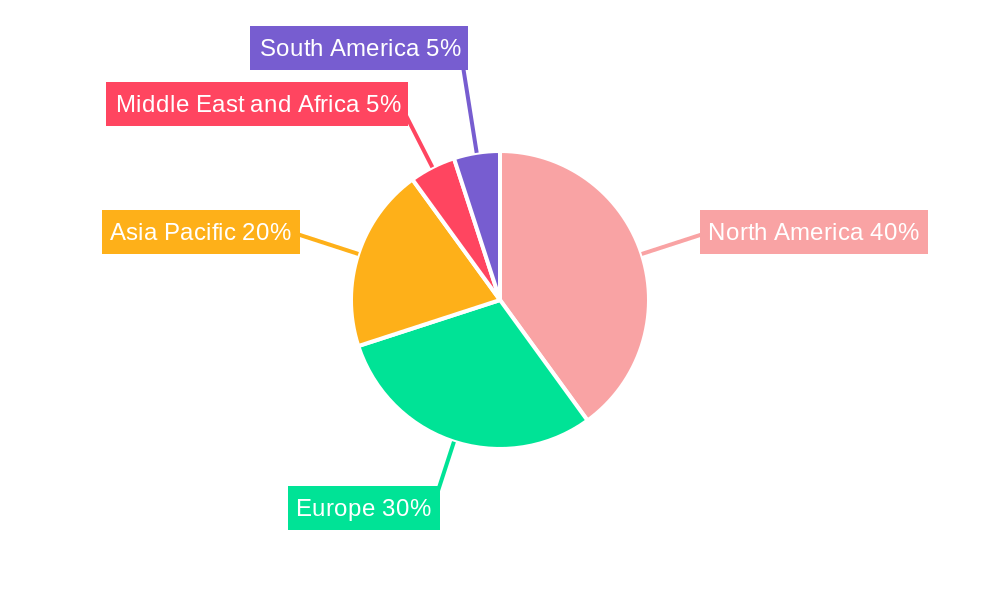
Bioprocess Validation Market Regional Market Share
Geographic Coverage of Bioprocess Validation Market
Bioprocess Validation Market REPORT HIGHLIGHTS
| Aspects | Details |
|---|---|
| Study Period | 2020-2034 |
| Base Year | 2025 |
| Estimated Year | 2026 |
| Forecast Period | 2026-2034 |
| Historical Period | 2020-2025 |
| Growth Rate | CAGR of 9.7% from 2020-2034 |
| Segmentation |
|
Table of Contents
- 1. Introduction
- 1.1. Research Scope
- 1.2. Market Segmentation
- 1.3. Research Objective
- 1.4. Definitions and Assumptions
- 2. Executive Summary
- 2.1. Market Snapshot
- 3. Market Dynamics
- 3.1. Market Drivers
- 3.2. Market Restrains
- 3.3. Market Trends
- 3.4. Market Opportunities
- 4. Market Factor Analysis
- 4.1. Porters Five Forces
- 4.1.1. Bargaining Power of Suppliers
- 4.1.2. Bargaining Power of Buyers
- 4.1.3. Threat of New Entrants
- 4.1.4. Threat of Substitutes
- 4.1.5. Competitive Rivalry
- 4.2. PESTEL analysis
- 4.3. BCG Analysis
- 4.3.1. Stars (High Growth, High Market Share)
- 4.3.2. Cash Cows (Low Growth, High Market Share)
- 4.3.3. Question Mark (High Growth, Low Market Share)
- 4.3.4. Dogs (Low Growth, Low Market Share)
- 4.4. Ansoff Matrix Analysis
- 4.5. Supply Chain Analysis
- 4.6. Regulatory Landscape
- 4.7. Current Market Potential and Opportunity Assessment (TAM–SAM–SOM Framework)
- 4.8. NRP Analyst Note
- 4.1. Porters Five Forces
- 5. Market Analysis, Insights and Forecast 2021-2033
- 5.1. Market Analysis, Insights and Forecast - by Test Type
- 5.1.1. Extractables Testing Services
- 5.1.2. Microbiological Testing Services
- 5.1.3. Physiochemical Testing Services
- 5.1.4. Integrity Testing Services
- 5.1.5. Compatibility Testing Services
- 5.1.6. Other Testing Services
- 5.2. Market Analysis, Insights and Forecast - by Process Component
- 5.2.1. Filter Elements
- 5.2.2. Media containers and bags
- 5.2.3. Freezing And Thawing Process Bags
- 5.2.4. Mixing Systems
- 5.2.5. Bioreactors
- 5.2.6. Transfer Systems
- 5.2.7. Others
- 5.3. Market Analysis, Insights and Forecast - by End User
- 5.3.1. Pharmaceutical & Biotechnology Companies
- 5.3.2. Contract Development & Manufacturing Organizations
- 5.3.3. Other End Users
- 5.4. Market Analysis, Insights and Forecast - by Region
- 5.4.1. North America
- 5.4.2. Europe
- 5.4.3. Asia Pacific
- 5.4.4. Middle East and Africa
- 5.4.5. South America
- 5.1. Market Analysis, Insights and Forecast - by Test Type
- 6. Global Bioprocess Validation Market Analysis, Insights and Forecast, 2021-2033
- 6.1. Market Analysis, Insights and Forecast - by Test Type
- 6.1.1. Extractables Testing Services
- 6.1.2. Microbiological Testing Services
- 6.1.3. Physiochemical Testing Services
- 6.1.4. Integrity Testing Services
- 6.1.5. Compatibility Testing Services
- 6.1.6. Other Testing Services
- 6.2. Market Analysis, Insights and Forecast - by Process Component
- 6.2.1. Filter Elements
- 6.2.2. Media containers and bags
- 6.2.3. Freezing And Thawing Process Bags
- 6.2.4. Mixing Systems
- 6.2.5. Bioreactors
- 6.2.6. Transfer Systems
- 6.2.7. Others
- 6.3. Market Analysis, Insights and Forecast - by End User
- 6.3.1. Pharmaceutical & Biotechnology Companies
- 6.3.2. Contract Development & Manufacturing Organizations
- 6.3.3. Other End Users
- 6.1. Market Analysis, Insights and Forecast - by Test Type
- 7. North America Bioprocess Validation Market Analysis, Insights and Forecast, 2020-2032
- 7.1. Market Analysis, Insights and Forecast - by Test Type
- 7.1.1. Extractables Testing Services
- 7.1.2. Microbiological Testing Services
- 7.1.3. Physiochemical Testing Services
- 7.1.4. Integrity Testing Services
- 7.1.5. Compatibility Testing Services
- 7.1.6. Other Testing Services
- 7.2. Market Analysis, Insights and Forecast - by Process Component
- 7.2.1. Filter Elements
- 7.2.2. Media containers and bags
- 7.2.3. Freezing And Thawing Process Bags
- 7.2.4. Mixing Systems
- 7.2.5. Bioreactors
- 7.2.6. Transfer Systems
- 7.2.7. Others
- 7.3. Market Analysis, Insights and Forecast - by End User
- 7.3.1. Pharmaceutical & Biotechnology Companies
- 7.3.2. Contract Development & Manufacturing Organizations
- 7.3.3. Other End Users
- 7.1. Market Analysis, Insights and Forecast - by Test Type
- 8. Europe Bioprocess Validation Market Analysis, Insights and Forecast, 2020-2032
- 8.1. Market Analysis, Insights and Forecast - by Test Type
- 8.1.1. Extractables Testing Services
- 8.1.2. Microbiological Testing Services
- 8.1.3. Physiochemical Testing Services
- 8.1.4. Integrity Testing Services
- 8.1.5. Compatibility Testing Services
- 8.1.6. Other Testing Services
- 8.2. Market Analysis, Insights and Forecast - by Process Component
- 8.2.1. Filter Elements
- 8.2.2. Media containers and bags
- 8.2.3. Freezing And Thawing Process Bags
- 8.2.4. Mixing Systems
- 8.2.5. Bioreactors
- 8.2.6. Transfer Systems
- 8.2.7. Others
- 8.3. Market Analysis, Insights and Forecast - by End User
- 8.3.1. Pharmaceutical & Biotechnology Companies
- 8.3.2. Contract Development & Manufacturing Organizations
- 8.3.3. Other End Users
- 8.1. Market Analysis, Insights and Forecast - by Test Type
- 9. Asia Pacific Bioprocess Validation Market Analysis, Insights and Forecast, 2020-2032
- 9.1. Market Analysis, Insights and Forecast - by Test Type
- 9.1.1. Extractables Testing Services
- 9.1.2. Microbiological Testing Services
- 9.1.3. Physiochemical Testing Services
- 9.1.4. Integrity Testing Services
- 9.1.5. Compatibility Testing Services
- 9.1.6. Other Testing Services
- 9.2. Market Analysis, Insights and Forecast - by Process Component
- 9.2.1. Filter Elements
- 9.2.2. Media containers and bags
- 9.2.3. Freezing And Thawing Process Bags
- 9.2.4. Mixing Systems
- 9.2.5. Bioreactors
- 9.2.6. Transfer Systems
- 9.2.7. Others
- 9.3. Market Analysis, Insights and Forecast - by End User
- 9.3.1. Pharmaceutical & Biotechnology Companies
- 9.3.2. Contract Development & Manufacturing Organizations
- 9.3.3. Other End Users
- 9.1. Market Analysis, Insights and Forecast - by Test Type
- 10. Middle East and Africa Bioprocess Validation Market Analysis, Insights and Forecast, 2020-2032
- 10.1. Market Analysis, Insights and Forecast - by Test Type
- 10.1.1. Extractables Testing Services
- 10.1.2. Microbiological Testing Services
- 10.1.3. Physiochemical Testing Services
- 10.1.4. Integrity Testing Services
- 10.1.5. Compatibility Testing Services
- 10.1.6. Other Testing Services
- 10.2. Market Analysis, Insights and Forecast - by Process Component
- 10.2.1. Filter Elements
- 10.2.2. Media containers and bags
- 10.2.3. Freezing And Thawing Process Bags
- 10.2.4. Mixing Systems
- 10.2.5. Bioreactors
- 10.2.6. Transfer Systems
- 10.2.7. Others
- 10.3. Market Analysis, Insights and Forecast - by End User
- 10.3.1. Pharmaceutical & Biotechnology Companies
- 10.3.2. Contract Development & Manufacturing Organizations
- 10.3.3. Other End Users
- 10.1. Market Analysis, Insights and Forecast - by Test Type
- 11. South America Bioprocess Validation Market Analysis, Insights and Forecast, 2020-2032
- 11.1. Market Analysis, Insights and Forecast - by Test Type
- 11.1.1. Extractables Testing Services
- 11.1.2. Microbiological Testing Services
- 11.1.3. Physiochemical Testing Services
- 11.1.4. Integrity Testing Services
- 11.1.5. Compatibility Testing Services
- 11.1.6. Other Testing Services
- 11.2. Market Analysis, Insights and Forecast - by Process Component
- 11.2.1. Filter Elements
- 11.2.2. Media containers and bags
- 11.2.3. Freezing And Thawing Process Bags
- 11.2.4. Mixing Systems
- 11.2.5. Bioreactors
- 11.2.6. Transfer Systems
- 11.2.7. Others
- 11.3. Market Analysis, Insights and Forecast - by End User
- 11.3.1. Pharmaceutical & Biotechnology Companies
- 11.3.2. Contract Development & Manufacturing Organizations
- 11.3.3. Other End Users
- 11.1. Market Analysis, Insights and Forecast - by Test Type
- 12. Competitive Analysis
- 12.1. Company Profiles
- 12.1.1 SGS S A
- 12.1.1.1. Company Overview
- 12.1.1.2. Products
- 12.1.1.3. Company Financials
- 12.1.1.4. SWOT Analysis
- 12.1.2 Meissner Filtration Products
- 12.1.2.1. Company Overview
- 12.1.2.2. Products
- 12.1.2.3. Company Financials
- 12.1.2.4. SWOT Analysis
- 12.1.3 Labcorp (Toxikon Corporation)
- 12.1.3.1. Company Overview
- 12.1.3.2. Products
- 12.1.3.3. Company Financials
- 12.1.3.4. SWOT Analysis
- 12.1.4 Almac Group
- 12.1.4.1. Company Overview
- 12.1.4.2. Products
- 12.1.4.3. Company Financials
- 12.1.4.4. SWOT Analysis
- 12.1.5 Merck KGaA
- 12.1.5.1. Company Overview
- 12.1.5.2. Products
- 12.1.5.3. Company Financials
- 12.1.5.4. SWOT Analysis
- 12.1.6 Eurofins Scientific
- 12.1.6.1. Company Overview
- 12.1.6.2. Products
- 12.1.6.3. Company Financials
- 12.1.6.4. SWOT Analysis
- 12.1.7 Cobetter Filtration Equipments Co Ltd
- 12.1.7.1. Company Overview
- 12.1.7.2. Products
- 12.1.7.3. Company Financials
- 12.1.7.4. SWOT Analysis
- 12.1.8 Pall Corporation
- 12.1.8.1. Company Overview
- 12.1.8.2. Products
- 12.1.8.3. Company Financials
- 12.1.8.4. SWOT Analysis
- 12.1.9 Sartorius AG
- 12.1.9.1. Company Overview
- 12.1.9.2. Products
- 12.1.9.3. Company Financials
- 12.1.9.4. SWOT Analysis
- 12.1.10 Thermo Fisher Scientific
- 12.1.10.1. Company Overview
- 12.1.10.2. Products
- 12.1.10.3. Company Financials
- 12.1.10.4. SWOT Analysis
- 12.1.11 DOC S r l
- 12.1.11.1. Company Overview
- 12.1.11.2. Products
- 12.1.11.3. Company Financials
- 12.1.11.4. SWOT Analysis
- 12.1.1 SGS S A
- 12.2. Market Entropy
- 12.2.1 Company's Key Areas Served
- 12.2.2 Recent Developments
- 12.3. Company Market Share Analysis 2025
- 12.3.1 Top 5 Companies Market Share Analysis
- 12.3.2 Top 3 Companies Market Share Analysis
- 12.4. List of Potential Customers
- 13. Research Methodology
List of Figures
- Figure 1: Global Bioprocess Validation Market Revenue Breakdown (million, %) by Region 2025 & 2033
- Figure 2: Global Bioprocess Validation Market Volume Breakdown (K Unit, %) by Region 2025 & 2033
- Figure 3: North America Bioprocess Validation Market Revenue (million), by Test Type 2025 & 2033
- Figure 4: North America Bioprocess Validation Market Volume (K Unit), by Test Type 2025 & 2033
- Figure 5: North America Bioprocess Validation Market Revenue Share (%), by Test Type 2025 & 2033
- Figure 6: North America Bioprocess Validation Market Volume Share (%), by Test Type 2025 & 2033
- Figure 7: North America Bioprocess Validation Market Revenue (million), by Process Component 2025 & 2033
- Figure 8: North America Bioprocess Validation Market Volume (K Unit), by Process Component 2025 & 2033
- Figure 9: North America Bioprocess Validation Market Revenue Share (%), by Process Component 2025 & 2033
- Figure 10: North America Bioprocess Validation Market Volume Share (%), by Process Component 2025 & 2033
- Figure 11: North America Bioprocess Validation Market Revenue (million), by End User 2025 & 2033
- Figure 12: North America Bioprocess Validation Market Volume (K Unit), by End User 2025 & 2033
- Figure 13: North America Bioprocess Validation Market Revenue Share (%), by End User 2025 & 2033
- Figure 14: North America Bioprocess Validation Market Volume Share (%), by End User 2025 & 2033
- Figure 15: North America Bioprocess Validation Market Revenue (million), by Country 2025 & 2033
- Figure 16: North America Bioprocess Validation Market Volume (K Unit), by Country 2025 & 2033
- Figure 17: North America Bioprocess Validation Market Revenue Share (%), by Country 2025 & 2033
- Figure 18: North America Bioprocess Validation Market Volume Share (%), by Country 2025 & 2033
- Figure 19: Europe Bioprocess Validation Market Revenue (million), by Test Type 2025 & 2033
- Figure 20: Europe Bioprocess Validation Market Volume (K Unit), by Test Type 2025 & 2033
- Figure 21: Europe Bioprocess Validation Market Revenue Share (%), by Test Type 2025 & 2033
- Figure 22: Europe Bioprocess Validation Market Volume Share (%), by Test Type 2025 & 2033
- Figure 23: Europe Bioprocess Validation Market Revenue (million), by Process Component 2025 & 2033
- Figure 24: Europe Bioprocess Validation Market Volume (K Unit), by Process Component 2025 & 2033
- Figure 25: Europe Bioprocess Validation Market Revenue Share (%), by Process Component 2025 & 2033
- Figure 26: Europe Bioprocess Validation Market Volume Share (%), by Process Component 2025 & 2033
- Figure 27: Europe Bioprocess Validation Market Revenue (million), by End User 2025 & 2033
- Figure 28: Europe Bioprocess Validation Market Volume (K Unit), by End User 2025 & 2033
- Figure 29: Europe Bioprocess Validation Market Revenue Share (%), by End User 2025 & 2033
- Figure 30: Europe Bioprocess Validation Market Volume Share (%), by End User 2025 & 2033
- Figure 31: Europe Bioprocess Validation Market Revenue (million), by Country 2025 & 2033
- Figure 32: Europe Bioprocess Validation Market Volume (K Unit), by Country 2025 & 2033
- Figure 33: Europe Bioprocess Validation Market Revenue Share (%), by Country 2025 & 2033
- Figure 34: Europe Bioprocess Validation Market Volume Share (%), by Country 2025 & 2033
- Figure 35: Asia Pacific Bioprocess Validation Market Revenue (million), by Test Type 2025 & 2033
- Figure 36: Asia Pacific Bioprocess Validation Market Volume (K Unit), by Test Type 2025 & 2033
- Figure 37: Asia Pacific Bioprocess Validation Market Revenue Share (%), by Test Type 2025 & 2033
- Figure 38: Asia Pacific Bioprocess Validation Market Volume Share (%), by Test Type 2025 & 2033
- Figure 39: Asia Pacific Bioprocess Validation Market Revenue (million), by Process Component 2025 & 2033
- Figure 40: Asia Pacific Bioprocess Validation Market Volume (K Unit), by Process Component 2025 & 2033
- Figure 41: Asia Pacific Bioprocess Validation Market Revenue Share (%), by Process Component 2025 & 2033
- Figure 42: Asia Pacific Bioprocess Validation Market Volume Share (%), by Process Component 2025 & 2033
- Figure 43: Asia Pacific Bioprocess Validation Market Revenue (million), by End User 2025 & 2033
- Figure 44: Asia Pacific Bioprocess Validation Market Volume (K Unit), by End User 2025 & 2033
- Figure 45: Asia Pacific Bioprocess Validation Market Revenue Share (%), by End User 2025 & 2033
- Figure 46: Asia Pacific Bioprocess Validation Market Volume Share (%), by End User 2025 & 2033
- Figure 47: Asia Pacific Bioprocess Validation Market Revenue (million), by Country 2025 & 2033
- Figure 48: Asia Pacific Bioprocess Validation Market Volume (K Unit), by Country 2025 & 2033
- Figure 49: Asia Pacific Bioprocess Validation Market Revenue Share (%), by Country 2025 & 2033
- Figure 50: Asia Pacific Bioprocess Validation Market Volume Share (%), by Country 2025 & 2033
- Figure 51: Middle East and Africa Bioprocess Validation Market Revenue (million), by Test Type 2025 & 2033
- Figure 52: Middle East and Africa Bioprocess Validation Market Volume (K Unit), by Test Type 2025 & 2033
- Figure 53: Middle East and Africa Bioprocess Validation Market Revenue Share (%), by Test Type 2025 & 2033
- Figure 54: Middle East and Africa Bioprocess Validation Market Volume Share (%), by Test Type 2025 & 2033
- Figure 55: Middle East and Africa Bioprocess Validation Market Revenue (million), by Process Component 2025 & 2033
- Figure 56: Middle East and Africa Bioprocess Validation Market Volume (K Unit), by Process Component 2025 & 2033
- Figure 57: Middle East and Africa Bioprocess Validation Market Revenue Share (%), by Process Component 2025 & 2033
- Figure 58: Middle East and Africa Bioprocess Validation Market Volume Share (%), by Process Component 2025 & 2033
- Figure 59: Middle East and Africa Bioprocess Validation Market Revenue (million), by End User 2025 & 2033
- Figure 60: Middle East and Africa Bioprocess Validation Market Volume (K Unit), by End User 2025 & 2033
- Figure 61: Middle East and Africa Bioprocess Validation Market Revenue Share (%), by End User 2025 & 2033
- Figure 62: Middle East and Africa Bioprocess Validation Market Volume Share (%), by End User 2025 & 2033
- Figure 63: Middle East and Africa Bioprocess Validation Market Revenue (million), by Country 2025 & 2033
- Figure 64: Middle East and Africa Bioprocess Validation Market Volume (K Unit), by Country 2025 & 2033
- Figure 65: Middle East and Africa Bioprocess Validation Market Revenue Share (%), by Country 2025 & 2033
- Figure 66: Middle East and Africa Bioprocess Validation Market Volume Share (%), by Country 2025 & 2033
- Figure 67: South America Bioprocess Validation Market Revenue (million), by Test Type 2025 & 2033
- Figure 68: South America Bioprocess Validation Market Volume (K Unit), by Test Type 2025 & 2033
- Figure 69: South America Bioprocess Validation Market Revenue Share (%), by Test Type 2025 & 2033
- Figure 70: South America Bioprocess Validation Market Volume Share (%), by Test Type 2025 & 2033
- Figure 71: South America Bioprocess Validation Market Revenue (million), by Process Component 2025 & 2033
- Figure 72: South America Bioprocess Validation Market Volume (K Unit), by Process Component 2025 & 2033
- Figure 73: South America Bioprocess Validation Market Revenue Share (%), by Process Component 2025 & 2033
- Figure 74: South America Bioprocess Validation Market Volume Share (%), by Process Component 2025 & 2033
- Figure 75: South America Bioprocess Validation Market Revenue (million), by End User 2025 & 2033
- Figure 76: South America Bioprocess Validation Market Volume (K Unit), by End User 2025 & 2033
- Figure 77: South America Bioprocess Validation Market Revenue Share (%), by End User 2025 & 2033
- Figure 78: South America Bioprocess Validation Market Volume Share (%), by End User 2025 & 2033
- Figure 79: South America Bioprocess Validation Market Revenue (million), by Country 2025 & 2033
- Figure 80: South America Bioprocess Validation Market Volume (K Unit), by Country 2025 & 2033
- Figure 81: South America Bioprocess Validation Market Revenue Share (%), by Country 2025 & 2033
- Figure 82: South America Bioprocess Validation Market Volume Share (%), by Country 2025 & 2033
List of Tables
- Table 1: Global Bioprocess Validation Market Revenue million Forecast, by Test Type 2020 & 2033
- Table 2: Global Bioprocess Validation Market Volume K Unit Forecast, by Test Type 2020 & 2033
- Table 3: Global Bioprocess Validation Market Revenue million Forecast, by Process Component 2020 & 2033
- Table 4: Global Bioprocess Validation Market Volume K Unit Forecast, by Process Component 2020 & 2033
- Table 5: Global Bioprocess Validation Market Revenue million Forecast, by End User 2020 & 2033
- Table 6: Global Bioprocess Validation Market Volume K Unit Forecast, by End User 2020 & 2033
- Table 7: Global Bioprocess Validation Market Revenue million Forecast, by Region 2020 & 2033
- Table 8: Global Bioprocess Validation Market Volume K Unit Forecast, by Region 2020 & 2033
- Table 9: Global Bioprocess Validation Market Revenue million Forecast, by Test Type 2020 & 2033
- Table 10: Global Bioprocess Validation Market Volume K Unit Forecast, by Test Type 2020 & 2033
- Table 11: Global Bioprocess Validation Market Revenue million Forecast, by Process Component 2020 & 2033
- Table 12: Global Bioprocess Validation Market Volume K Unit Forecast, by Process Component 2020 & 2033
- Table 13: Global Bioprocess Validation Market Revenue million Forecast, by End User 2020 & 2033
- Table 14: Global Bioprocess Validation Market Volume K Unit Forecast, by End User 2020 & 2033
- Table 15: Global Bioprocess Validation Market Revenue million Forecast, by Country 2020 & 2033
- Table 16: Global Bioprocess Validation Market Volume K Unit Forecast, by Country 2020 & 2033
- Table 17: United States Bioprocess Validation Market Revenue (million) Forecast, by Application 2020 & 2033
- Table 18: United States Bioprocess Validation Market Volume (K Unit) Forecast, by Application 2020 & 2033
- Table 19: Canada Bioprocess Validation Market Revenue (million) Forecast, by Application 2020 & 2033
- Table 20: Canada Bioprocess Validation Market Volume (K Unit) Forecast, by Application 2020 & 2033
- Table 21: Mexico Bioprocess Validation Market Revenue (million) Forecast, by Application 2020 & 2033
- Table 22: Mexico Bioprocess Validation Market Volume (K Unit) Forecast, by Application 2020 & 2033
- Table 23: Global Bioprocess Validation Market Revenue million Forecast, by Test Type 2020 & 2033
- Table 24: Global Bioprocess Validation Market Volume K Unit Forecast, by Test Type 2020 & 2033
- Table 25: Global Bioprocess Validation Market Revenue million Forecast, by Process Component 2020 & 2033
- Table 26: Global Bioprocess Validation Market Volume K Unit Forecast, by Process Component 2020 & 2033
- Table 27: Global Bioprocess Validation Market Revenue million Forecast, by End User 2020 & 2033
- Table 28: Global Bioprocess Validation Market Volume K Unit Forecast, by End User 2020 & 2033
- Table 29: Global Bioprocess Validation Market Revenue million Forecast, by Country 2020 & 2033
- Table 30: Global Bioprocess Validation Market Volume K Unit Forecast, by Country 2020 & 2033
- Table 31: Germany Bioprocess Validation Market Revenue (million) Forecast, by Application 2020 & 2033
- Table 32: Germany Bioprocess Validation Market Volume (K Unit) Forecast, by Application 2020 & 2033
- Table 33: United Kingdom Bioprocess Validation Market Revenue (million) Forecast, by Application 2020 & 2033
- Table 34: United Kingdom Bioprocess Validation Market Volume (K Unit) Forecast, by Application 2020 & 2033
- Table 35: France Bioprocess Validation Market Revenue (million) Forecast, by Application 2020 & 2033
- Table 36: France Bioprocess Validation Market Volume (K Unit) Forecast, by Application 2020 & 2033
- Table 37: Italy Bioprocess Validation Market Revenue (million) Forecast, by Application 2020 & 2033
- Table 38: Italy Bioprocess Validation Market Volume (K Unit) Forecast, by Application 2020 & 2033
- Table 39: Spain Bioprocess Validation Market Revenue (million) Forecast, by Application 2020 & 2033
- Table 40: Spain Bioprocess Validation Market Volume (K Unit) Forecast, by Application 2020 & 2033
- Table 41: Rest of Europe Bioprocess Validation Market Revenue (million) Forecast, by Application 2020 & 2033
- Table 42: Rest of Europe Bioprocess Validation Market Volume (K Unit) Forecast, by Application 2020 & 2033
- Table 43: Global Bioprocess Validation Market Revenue million Forecast, by Test Type 2020 & 2033
- Table 44: Global Bioprocess Validation Market Volume K Unit Forecast, by Test Type 2020 & 2033
- Table 45: Global Bioprocess Validation Market Revenue million Forecast, by Process Component 2020 & 2033
- Table 46: Global Bioprocess Validation Market Volume K Unit Forecast, by Process Component 2020 & 2033
- Table 47: Global Bioprocess Validation Market Revenue million Forecast, by End User 2020 & 2033
- Table 48: Global Bioprocess Validation Market Volume K Unit Forecast, by End User 2020 & 2033
- Table 49: Global Bioprocess Validation Market Revenue million Forecast, by Country 2020 & 2033
- Table 50: Global Bioprocess Validation Market Volume K Unit Forecast, by Country 2020 & 2033
- Table 51: China Bioprocess Validation Market Revenue (million) Forecast, by Application 2020 & 2033
- Table 52: China Bioprocess Validation Market Volume (K Unit) Forecast, by Application 2020 & 2033
- Table 53: Japan Bioprocess Validation Market Revenue (million) Forecast, by Application 2020 & 2033
- Table 54: Japan Bioprocess Validation Market Volume (K Unit) Forecast, by Application 2020 & 2033
- Table 55: India Bioprocess Validation Market Revenue (million) Forecast, by Application 2020 & 2033
- Table 56: India Bioprocess Validation Market Volume (K Unit) Forecast, by Application 2020 & 2033
- Table 57: Australia Bioprocess Validation Market Revenue (million) Forecast, by Application 2020 & 2033
- Table 58: Australia Bioprocess Validation Market Volume (K Unit) Forecast, by Application 2020 & 2033
- Table 59: South Korea Bioprocess Validation Market Revenue (million) Forecast, by Application 2020 & 2033
- Table 60: South Korea Bioprocess Validation Market Volume (K Unit) Forecast, by Application 2020 & 2033
- Table 61: Rest of Asia Pacific Bioprocess Validation Market Revenue (million) Forecast, by Application 2020 & 2033
- Table 62: Rest of Asia Pacific Bioprocess Validation Market Volume (K Unit) Forecast, by Application 2020 & 2033
- Table 63: Global Bioprocess Validation Market Revenue million Forecast, by Test Type 2020 & 2033
- Table 64: Global Bioprocess Validation Market Volume K Unit Forecast, by Test Type 2020 & 2033
- Table 65: Global Bioprocess Validation Market Revenue million Forecast, by Process Component 2020 & 2033
- Table 66: Global Bioprocess Validation Market Volume K Unit Forecast, by Process Component 2020 & 2033
- Table 67: Global Bioprocess Validation Market Revenue million Forecast, by End User 2020 & 2033
- Table 68: Global Bioprocess Validation Market Volume K Unit Forecast, by End User 2020 & 2033
- Table 69: Global Bioprocess Validation Market Revenue million Forecast, by Country 2020 & 2033
- Table 70: Global Bioprocess Validation Market Volume K Unit Forecast, by Country 2020 & 2033
- Table 71: GCC Bioprocess Validation Market Revenue (million) Forecast, by Application 2020 & 2033
- Table 72: GCC Bioprocess Validation Market Volume (K Unit) Forecast, by Application 2020 & 2033
- Table 73: South Africa Bioprocess Validation Market Revenue (million) Forecast, by Application 2020 & 2033
- Table 74: South Africa Bioprocess Validation Market Volume (K Unit) Forecast, by Application 2020 & 2033
- Table 75: Rest of Middle East and Africa Bioprocess Validation Market Revenue (million) Forecast, by Application 2020 & 2033
- Table 76: Rest of Middle East and Africa Bioprocess Validation Market Volume (K Unit) Forecast, by Application 2020 & 2033
- Table 77: Global Bioprocess Validation Market Revenue million Forecast, by Test Type 2020 & 2033
- Table 78: Global Bioprocess Validation Market Volume K Unit Forecast, by Test Type 2020 & 2033
- Table 79: Global Bioprocess Validation Market Revenue million Forecast, by Process Component 2020 & 2033
- Table 80: Global Bioprocess Validation Market Volume K Unit Forecast, by Process Component 2020 & 2033
- Table 81: Global Bioprocess Validation Market Revenue million Forecast, by End User 2020 & 2033
- Table 82: Global Bioprocess Validation Market Volume K Unit Forecast, by End User 2020 & 2033
- Table 83: Global Bioprocess Validation Market Revenue million Forecast, by Country 2020 & 2033
- Table 84: Global Bioprocess Validation Market Volume K Unit Forecast, by Country 2020 & 2033
- Table 85: Brazil Bioprocess Validation Market Revenue (million) Forecast, by Application 2020 & 2033
- Table 86: Brazil Bioprocess Validation Market Volume (K Unit) Forecast, by Application 2020 & 2033
- Table 87: Argentina Bioprocess Validation Market Revenue (million) Forecast, by Application 2020 & 2033
- Table 88: Argentina Bioprocess Validation Market Volume (K Unit) Forecast, by Application 2020 & 2033
- Table 89: Rest of South America Bioprocess Validation Market Revenue (million) Forecast, by Application 2020 & 2033
- Table 90: Rest of South America Bioprocess Validation Market Volume (K Unit) Forecast, by Application 2020 & 2033
Frequently Asked Questions
1. What is the projected Compound Annual Growth Rate (CAGR) of the Bioprocess Validation Market?
The projected CAGR is approximately 9.7%.
2. Which companies are prominent players in the Bioprocess Validation Market?
Key companies in the market include SGS S A, Meissner Filtration Products, Labcorp (Toxikon Corporation), Almac Group, Merck KGaA, Eurofins Scientific, Cobetter Filtration Equipments Co Ltd, Pall Corporation, Sartorius AG, Thermo Fisher Scientific, DOC S r l.
3. What are the main segments of the Bioprocess Validation Market?
The market segments include Test Type, Process Component, End User.
4. Can you provide details about the market size?
The market size is estimated to be USD 554.8 million as of 2022.
5. What are some drivers contributing to market growth?
Increasing Demand for Biopharmaceuticals; Increasing Demand for Outsourcing Bioprocess Validation; Rising Life Science R&D Expenditure.
6. What are the notable trends driving market growth?
Bioreactor Expected to Hold Significant Market Share.
7. Are there any restraints impacting market growth?
Issues Related to Extractables & Leachables.
8. Can you provide examples of recent developments in the market?
May 2022: Qosina launched its new Bioprocess Resource Center, an information source for the bioprocess industry.
9. What pricing options are available for accessing the report?
Pricing options include single-user, multi-user, and enterprise licenses priced at USD 4750, USD 5250, and USD 8750 respectively.
10. Is the market size provided in terms of value or volume?
The market size is provided in terms of value, measured in million and volume, measured in K Unit.
11. Are there any specific market keywords associated with the report?
Yes, the market keyword associated with the report is "Bioprocess Validation Market," which aids in identifying and referencing the specific market segment covered.
12. How do I determine which pricing option suits my needs best?
The pricing options vary based on user requirements and access needs. Individual users may opt for single-user licenses, while businesses requiring broader access may choose multi-user or enterprise licenses for cost-effective access to the report.
13. Are there any additional resources or data provided in the Bioprocess Validation Market report?
While the report offers comprehensive insights, it's advisable to review the specific contents or supplementary materials provided to ascertain if additional resources or data are available.
14. How can I stay updated on further developments or reports in the Bioprocess Validation Market?
To stay informed about further developments, trends, and reports in the Bioprocess Validation Market, consider subscribing to industry newsletters, following relevant companies and organizations, or regularly checking reputable industry news sources and publications.
Methodology
Step 1 - Identification of Relevant Samples Size from Population Database


Step 2 - Approaches for Defining Global Market Size (Value, Volume* & Price*)

Note*: In applicable scenarios
Step 3 - Data Sources
Primary Research
- Web Analytics
- Survey Reports
- Research Institute
- Latest Research Reports
- Opinion Leaders
Secondary Research
- Annual Reports
- White Paper
- Latest Press Release
- Industry Association
- Paid Database
- Investor Presentations

Step 4 - Data Triangulation
Involves using different sources of information in order to increase the validity of a study
These sources are likely to be stakeholders in a program - participants, other researchers, program staff, other community members, and so on.
Then we put all data in single framework & apply various statistical tools to find out the dynamic on the market.
During the analysis stage, feedback from the stakeholder groups would be compared to determine areas of agreement as well as areas of divergence