

Key Insights
The global biosafety testing services market, estimated at $5.38 billion in 2025, is projected for significant expansion, with a compound annual growth rate (CAGR) of 10.69% from 2025 to 2033. This robust growth is propelled by several key drivers. The rapid expansion of the pharmaceutical and biotechnology sectors, particularly in the development of vaccines, cell and gene therapies, and blood-based therapeutics, is a primary catalyst for increased demand for comprehensive biosafety testing. Furthermore, stringent global regulatory mandates prioritizing product safety and quality assurance are accelerating market growth. A heightened emphasis on preventing contamination and ensuring product sterility across diverse applications, including medical devices, also contributes to this positive trajectory.
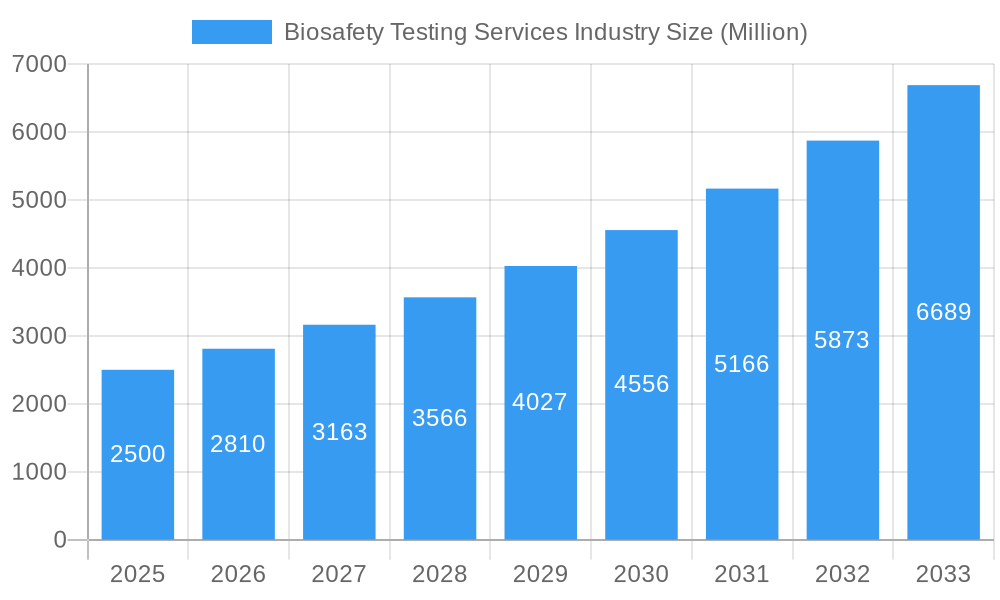
Biosafety Testing Services Industry Market Size (In Billion)
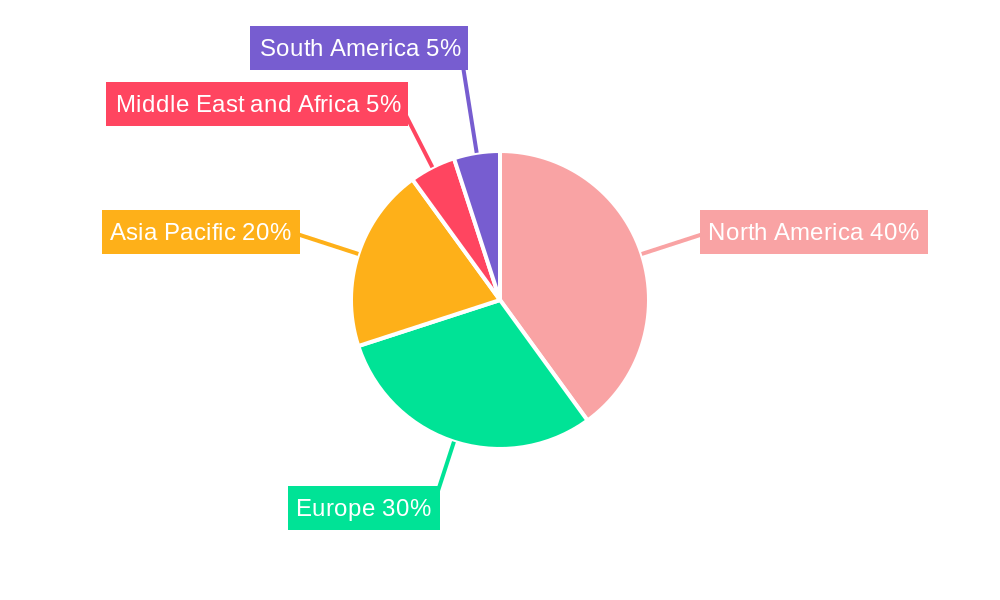
The market is segmented by product type (reagents and kits, instruments, other products), application (vaccines and therapeutics, cellular and gene therapy, blood and blood-based therapy, other applications), and test type (sterility tests, bioburden tests, endotoxin tests, other tests). North America currently dominates the market, attributed to its advanced infrastructure and substantial research and development investment. However, the Asia-Pacific region is anticipated to exhibit the fastest growth, fueled by escalating healthcare expenditures and the burgeoning pharmaceutical industry in emerging economies.
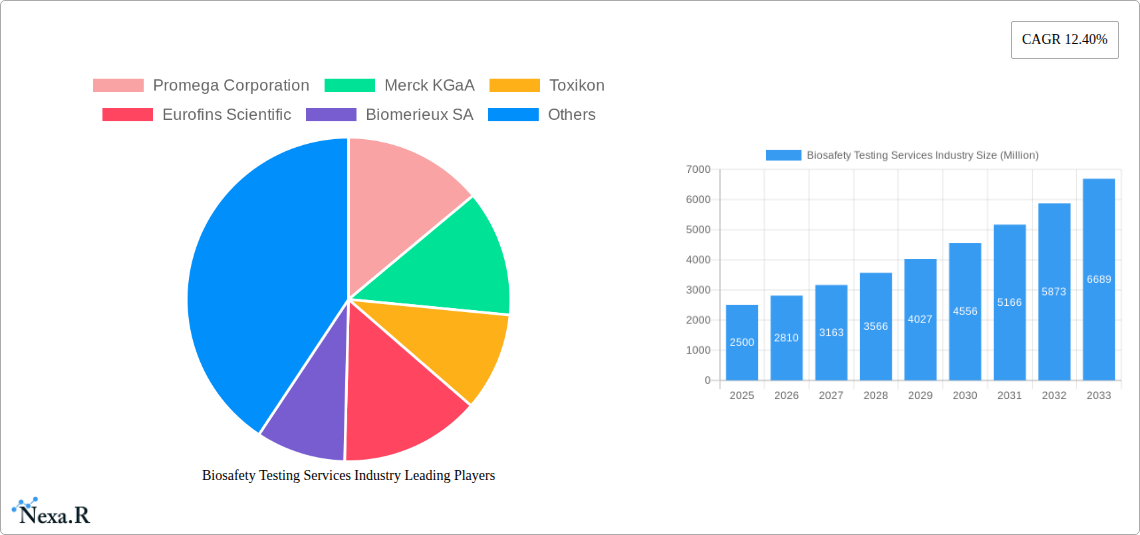
Biosafety Testing Services Industry Company Market Share
Key market players, including Promega Corporation, Merck KGaA, and Thermo Fisher Scientific, alongside emerging companies, are fostering innovation and enhancing service portfolios through competitive strategies.
Despite a promising growth outlook, the market confronts challenges such as the high cost of advanced testing technologies and the requirement for specialized expertise, which can impede market entry for smaller enterprises. Additionally, discrepancies in regulatory requirements across different regions may present operational complexities for international businesses. Nevertheless, ongoing advancements in more sensitive and efficient testing methodologies, coupled with an increasing focus on biosafety, are expected to mitigate these challenges, ensuring sustained market expansion. The future trajectory of the biosafety testing services market will be shaped by continued innovation in biotechnology, evolving regulatory environments, and a growing commitment to bio-contamination control.
Biosafety Testing Services Industry Market Report: 2019-2033
This comprehensive report provides a detailed analysis of the Biosafety Testing Services industry, encompassing market dynamics, growth trends, competitive landscape, and future outlook. With a study period spanning 2019-2033, a base year of 2025, and a forecast period of 2025-2033, this report offers invaluable insights for industry professionals, investors, and stakeholders. The report analyzes key segments including Reagents and Kits, Instruments, and Other Products, across applications like Vaccines and Therapeutics, Cellular and Gene Therapy, and Blood and Blood-based Therapies, and tests such as Sterility, Bioburden, and Endotoxin testing. Key players like Promega Corporation, Merck KGaA, and Thermo Fisher Scientific are profiled, providing a 360-degree view of this dynamic market. The market value is presented in million units.
Keywords: Biosafety Testing Services, Sterility Testing, Bioburden Testing, Endotoxin Testing, Reagents and Kits, Instruments, Vaccines, Therapeutics, Cellular and Gene Therapy, Blood Testing, Market Analysis, Market Forecast, Industry Trends, Competitive Landscape, Promega, Merck KGaA, Thermo Fisher Scientific, Eurofins Scientific, Biomerieux SA.
Biosafety Testing Services Industry Market Dynamics & Structure
The Biosafety Testing Services market is characterized by moderate concentration, with several large players holding significant market share, alongside numerous smaller specialized companies. Technological innovation, driven by advancements in automation, high-throughput screening, and molecular diagnostics, is a key driver of growth. Stringent regulatory frameworks, particularly in pharmaceutical and biotech sectors, necessitate comprehensive biosafety testing, shaping market demand. Competitive pressures arise from substitute technologies and the increasing need for cost-effective solutions. The end-user demographic includes pharmaceutical and biotechnology companies, research institutions, hospitals, and contract research organizations (CROs). M&A activity has been moderate, with larger companies strategically acquiring smaller players to expand their product portfolio and geographic reach.
- Market Concentration: Moderately concentrated, with top 5 players holding approximately xx% market share in 2025.
- Technological Innovation: Rapid advancements in automation, molecular diagnostics, and AI-driven analysis are driving market growth.
- Regulatory Landscape: Stringent regulatory compliance requirements across different geographies (e.g., FDA, EMA) mandate biosafety testing.
- Competitive Substitutes: Emerging technologies like advanced imaging and rapid diagnostic tests offer some level of substitution, although not fully.
- M&A Activity: xx deals recorded between 2019 and 2024, with an average deal value of $xx million.
- Innovation Barriers: High R&D costs and rigorous regulatory approvals pose significant challenges to new entrants.
Biosafety Testing Services Industry Growth Trends & Insights
The Biosafety Testing Services market experienced significant growth during the historical period (2019-2024), driven by factors such as the increasing demand for biologics, the rise of personalized medicine, and the growing prevalence of infectious diseases. The market is projected to continue its expansion during the forecast period (2025-2033), exhibiting a compound annual growth rate (CAGR) of xx%. Adoption rates for advanced testing technologies, like automated systems and rapid diagnostic assays are increasing, alongside a growing preference for outsourcing testing services by pharmaceutical companies. Consumer behavior shifts are influenced by increasing regulatory pressures and a heightened focus on quality control and patient safety. Technological disruptions are marked by the introduction of innovative products and the widespread application of automation.
- Market Size (2025): $xx Million
- Market Size (2033): $xx Million
- CAGR (2025-2033): xx%
- Market Penetration (2025): xx% of potential end-users
Dominant Regions, Countries, or Segments in Biosafety Testing Services Industry
North America currently holds the largest market share in the Biosafety Testing Services industry, driven by the high concentration of pharmaceutical and biotechnology companies, robust research infrastructure, and stringent regulatory frameworks. Europe follows closely, fueled by substantial investments in research and development and a growing focus on advanced therapeutic modalities. The reagents and kits segment represents the largest share of the product market, owing to the high volume consumption and cost-effectiveness of these consumables. Within applications, vaccines and therapeutics are the dominant segment, owing to its significant testing requirements throughout the drug development life cycle. Strong economic policies encouraging pharmaceutical investment, robust healthcare infrastructure, and increasing government funding for research initiatives in North America contribute significantly to its market dominance.
- Leading Region: North America (Market Share: xx%)
- Key Drivers in North America: Robust pharmaceutical industry, stringent regulations, high R&D spending.
- Leading Segment (Product): Reagents and Kits (Market Share: xx%)
- Key Drivers in Reagents & Kits Segment: Cost-effectiveness, high volume consumption.
- Leading Segment (Application): Vaccines and Therapeutics (Market Share: xx%)
- Key Drivers in Vaccines & Therapeutics Segment: Stringent regulatory requirements, high testing needs.
Biosafety Testing Services Industry Product Landscape
The Biosafety Testing Services market showcases a diverse product landscape, including reagents and kits, sophisticated instruments, and other specialized products. Recent innovations focus on automation, miniaturization, and increased throughput to enhance efficiency and accuracy. Unique selling propositions highlight improvements in speed, sensitivity, and ease-of-use. Technological advancements are particularly apparent in endotoxin testing, with automated robotic solutions becoming increasingly prevalent, alongside advancements in rapid microbial detection technologies.
Key Drivers, Barriers & Challenges in Biosafety Testing Services Industry
Key Drivers:
- Growing demand for biologics and advanced therapies.
- Stringent regulatory requirements driving increased testing.
- Technological advancements leading to improved efficiency and accuracy.
- Outsourcing of testing services by pharmaceutical companies.
Key Challenges & Restraints:
- High cost of advanced testing technologies limiting market penetration, particularly in emerging economies.
- Regulatory hurdles and compliance costs increase operational complexity and investment.
- Intense competition from established players and the entry of new participants can pressure prices.
- Supply chain disruptions can impact the availability of crucial reagents and consumables.
Emerging Opportunities in Biosafety Testing Services Industry
- Growing demand for personalized medicine and cell and gene therapies presents significant growth opportunities.
- Expansion into emerging markets with unmet needs offers potential for significant market penetration.
- Development of innovative, rapid, and point-of-care testing technologies is driving demand.
- Strategic collaborations between testing service providers and pharmaceutical companies are forging new avenues for growth.
Growth Accelerators in the Biosafety Testing Services Industry
Technological breakthroughs, particularly in automation, AI, and rapid diagnostics, are accelerating market growth. Strategic partnerships between testing providers and pharmaceutical companies are fostering innovation and market expansion. Increasing outsourcing of testing services by pharmaceutical and biotech companies is significantly boosting market demand. Expanding into high-growth emerging markets, coupled with a focus on providing cost-effective solutions, will further drive long-term growth.
Key Players Shaping the Biosafety Testing Services Market
- Promega Corporation
- Merck KGaA
- Toxikon
- Eurofins Scientific
- Biomerieux SA
- Cytovance Biologics
- WuXi AppTec
- Lonza
- Avance Biosciences
- Thermo Fisher Scientific
Notable Milestones in Biosafety Testing Services Industry Sector
- April 2021: Lonza expands its PyroTec PRO Automated Robotic Solution for endotoxin testing.
- December 2020: Redberry introduces the Red One Automated Bioburden Detection system.
In-Depth Biosafety Testing Services Industry Market Outlook
The Biosafety Testing Services market is poised for robust growth, driven by advancements in testing technologies, increasing demand for biologics, and the expanding global healthcare industry. Strategic partnerships, acquisitions, and expansion into untapped markets will shape the competitive landscape. Companies focusing on innovation, automation, and regulatory compliance will be best positioned for long-term success in this dynamic and essential market.
Biosafety Testing Services Industry Segmentation
-
1. Product
- 1.1. Reagents and Kits
- 1.2. Instruments
- 1.3. Other Products
-
2. Application
- 2.1. Vaccines and Therapeutics
- 2.2. Cellular and Gene Therapy
- 2.3. Blood and Blood-based Therapy
- 2.4. Other Applications
-
3. Test
- 3.1. Sterility Tests
- 3.2. Bioburden Tests
- 3.3. Endotoxin Tests
- 3.4. Other Tests
Biosafety Testing Services Industry Segmentation By Geography
-
1. North America
- 1.1. United States
- 1.2. Canada
- 1.3. Mexico
-
2. Europe
- 2.1. Germany
- 2.2. United Kingdom
- 2.3. France
- 2.4. Italy
- 2.5. Spain
- 2.6. Rest of Europe
-
3. Asia Pacific
- 3.1. China
- 3.2. Japan
- 3.3. India
- 3.4. Australia
- 3.5. South Korea
- 3.6. Rest of Asia Pacific
-
4. Middle East and Africa
- 4.1. GCC
- 4.2. South Africa
- 4.3. Rest of Middle East and Africa
-
5. South America
- 5.1. Brazil
- 5.2. Argentina
- 5.3. Rest of South America
Biosafety Testing Services Industry Regional Market Share
Geographic Coverage of Biosafety Testing Services Industry
Biosafety Testing Services Industry REPORT HIGHLIGHTS
| Aspects | Details |
|---|---|
| Study Period | 2020-2034 |
| Base Year | 2025 |
| Estimated Year | 2026 |
| Forecast Period | 2026-2034 |
| Historical Period | 2020-2025 |
| Growth Rate | CAGR of 10.69% from 2020-2034 |
| Segmentation |
|
Table of Contents
- 1. Introduction
- 1.1. Research Scope
- 1.2. Market Segmentation
- 1.3. Research Objective
- 1.4. Definitions and Assumptions
- 2. Executive Summary
- 2.1. Market Snapshot
- 3. Market Dynamics
- 3.1. Market Drivers
- 3.2. Market Restrains
- 3.3. Market Trends
- 3.4. Market Opportunities
- 4. Market Factor Analysis
- 4.1. Porters Five Forces
- 4.1.1. Bargaining Power of Suppliers
- 4.1.2. Bargaining Power of Buyers
- 4.1.3. Threat of New Entrants
- 4.1.4. Threat of Substitutes
- 4.1.5. Competitive Rivalry
- 4.2. PESTEL analysis
- 4.3. BCG Analysis
- 4.3.1. Stars (High Growth, High Market Share)
- 4.3.2. Cash Cows (Low Growth, High Market Share)
- 4.3.3. Question Mark (High Growth, Low Market Share)
- 4.3.4. Dogs (Low Growth, Low Market Share)
- 4.4. Ansoff Matrix Analysis
- 4.5. Supply Chain Analysis
- 4.6. Regulatory Landscape
- 4.7. Current Market Potential and Opportunity Assessment (TAM–SAM–SOM Framework)
- 4.8. NRP Analyst Note
- 4.1. Porters Five Forces
- 5. Market Analysis, Insights and Forecast 2021-2033
- 5.1. Market Analysis, Insights and Forecast - by Product
- 5.1.1. Reagents and Kits
- 5.1.2. Instruments
- 5.1.3. Other Products
- 5.2. Market Analysis, Insights and Forecast - by Application
- 5.2.1. Vaccines and Therapeutics
- 5.2.2. Cellular and Gene Therapy
- 5.2.3. Blood and Blood-based Therapy
- 5.2.4. Other Applications
- 5.3. Market Analysis, Insights and Forecast - by Test
- 5.3.1. Sterility Tests
- 5.3.2. Bioburden Tests
- 5.3.3. Endotoxin Tests
- 5.3.4. Other Tests
- 5.4. Market Analysis, Insights and Forecast - by Region
- 5.4.1. North America
- 5.4.2. Europe
- 5.4.3. Asia Pacific
- 5.4.4. Middle East and Africa
- 5.4.5. South America
- 5.1. Market Analysis, Insights and Forecast - by Product
- 6. Global Biosafety Testing Services Industry Analysis, Insights and Forecast, 2021-2033
- 6.1. Market Analysis, Insights and Forecast - by Product
- 6.1.1. Reagents and Kits
- 6.1.2. Instruments
- 6.1.3. Other Products
- 6.2. Market Analysis, Insights and Forecast - by Application
- 6.2.1. Vaccines and Therapeutics
- 6.2.2. Cellular and Gene Therapy
- 6.2.3. Blood and Blood-based Therapy
- 6.2.4. Other Applications
- 6.3. Market Analysis, Insights and Forecast - by Test
- 6.3.1. Sterility Tests
- 6.3.2. Bioburden Tests
- 6.3.3. Endotoxin Tests
- 6.3.4. Other Tests
- 6.1. Market Analysis, Insights and Forecast - by Product
- 7. North America Biosafety Testing Services Industry Analysis, Insights and Forecast, 2020-2032
- 7.1. Market Analysis, Insights and Forecast - by Product
- 7.1.1. Reagents and Kits
- 7.1.2. Instruments
- 7.1.3. Other Products
- 7.2. Market Analysis, Insights and Forecast - by Application
- 7.2.1. Vaccines and Therapeutics
- 7.2.2. Cellular and Gene Therapy
- 7.2.3. Blood and Blood-based Therapy
- 7.2.4. Other Applications
- 7.3. Market Analysis, Insights and Forecast - by Test
- 7.3.1. Sterility Tests
- 7.3.2. Bioburden Tests
- 7.3.3. Endotoxin Tests
- 7.3.4. Other Tests
- 7.1. Market Analysis, Insights and Forecast - by Product
- 8. Europe Biosafety Testing Services Industry Analysis, Insights and Forecast, 2020-2032
- 8.1. Market Analysis, Insights and Forecast - by Product
- 8.1.1. Reagents and Kits
- 8.1.2. Instruments
- 8.1.3. Other Products
- 8.2. Market Analysis, Insights and Forecast - by Application
- 8.2.1. Vaccines and Therapeutics
- 8.2.2. Cellular and Gene Therapy
- 8.2.3. Blood and Blood-based Therapy
- 8.2.4. Other Applications
- 8.3. Market Analysis, Insights and Forecast - by Test
- 8.3.1. Sterility Tests
- 8.3.2. Bioburden Tests
- 8.3.3. Endotoxin Tests
- 8.3.4. Other Tests
- 8.1. Market Analysis, Insights and Forecast - by Product
- 9. Asia Pacific Biosafety Testing Services Industry Analysis, Insights and Forecast, 2020-2032
- 9.1. Market Analysis, Insights and Forecast - by Product
- 9.1.1. Reagents and Kits
- 9.1.2. Instruments
- 9.1.3. Other Products
- 9.2. Market Analysis, Insights and Forecast - by Application
- 9.2.1. Vaccines and Therapeutics
- 9.2.2. Cellular and Gene Therapy
- 9.2.3. Blood and Blood-based Therapy
- 9.2.4. Other Applications
- 9.3. Market Analysis, Insights and Forecast - by Test
- 9.3.1. Sterility Tests
- 9.3.2. Bioburden Tests
- 9.3.3. Endotoxin Tests
- 9.3.4. Other Tests
- 9.1. Market Analysis, Insights and Forecast - by Product
- 10. Middle East and Africa Biosafety Testing Services Industry Analysis, Insights and Forecast, 2020-2032
- 10.1. Market Analysis, Insights and Forecast - by Product
- 10.1.1. Reagents and Kits
- 10.1.2. Instruments
- 10.1.3. Other Products
- 10.2. Market Analysis, Insights and Forecast - by Application
- 10.2.1. Vaccines and Therapeutics
- 10.2.2. Cellular and Gene Therapy
- 10.2.3. Blood and Blood-based Therapy
- 10.2.4. Other Applications
- 10.3. Market Analysis, Insights and Forecast - by Test
- 10.3.1. Sterility Tests
- 10.3.2. Bioburden Tests
- 10.3.3. Endotoxin Tests
- 10.3.4. Other Tests
- 10.1. Market Analysis, Insights and Forecast - by Product
- 11. South America Biosafety Testing Services Industry Analysis, Insights and Forecast, 2020-2032
- 11.1. Market Analysis, Insights and Forecast - by Product
- 11.1.1. Reagents and Kits
- 11.1.2. Instruments
- 11.1.3. Other Products
- 11.2. Market Analysis, Insights and Forecast - by Application
- 11.2.1. Vaccines and Therapeutics
- 11.2.2. Cellular and Gene Therapy
- 11.2.3. Blood and Blood-based Therapy
- 11.2.4. Other Applications
- 11.3. Market Analysis, Insights and Forecast - by Test
- 11.3.1. Sterility Tests
- 11.3.2. Bioburden Tests
- 11.3.3. Endotoxin Tests
- 11.3.4. Other Tests
- 11.1. Market Analysis, Insights and Forecast - by Product
- 12. Competitive Analysis
- 12.1. Company Profiles
- 12.1.1 Promega Corporation
- 12.1.1.1. Company Overview
- 12.1.1.2. Products
- 12.1.1.3. Company Financials
- 12.1.1.4. SWOT Analysis
- 12.1.2 Merck KGaA
- 12.1.2.1. Company Overview
- 12.1.2.2. Products
- 12.1.2.3. Company Financials
- 12.1.2.4. SWOT Analysis
- 12.1.3 Toxikon
- 12.1.3.1. Company Overview
- 12.1.3.2. Products
- 12.1.3.3. Company Financials
- 12.1.3.4. SWOT Analysis
- 12.1.4 Eurofins Scientific
- 12.1.4.1. Company Overview
- 12.1.4.2. Products
- 12.1.4.3. Company Financials
- 12.1.4.4. SWOT Analysis
- 12.1.5 Biomerieux SA
- 12.1.5.1. Company Overview
- 12.1.5.2. Products
- 12.1.5.3. Company Financials
- 12.1.5.4. SWOT Analysis
- 12.1.6 Cytovance Biologics
- 12.1.6.1. Company Overview
- 12.1.6.2. Products
- 12.1.6.3. Company Financials
- 12.1.6.4. SWOT Analysis
- 12.1.7 WuXi AppTec
- 12.1.7.1. Company Overview
- 12.1.7.2. Products
- 12.1.7.3. Company Financials
- 12.1.7.4. SWOT Analysis
- 12.1.8 Lonza
- 12.1.8.1. Company Overview
- 12.1.8.2. Products
- 12.1.8.3. Company Financials
- 12.1.8.4. SWOT Analysis
- 12.1.9 Avance Biosciences
- 12.1.9.1. Company Overview
- 12.1.9.2. Products
- 12.1.9.3. Company Financials
- 12.1.9.4. SWOT Analysis
- 12.1.10 Thermo Fisher Scientific
- 12.1.10.1. Company Overview
- 12.1.10.2. Products
- 12.1.10.3. Company Financials
- 12.1.10.4. SWOT Analysis
- 12.1.1 Promega Corporation
- 12.2. Market Entropy
- 12.2.1 Company's Key Areas Served
- 12.2.2 Recent Developments
- 12.3. Company Market Share Analysis 2025
- 12.3.1 Top 5 Companies Market Share Analysis
- 12.3.2 Top 3 Companies Market Share Analysis
- 12.4. List of Potential Customers
- 13. Research Methodology
List of Figures
- Figure 1: Global Biosafety Testing Services Industry Revenue Breakdown (billion, %) by Region 2025 & 2033
- Figure 2: Global Biosafety Testing Services Industry Volume Breakdown (K Unit, %) by Region 2025 & 2033
- Figure 3: North America Biosafety Testing Services Industry Revenue (billion), by Product 2025 & 2033
- Figure 4: North America Biosafety Testing Services Industry Volume (K Unit), by Product 2025 & 2033
- Figure 5: North America Biosafety Testing Services Industry Revenue Share (%), by Product 2025 & 2033
- Figure 6: North America Biosafety Testing Services Industry Volume Share (%), by Product 2025 & 2033
- Figure 7: North America Biosafety Testing Services Industry Revenue (billion), by Application 2025 & 2033
- Figure 8: North America Biosafety Testing Services Industry Volume (K Unit), by Application 2025 & 2033
- Figure 9: North America Biosafety Testing Services Industry Revenue Share (%), by Application 2025 & 2033
- Figure 10: North America Biosafety Testing Services Industry Volume Share (%), by Application 2025 & 2033
- Figure 11: North America Biosafety Testing Services Industry Revenue (billion), by Test 2025 & 2033
- Figure 12: North America Biosafety Testing Services Industry Volume (K Unit), by Test 2025 & 2033
- Figure 13: North America Biosafety Testing Services Industry Revenue Share (%), by Test 2025 & 2033
- Figure 14: North America Biosafety Testing Services Industry Volume Share (%), by Test 2025 & 2033
- Figure 15: North America Biosafety Testing Services Industry Revenue (billion), by Country 2025 & 2033
- Figure 16: North America Biosafety Testing Services Industry Volume (K Unit), by Country 2025 & 2033
- Figure 17: North America Biosafety Testing Services Industry Revenue Share (%), by Country 2025 & 2033
- Figure 18: North America Biosafety Testing Services Industry Volume Share (%), by Country 2025 & 2033
- Figure 19: Europe Biosafety Testing Services Industry Revenue (billion), by Product 2025 & 2033
- Figure 20: Europe Biosafety Testing Services Industry Volume (K Unit), by Product 2025 & 2033
- Figure 21: Europe Biosafety Testing Services Industry Revenue Share (%), by Product 2025 & 2033
- Figure 22: Europe Biosafety Testing Services Industry Volume Share (%), by Product 2025 & 2033
- Figure 23: Europe Biosafety Testing Services Industry Revenue (billion), by Application 2025 & 2033
- Figure 24: Europe Biosafety Testing Services Industry Volume (K Unit), by Application 2025 & 2033
- Figure 25: Europe Biosafety Testing Services Industry Revenue Share (%), by Application 2025 & 2033
- Figure 26: Europe Biosafety Testing Services Industry Volume Share (%), by Application 2025 & 2033
- Figure 27: Europe Biosafety Testing Services Industry Revenue (billion), by Test 2025 & 2033
- Figure 28: Europe Biosafety Testing Services Industry Volume (K Unit), by Test 2025 & 2033
- Figure 29: Europe Biosafety Testing Services Industry Revenue Share (%), by Test 2025 & 2033
- Figure 30: Europe Biosafety Testing Services Industry Volume Share (%), by Test 2025 & 2033
- Figure 31: Europe Biosafety Testing Services Industry Revenue (billion), by Country 2025 & 2033
- Figure 32: Europe Biosafety Testing Services Industry Volume (K Unit), by Country 2025 & 2033
- Figure 33: Europe Biosafety Testing Services Industry Revenue Share (%), by Country 2025 & 2033
- Figure 34: Europe Biosafety Testing Services Industry Volume Share (%), by Country 2025 & 2033
- Figure 35: Asia Pacific Biosafety Testing Services Industry Revenue (billion), by Product 2025 & 2033
- Figure 36: Asia Pacific Biosafety Testing Services Industry Volume (K Unit), by Product 2025 & 2033
- Figure 37: Asia Pacific Biosafety Testing Services Industry Revenue Share (%), by Product 2025 & 2033
- Figure 38: Asia Pacific Biosafety Testing Services Industry Volume Share (%), by Product 2025 & 2033
- Figure 39: Asia Pacific Biosafety Testing Services Industry Revenue (billion), by Application 2025 & 2033
- Figure 40: Asia Pacific Biosafety Testing Services Industry Volume (K Unit), by Application 2025 & 2033
- Figure 41: Asia Pacific Biosafety Testing Services Industry Revenue Share (%), by Application 2025 & 2033
- Figure 42: Asia Pacific Biosafety Testing Services Industry Volume Share (%), by Application 2025 & 2033
- Figure 43: Asia Pacific Biosafety Testing Services Industry Revenue (billion), by Test 2025 & 2033
- Figure 44: Asia Pacific Biosafety Testing Services Industry Volume (K Unit), by Test 2025 & 2033
- Figure 45: Asia Pacific Biosafety Testing Services Industry Revenue Share (%), by Test 2025 & 2033
- Figure 46: Asia Pacific Biosafety Testing Services Industry Volume Share (%), by Test 2025 & 2033
- Figure 47: Asia Pacific Biosafety Testing Services Industry Revenue (billion), by Country 2025 & 2033
- Figure 48: Asia Pacific Biosafety Testing Services Industry Volume (K Unit), by Country 2025 & 2033
- Figure 49: Asia Pacific Biosafety Testing Services Industry Revenue Share (%), by Country 2025 & 2033
- Figure 50: Asia Pacific Biosafety Testing Services Industry Volume Share (%), by Country 2025 & 2033
- Figure 51: Middle East and Africa Biosafety Testing Services Industry Revenue (billion), by Product 2025 & 2033
- Figure 52: Middle East and Africa Biosafety Testing Services Industry Volume (K Unit), by Product 2025 & 2033
- Figure 53: Middle East and Africa Biosafety Testing Services Industry Revenue Share (%), by Product 2025 & 2033
- Figure 54: Middle East and Africa Biosafety Testing Services Industry Volume Share (%), by Product 2025 & 2033
- Figure 55: Middle East and Africa Biosafety Testing Services Industry Revenue (billion), by Application 2025 & 2033
- Figure 56: Middle East and Africa Biosafety Testing Services Industry Volume (K Unit), by Application 2025 & 2033
- Figure 57: Middle East and Africa Biosafety Testing Services Industry Revenue Share (%), by Application 2025 & 2033
- Figure 58: Middle East and Africa Biosafety Testing Services Industry Volume Share (%), by Application 2025 & 2033
- Figure 59: Middle East and Africa Biosafety Testing Services Industry Revenue (billion), by Test 2025 & 2033
- Figure 60: Middle East and Africa Biosafety Testing Services Industry Volume (K Unit), by Test 2025 & 2033
- Figure 61: Middle East and Africa Biosafety Testing Services Industry Revenue Share (%), by Test 2025 & 2033
- Figure 62: Middle East and Africa Biosafety Testing Services Industry Volume Share (%), by Test 2025 & 2033
- Figure 63: Middle East and Africa Biosafety Testing Services Industry Revenue (billion), by Country 2025 & 2033
- Figure 64: Middle East and Africa Biosafety Testing Services Industry Volume (K Unit), by Country 2025 & 2033
- Figure 65: Middle East and Africa Biosafety Testing Services Industry Revenue Share (%), by Country 2025 & 2033
- Figure 66: Middle East and Africa Biosafety Testing Services Industry Volume Share (%), by Country 2025 & 2033
- Figure 67: South America Biosafety Testing Services Industry Revenue (billion), by Product 2025 & 2033
- Figure 68: South America Biosafety Testing Services Industry Volume (K Unit), by Product 2025 & 2033
- Figure 69: South America Biosafety Testing Services Industry Revenue Share (%), by Product 2025 & 2033
- Figure 70: South America Biosafety Testing Services Industry Volume Share (%), by Product 2025 & 2033
- Figure 71: South America Biosafety Testing Services Industry Revenue (billion), by Application 2025 & 2033
- Figure 72: South America Biosafety Testing Services Industry Volume (K Unit), by Application 2025 & 2033
- Figure 73: South America Biosafety Testing Services Industry Revenue Share (%), by Application 2025 & 2033
- Figure 74: South America Biosafety Testing Services Industry Volume Share (%), by Application 2025 & 2033
- Figure 75: South America Biosafety Testing Services Industry Revenue (billion), by Test 2025 & 2033
- Figure 76: South America Biosafety Testing Services Industry Volume (K Unit), by Test 2025 & 2033
- Figure 77: South America Biosafety Testing Services Industry Revenue Share (%), by Test 2025 & 2033
- Figure 78: South America Biosafety Testing Services Industry Volume Share (%), by Test 2025 & 2033
- Figure 79: South America Biosafety Testing Services Industry Revenue (billion), by Country 2025 & 2033
- Figure 80: South America Biosafety Testing Services Industry Volume (K Unit), by Country 2025 & 2033
- Figure 81: South America Biosafety Testing Services Industry Revenue Share (%), by Country 2025 & 2033
- Figure 82: South America Biosafety Testing Services Industry Volume Share (%), by Country 2025 & 2033
List of Tables
- Table 1: Global Biosafety Testing Services Industry Revenue billion Forecast, by Product 2020 & 2033
- Table 2: Global Biosafety Testing Services Industry Volume K Unit Forecast, by Product 2020 & 2033
- Table 3: Global Biosafety Testing Services Industry Revenue billion Forecast, by Application 2020 & 2033
- Table 4: Global Biosafety Testing Services Industry Volume K Unit Forecast, by Application 2020 & 2033
- Table 5: Global Biosafety Testing Services Industry Revenue billion Forecast, by Test 2020 & 2033
- Table 6: Global Biosafety Testing Services Industry Volume K Unit Forecast, by Test 2020 & 2033
- Table 7: Global Biosafety Testing Services Industry Revenue billion Forecast, by Region 2020 & 2033
- Table 8: Global Biosafety Testing Services Industry Volume K Unit Forecast, by Region 2020 & 2033
- Table 9: Global Biosafety Testing Services Industry Revenue billion Forecast, by Product 2020 & 2033
- Table 10: Global Biosafety Testing Services Industry Volume K Unit Forecast, by Product 2020 & 2033
- Table 11: Global Biosafety Testing Services Industry Revenue billion Forecast, by Application 2020 & 2033
- Table 12: Global Biosafety Testing Services Industry Volume K Unit Forecast, by Application 2020 & 2033
- Table 13: Global Biosafety Testing Services Industry Revenue billion Forecast, by Test 2020 & 2033
- Table 14: Global Biosafety Testing Services Industry Volume K Unit Forecast, by Test 2020 & 2033
- Table 15: Global Biosafety Testing Services Industry Revenue billion Forecast, by Country 2020 & 2033
- Table 16: Global Biosafety Testing Services Industry Volume K Unit Forecast, by Country 2020 & 2033
- Table 17: United States Biosafety Testing Services Industry Revenue (billion) Forecast, by Application 2020 & 2033
- Table 18: United States Biosafety Testing Services Industry Volume (K Unit) Forecast, by Application 2020 & 2033
- Table 19: Canada Biosafety Testing Services Industry Revenue (billion) Forecast, by Application 2020 & 2033
- Table 20: Canada Biosafety Testing Services Industry Volume (K Unit) Forecast, by Application 2020 & 2033
- Table 21: Mexico Biosafety Testing Services Industry Revenue (billion) Forecast, by Application 2020 & 2033
- Table 22: Mexico Biosafety Testing Services Industry Volume (K Unit) Forecast, by Application 2020 & 2033
- Table 23: Global Biosafety Testing Services Industry Revenue billion Forecast, by Product 2020 & 2033
- Table 24: Global Biosafety Testing Services Industry Volume K Unit Forecast, by Product 2020 & 2033
- Table 25: Global Biosafety Testing Services Industry Revenue billion Forecast, by Application 2020 & 2033
- Table 26: Global Biosafety Testing Services Industry Volume K Unit Forecast, by Application 2020 & 2033
- Table 27: Global Biosafety Testing Services Industry Revenue billion Forecast, by Test 2020 & 2033
- Table 28: Global Biosafety Testing Services Industry Volume K Unit Forecast, by Test 2020 & 2033
- Table 29: Global Biosafety Testing Services Industry Revenue billion Forecast, by Country 2020 & 2033
- Table 30: Global Biosafety Testing Services Industry Volume K Unit Forecast, by Country 2020 & 2033
- Table 31: Germany Biosafety Testing Services Industry Revenue (billion) Forecast, by Application 2020 & 2033
- Table 32: Germany Biosafety Testing Services Industry Volume (K Unit) Forecast, by Application 2020 & 2033
- Table 33: United Kingdom Biosafety Testing Services Industry Revenue (billion) Forecast, by Application 2020 & 2033
- Table 34: United Kingdom Biosafety Testing Services Industry Volume (K Unit) Forecast, by Application 2020 & 2033
- Table 35: France Biosafety Testing Services Industry Revenue (billion) Forecast, by Application 2020 & 2033
- Table 36: France Biosafety Testing Services Industry Volume (K Unit) Forecast, by Application 2020 & 2033
- Table 37: Italy Biosafety Testing Services Industry Revenue (billion) Forecast, by Application 2020 & 2033
- Table 38: Italy Biosafety Testing Services Industry Volume (K Unit) Forecast, by Application 2020 & 2033
- Table 39: Spain Biosafety Testing Services Industry Revenue (billion) Forecast, by Application 2020 & 2033
- Table 40: Spain Biosafety Testing Services Industry Volume (K Unit) Forecast, by Application 2020 & 2033
- Table 41: Rest of Europe Biosafety Testing Services Industry Revenue (billion) Forecast, by Application 2020 & 2033
- Table 42: Rest of Europe Biosafety Testing Services Industry Volume (K Unit) Forecast, by Application 2020 & 2033
- Table 43: Global Biosafety Testing Services Industry Revenue billion Forecast, by Product 2020 & 2033
- Table 44: Global Biosafety Testing Services Industry Volume K Unit Forecast, by Product 2020 & 2033
- Table 45: Global Biosafety Testing Services Industry Revenue billion Forecast, by Application 2020 & 2033
- Table 46: Global Biosafety Testing Services Industry Volume K Unit Forecast, by Application 2020 & 2033
- Table 47: Global Biosafety Testing Services Industry Revenue billion Forecast, by Test 2020 & 2033
- Table 48: Global Biosafety Testing Services Industry Volume K Unit Forecast, by Test 2020 & 2033
- Table 49: Global Biosafety Testing Services Industry Revenue billion Forecast, by Country 2020 & 2033
- Table 50: Global Biosafety Testing Services Industry Volume K Unit Forecast, by Country 2020 & 2033
- Table 51: China Biosafety Testing Services Industry Revenue (billion) Forecast, by Application 2020 & 2033
- Table 52: China Biosafety Testing Services Industry Volume (K Unit) Forecast, by Application 2020 & 2033
- Table 53: Japan Biosafety Testing Services Industry Revenue (billion) Forecast, by Application 2020 & 2033
- Table 54: Japan Biosafety Testing Services Industry Volume (K Unit) Forecast, by Application 2020 & 2033
- Table 55: India Biosafety Testing Services Industry Revenue (billion) Forecast, by Application 2020 & 2033
- Table 56: India Biosafety Testing Services Industry Volume (K Unit) Forecast, by Application 2020 & 2033
- Table 57: Australia Biosafety Testing Services Industry Revenue (billion) Forecast, by Application 2020 & 2033
- Table 58: Australia Biosafety Testing Services Industry Volume (K Unit) Forecast, by Application 2020 & 2033
- Table 59: South Korea Biosafety Testing Services Industry Revenue (billion) Forecast, by Application 2020 & 2033
- Table 60: South Korea Biosafety Testing Services Industry Volume (K Unit) Forecast, by Application 2020 & 2033
- Table 61: Rest of Asia Pacific Biosafety Testing Services Industry Revenue (billion) Forecast, by Application 2020 & 2033
- Table 62: Rest of Asia Pacific Biosafety Testing Services Industry Volume (K Unit) Forecast, by Application 2020 & 2033
- Table 63: Global Biosafety Testing Services Industry Revenue billion Forecast, by Product 2020 & 2033
- Table 64: Global Biosafety Testing Services Industry Volume K Unit Forecast, by Product 2020 & 2033
- Table 65: Global Biosafety Testing Services Industry Revenue billion Forecast, by Application 2020 & 2033
- Table 66: Global Biosafety Testing Services Industry Volume K Unit Forecast, by Application 2020 & 2033
- Table 67: Global Biosafety Testing Services Industry Revenue billion Forecast, by Test 2020 & 2033
- Table 68: Global Biosafety Testing Services Industry Volume K Unit Forecast, by Test 2020 & 2033
- Table 69: Global Biosafety Testing Services Industry Revenue billion Forecast, by Country 2020 & 2033
- Table 70: Global Biosafety Testing Services Industry Volume K Unit Forecast, by Country 2020 & 2033
- Table 71: GCC Biosafety Testing Services Industry Revenue (billion) Forecast, by Application 2020 & 2033
- Table 72: GCC Biosafety Testing Services Industry Volume (K Unit) Forecast, by Application 2020 & 2033
- Table 73: South Africa Biosafety Testing Services Industry Revenue (billion) Forecast, by Application 2020 & 2033
- Table 74: South Africa Biosafety Testing Services Industry Volume (K Unit) Forecast, by Application 2020 & 2033
- Table 75: Rest of Middle East and Africa Biosafety Testing Services Industry Revenue (billion) Forecast, by Application 2020 & 2033
- Table 76: Rest of Middle East and Africa Biosafety Testing Services Industry Volume (K Unit) Forecast, by Application 2020 & 2033
- Table 77: Global Biosafety Testing Services Industry Revenue billion Forecast, by Product 2020 & 2033
- Table 78: Global Biosafety Testing Services Industry Volume K Unit Forecast, by Product 2020 & 2033
- Table 79: Global Biosafety Testing Services Industry Revenue billion Forecast, by Application 2020 & 2033
- Table 80: Global Biosafety Testing Services Industry Volume K Unit Forecast, by Application 2020 & 2033
- Table 81: Global Biosafety Testing Services Industry Revenue billion Forecast, by Test 2020 & 2033
- Table 82: Global Biosafety Testing Services Industry Volume K Unit Forecast, by Test 2020 & 2033
- Table 83: Global Biosafety Testing Services Industry Revenue billion Forecast, by Country 2020 & 2033
- Table 84: Global Biosafety Testing Services Industry Volume K Unit Forecast, by Country 2020 & 2033
- Table 85: Brazil Biosafety Testing Services Industry Revenue (billion) Forecast, by Application 2020 & 2033
- Table 86: Brazil Biosafety Testing Services Industry Volume (K Unit) Forecast, by Application 2020 & 2033
- Table 87: Argentina Biosafety Testing Services Industry Revenue (billion) Forecast, by Application 2020 & 2033
- Table 88: Argentina Biosafety Testing Services Industry Volume (K Unit) Forecast, by Application 2020 & 2033
- Table 89: Rest of South America Biosafety Testing Services Industry Revenue (billion) Forecast, by Application 2020 & 2033
- Table 90: Rest of South America Biosafety Testing Services Industry Volume (K Unit) Forecast, by Application 2020 & 2033
Frequently Asked Questions
1. What is the projected Compound Annual Growth Rate (CAGR) of the Biosafety Testing Services Industry?
The projected CAGR is approximately 10.69%.
2. Which companies are prominent players in the Biosafety Testing Services Industry?
Key companies in the market include Promega Corporation, Merck KGaA, Toxikon, Eurofins Scientific, Biomerieux SA, Cytovance Biologics, WuXi AppTec, Lonza, Avance Biosciences, Thermo Fisher Scientific.
3. What are the main segments of the Biosafety Testing Services Industry?
The market segments include Product, Application, Test.
4. Can you provide details about the market size?
The market size is estimated to be USD 5.38 billion as of 2022.
5. What are some drivers contributing to market growth?
Growth in the Pharmaceutical and Biotechnology Industries. along with Increasing Investments; Rising Production of New Biologics due to High Disease Burden.
6. What are the notable trends driving market growth?
Bioburden Testing Segment is Expected to Hold Significant Share in the Test Segment of the Market Over the Forecast Period.
7. Are there any restraints impacting market growth?
Time Consuming Approval Process.
8. Can you provide examples of recent developments in the market?
In April 2021, Lonza expanded its product ''PyroTec PRO Automated Robotic Solution'' for endotoxin testing. It is compatible with the company's product PYROGENT-5000 Turbidimetric LAL (Limulus Amebocyte Lysate) Assay, Kinetic-QCL Chromogenic LAL Assay, and the PyroGene rFC Assay.
9. What pricing options are available for accessing the report?
Pricing options include single-user, multi-user, and enterprise licenses priced at USD 4750, USD 5250, and USD 8750 respectively.
10. Is the market size provided in terms of value or volume?
The market size is provided in terms of value, measured in billion and volume, measured in K Unit.
11. Are there any specific market keywords associated with the report?
Yes, the market keyword associated with the report is "Biosafety Testing Services Industry," which aids in identifying and referencing the specific market segment covered.
12. How do I determine which pricing option suits my needs best?
The pricing options vary based on user requirements and access needs. Individual users may opt for single-user licenses, while businesses requiring broader access may choose multi-user or enterprise licenses for cost-effective access to the report.
13. Are there any additional resources or data provided in the Biosafety Testing Services Industry report?
While the report offers comprehensive insights, it's advisable to review the specific contents or supplementary materials provided to ascertain if additional resources or data are available.
14. How can I stay updated on further developments or reports in the Biosafety Testing Services Industry?
To stay informed about further developments, trends, and reports in the Biosafety Testing Services Industry, consider subscribing to industry newsletters, following relevant companies and organizations, or regularly checking reputable industry news sources and publications.
Methodology
Step 1 - Identification of Relevant Samples Size from Population Database


Step 2 - Approaches for Defining Global Market Size (Value, Volume* & Price*)

Note*: In applicable scenarios
Step 3 - Data Sources
Primary Research
- Web Analytics
- Survey Reports
- Research Institute
- Latest Research Reports
- Opinion Leaders
Secondary Research
- Annual Reports
- White Paper
- Latest Press Release
- Industry Association
- Paid Database
- Investor Presentations

Step 4 - Data Triangulation
Involves using different sources of information in order to increase the validity of a study
These sources are likely to be stakeholders in a program - participants, other researchers, program staff, other community members, and so on.
Then we put all data in single framework & apply various statistical tools to find out the dynamic on the market.
During the analysis stage, feedback from the stakeholder groups would be compared to determine areas of agreement as well as areas of divergence