

Key Insights
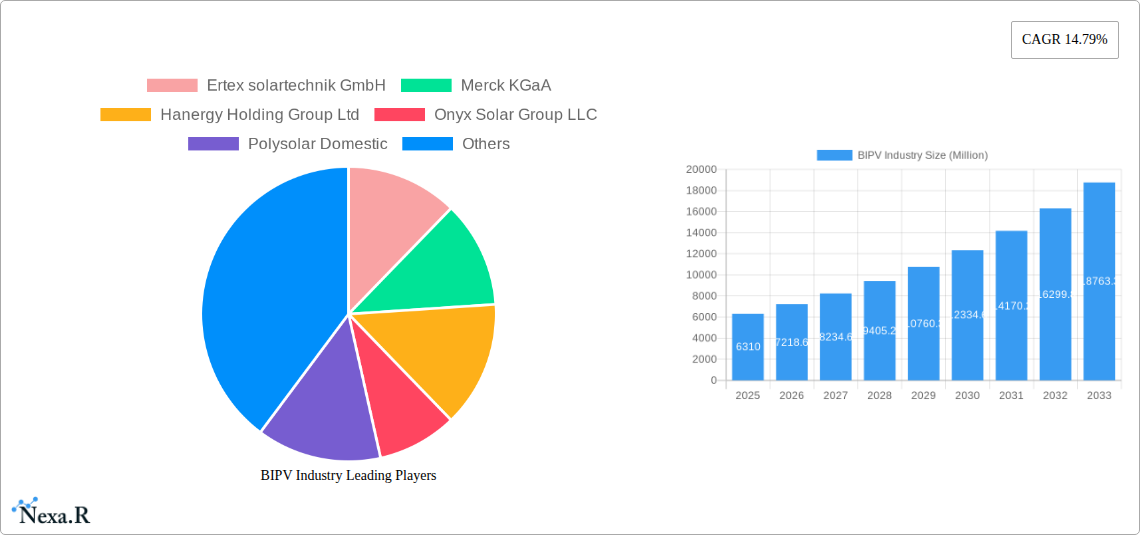
The Building-Integrated Photovoltaics (BIPV) industry is experiencing robust growth, projected to reach a market size of $6.31 billion in 2025 and maintain a Compound Annual Growth Rate (CAGR) of 14.79% from 2025 to 2033. This expansion is driven by several key factors. Increasing concerns about climate change and the urgent need for sustainable energy solutions are fueling demand for renewable energy sources like solar power. Government incentives and policies promoting renewable energy adoption, along with advancements in BIPV technology leading to improved aesthetics and efficiency, are further propelling market growth. The residential sector currently dominates the BIPV market, driven by rising energy costs and homeowner interest in reducing their carbon footprint. However, the commercial and industrial sectors are poised for significant growth, as businesses increasingly integrate sustainability into their operations and seek to reduce energy expenses. Thin-film PV technology holds a significant market share, offering flexibility and design advantages, while crystalline PV remains a dominant player due to its established technology and higher efficiency. Geographic growth is largely concentrated in regions with supportive government policies and high solar irradiance, such as North America, Europe, and Asia-Pacific.
Competition within the BIPV market is intensifying, with both established players and emerging companies vying for market share. Key players like Ertex Solartechnik GmbH, Merck KGaA, and Hanergy Holding Group Ltd. are focusing on innovation, strategic partnerships, and geographic expansion to maintain their competitive edge. Challenges remain, however. High initial installation costs compared to traditional building materials can hinder wider adoption. Furthermore, the need for specialized installation expertise and potential aesthetic limitations in certain building designs could pose obstacles. Nevertheless, ongoing technological advancements, declining manufacturing costs, and increasing consumer awareness are expected to mitigate these challenges, ensuring continued growth for the BIPV industry throughout the forecast period. The increasing demand for energy-efficient buildings, coupled with the growing emphasis on sustainable construction practices, will further bolster BIPV adoption across various sectors and regions.
BIPV Industry Market Report: 2019-2033
This comprehensive report provides an in-depth analysis of the Building-Integrated Photovoltaics (BIPV) industry, encompassing market dynamics, growth trends, key players, and future prospects. With a study period spanning 2019-2033, a base year of 2025, and an estimated year of 2025, this report offers valuable insights for industry professionals, investors, and stakeholders seeking to navigate this rapidly evolving sector. The report covers both parent and child markets, including Thin Film PV and Crystalline PV types, as well as Residential and Commercial & Industrial end-users. The global BIPV market is projected to reach xx Million units by 2033.
BIPV Industry Market Dynamics & Structure
The BIPV market is characterized by moderate concentration, with key players like Ertex solartechnik GmbH, Merck KGaA, and Hanergy Holding Group Ltd vying for market share. Technological innovation, particularly in thin-film and crystalline PV technologies, is a major driver, alongside supportive government regulations promoting renewable energy adoption. Competitive substitutes include traditional roofing materials and conventional solar panel installations. End-user demographics show a growing preference for aesthetically integrated solutions, especially in the residential and commercial sectors. Mergers and acquisitions (M&A) activity is steadily increasing, reflecting consolidation and expansion strategies among key players.
- Market Concentration: Moderately concentrated, with the top 5 players holding approximately xx% of the market share in 2024.
- Technological Innovation: Focus on improving efficiency, aesthetics, and durability of BIPV modules.
- Regulatory Framework: Government incentives and building codes influence adoption rates significantly.
- Competitive Substitutes: Traditional roofing and standalone solar panels pose competitive challenges.
- End-User Demographics: Residential and commercial sectors are key end-user segments, with growing demand from the industrial sector.
- M&A Activity: XX M&A deals were recorded between 2019 and 2024, indicating a growing trend of consolidation.
BIPV Industry Growth Trends & Insights
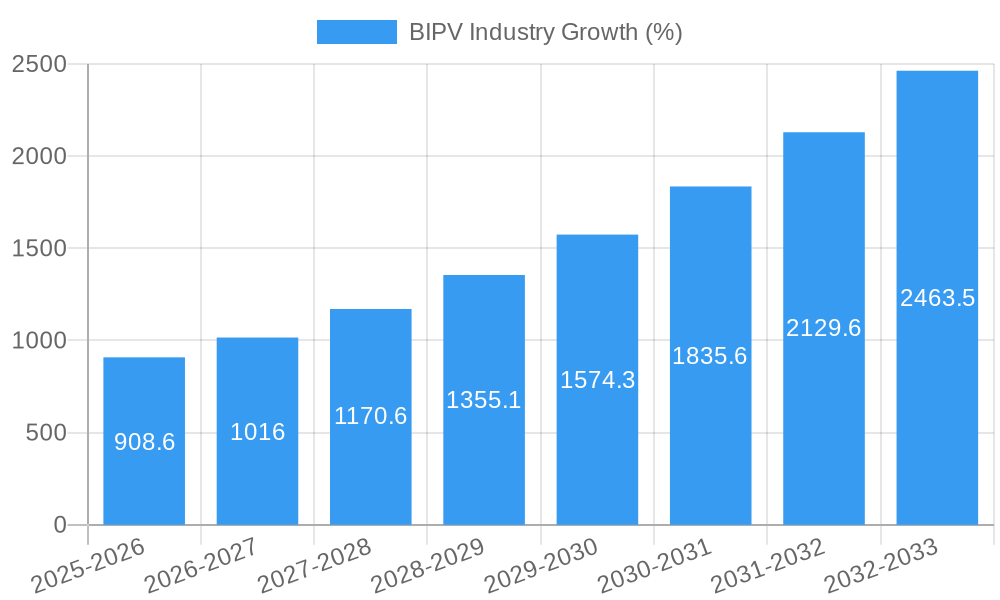
The BIPV market is experiencing robust growth, driven by increasing demand for sustainable building solutions and government initiatives promoting renewable energy integration. Technological advancements, such as the development of more efficient and aesthetically pleasing BIPV modules, are further accelerating market expansion. Consumer behavior shifts towards eco-friendly building practices and energy independence are also contributing to market growth. The global BIPV market is expected to register a CAGR of xx% during the forecast period (2025-2033), with market penetration expected to reach xx% by 2033. The increased adoption of BIPV in new constructions and renovations will be a key driver of this growth.
Dominant Regions, Countries, or Segments in BIPV Industry
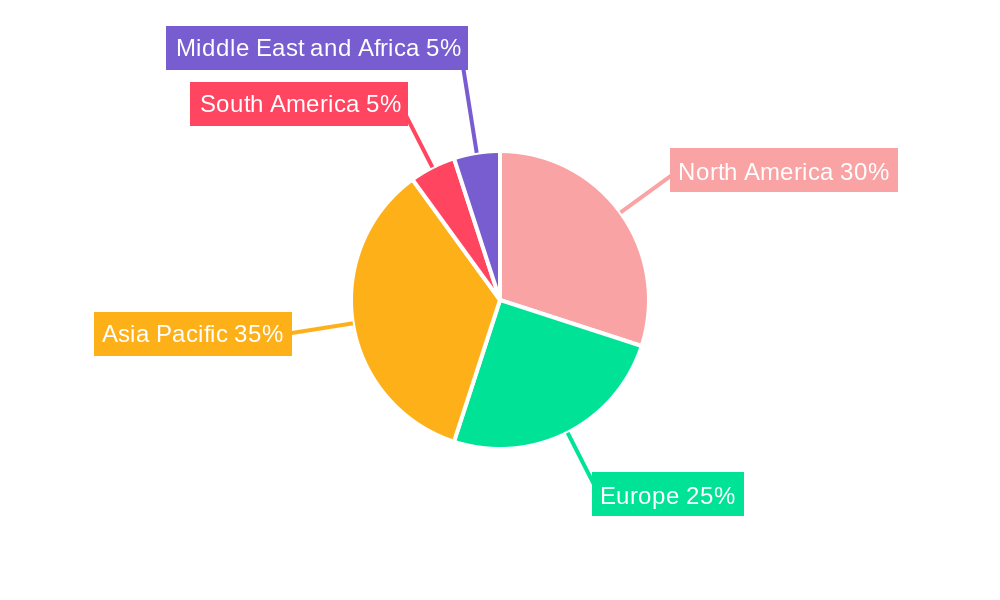
The North American and European markets currently lead the BIPV sector, primarily due to established green building regulations and high consumer awareness of renewable energy. The Commercial & Industrial segment shows higher growth potential compared to the Residential segment because of larger roof areas and higher energy consumption. Crystalline PV currently holds a larger market share than thin-film PV, however, thin-film PV is expected to witness higher growth driven by cost advantages and flexibility.
- Key Drivers: Stringent environmental regulations in Europe and North America; government incentives and subsidies; growing energy costs; rising awareness of sustainability.
- Dominance Factors: Established infrastructure for renewable energy integration; early adoption of green building technologies; strong consumer demand.
- Growth Potential: Significant opportunities exist in emerging markets like Asia-Pacific and Latin America, driven by rapid urbanization and economic growth.
BIPV Industry Product Landscape
BIPV products encompass a range of aesthetically integrated photovoltaic modules, seamlessly integrating solar energy generation into building structures. These modules offer varying levels of efficiency, durability, and aesthetic appeal, catering to diverse architectural designs. Recent innovations focus on enhancing energy efficiency, reducing manufacturing costs, and improving product lifespan. Unique selling propositions include enhanced aesthetics, ease of installation, and reduced energy costs for building owners.
Key Drivers, Barriers & Challenges in BIPV Industry
Key Drivers: Increasing demand for renewable energy, supportive government policies, technological advancements in PV technology, and rising awareness of environmental sustainability. Examples include tax credits for renewable energy installations and building codes that mandate renewable energy integration.
Key Challenges & Restraints: High initial investment costs; complex installation processes; limited awareness among consumers and builders; supply chain disruptions affecting raw material availability; stringent regulatory requirements in certain regions; competitive pressure from conventional roofing materials and standalone solar panel systems. These challenges may lead to a xx% reduction in market growth during certain periods.
Emerging Opportunities in BIPV Industry
Untapped markets in developing countries offer significant opportunities for BIPV market expansion. Innovative applications, such as integrating BIPV into smart building technologies and utilizing BIPV in vertical farming, represent further growth avenues. Evolving consumer preferences for sustainable and energy-efficient building designs are driving demand for innovative BIPV solutions.
Growth Accelerators in the BIPV Industry Industry
Technological breakthroughs, such as advancements in thin-film PV technology, are poised to enhance BIPV efficiency and reduce costs. Strategic partnerships between PV manufacturers and construction companies will streamline integration and facilitate market penetration. Expanding into emerging markets and adapting product designs to suit diverse architectural styles are key strategies for accelerating BIPV market growth.
Key Players Shaping the BIPV Industry Market
- Ertex solartechnik GmbH
- Merck KGaA
- Hanergy Holding Group Ltd
- Onyx Solar Group LLC
- Polysolar Domestic
- Nanoflex Power Corporation
- Solarday
- AGC Inc
- Changzhou Almaden Co Ltd
- Issol SA
Notable Milestones in BIPV Industry Sector
- September 2022: Saint-Gobain announced a strategic partnership with Megasol, expanding its presence in the BIPV market.
- April 2023: ArcelorMittal partnered with BP2 to supply low-carbon steel for SOLROOF integrated photovoltaic roofs, signifying a commitment to sustainable building materials.
In-Depth BIPV Industry Market Outlook
The BIPV market is poised for significant growth over the next decade, driven by technological advancements, supportive policies, and increasing consumer awareness. Strategic opportunities exist in expanding into new markets, developing innovative product applications, and forging strong partnerships across the value chain. The focus on sustainability and the integration of smart building technologies will further propel the growth of the BIPV industry.
BIPV Industry Segmentation
-
1. Type
- 1.1. Thin-film PV
- 1.2. Crystalline PV
-
2. End User
- 2.1. Residential
- 2.2. Commercial and Industrial
BIPV Industry Segmentation By Geography
-
1. North America
- 1.1. United States
- 1.2. Canada
- 1.3. Rest of North America
-
2. Europe
- 2.1. Germany
- 2.2. France
- 2.3. United Kingdom
- 2.4. Turkey
- 2.5. Spain
- 2.6. NORDIC
- 2.7. Russia
- 2.8. Rest of Europe
-
3. Asia Pacific
- 3.1. China
- 3.2. India
- 3.3. Japan
- 3.4. South Korea
- 3.5. Malaysia
- 3.6. Thailand
- 3.7. Indonesia
- 3.8. Vietnam
- 3.9. Rest of Asia Pacific
-
4. South America
- 4.1. Brazil
- 4.2. Argentina
- 4.3. Colombia
- 4.4. Rest of South America
-
5. Middle East and Africa
- 5.1. Saudi Arabia
- 5.2. United Arab Emirates
- 5.3. South Africa
- 5.4. Nigeria
- 5.5. Qatar
- 5.6. Egypt
- 5.7. Rest of Middle East and Africa
BIPV Industry REPORT HIGHLIGHTS
| Aspects | Details |
|---|---|
| Study Period | 2019-2033 |
| Base Year | 2024 |
| Estimated Year | 2025 |
| Forecast Period | 2025-2033 |
| Historical Period | 2019-2024 |
| Growth Rate | CAGR of 14.79% from 2019-2033 |
| Segmentation |
|
Table of Contents
- 1. Introduction
- 1.1. Research Scope
- 1.2. Market Segmentation
- 1.3. Research Methodology
- 1.4. Definitions and Assumptions
- 2. Executive Summary
- 2.1. Introduction
- 3. Market Dynamics
- 3.1. Introduction
- 3.2. Market Drivers
- 3.2.1. 4.; Reduction in Energy Bills Due to Self-Power Consumption4.; Increasing Installation of Solar PV Modules in Residential Segment
- 3.3. Market Restrains
- 3.3.1. 4.; High Installation Cost as Compared to Rooftop PV Systems
- 3.4. Market Trends
- 3.4.1. Crystalline PV Expected to Dominate the Market
- 4. Market Factor Analysis
- 4.1. Porters Five Forces
- 4.2. Supply/Value Chain
- 4.3. PESTEL analysis
- 4.4. Market Entropy
- 4.5. Patent/Trademark Analysis
- 5. Global BIPV Industry Analysis, Insights and Forecast, 2019-2031
- 5.1. Market Analysis, Insights and Forecast - by Type
- 5.1.1. Thin-film PV
- 5.1.2. Crystalline PV
- 5.2. Market Analysis, Insights and Forecast - by End User
- 5.2.1. Residential
- 5.2.2. Commercial and Industrial
- 5.3. Market Analysis, Insights and Forecast - by Region
- 5.3.1. North America
- 5.3.2. Europe
- 5.3.3. Asia Pacific
- 5.3.4. South America
- 5.3.5. Middle East and Africa
- 5.1. Market Analysis, Insights and Forecast - by Type
- 6. North America BIPV Industry Analysis, Insights and Forecast, 2019-2031
- 6.1. Market Analysis, Insights and Forecast - by Type
- 6.1.1. Thin-film PV
- 6.1.2. Crystalline PV
- 6.2. Market Analysis, Insights and Forecast - by End User
- 6.2.1. Residential
- 6.2.2. Commercial and Industrial
- 6.1. Market Analysis, Insights and Forecast - by Type
- 7. Europe BIPV Industry Analysis, Insights and Forecast, 2019-2031
- 7.1. Market Analysis, Insights and Forecast - by Type
- 7.1.1. Thin-film PV
- 7.1.2. Crystalline PV
- 7.2. Market Analysis, Insights and Forecast - by End User
- 7.2.1. Residential
- 7.2.2. Commercial and Industrial
- 7.1. Market Analysis, Insights and Forecast - by Type
- 8. Asia Pacific BIPV Industry Analysis, Insights and Forecast, 2019-2031
- 8.1. Market Analysis, Insights and Forecast - by Type
- 8.1.1. Thin-film PV
- 8.1.2. Crystalline PV
- 8.2. Market Analysis, Insights and Forecast - by End User
- 8.2.1. Residential
- 8.2.2. Commercial and Industrial
- 8.1. Market Analysis, Insights and Forecast - by Type
- 9. South America BIPV Industry Analysis, Insights and Forecast, 2019-2031
- 9.1. Market Analysis, Insights and Forecast - by Type
- 9.1.1. Thin-film PV
- 9.1.2. Crystalline PV
- 9.2. Market Analysis, Insights and Forecast - by End User
- 9.2.1. Residential
- 9.2.2. Commercial and Industrial
- 9.1. Market Analysis, Insights and Forecast - by Type
- 10. Middle East and Africa BIPV Industry Analysis, Insights and Forecast, 2019-2031
- 10.1. Market Analysis, Insights and Forecast - by Type
- 10.1.1. Thin-film PV
- 10.1.2. Crystalline PV
- 10.2. Market Analysis, Insights and Forecast - by End User
- 10.2.1. Residential
- 10.2.2. Commercial and Industrial
- 10.1. Market Analysis, Insights and Forecast - by Type
- 11. North America BIPV Industry Analysis, Insights and Forecast, 2019-2031
- 11.1. Market Analysis, Insights and Forecast - By Country/Sub-region
- 11.1.1 United States
- 11.1.2 Canada
- 11.1.3 Rest of North America
- 12. Europe BIPV Industry Analysis, Insights and Forecast, 2019-2031
- 12.1. Market Analysis, Insights and Forecast - By Country/Sub-region
- 12.1.1 Germany
- 12.1.2 France
- 12.1.3 United Kingdom
- 12.1.4 Rest of Europe
- 13. Asia Pacific BIPV Industry Analysis, Insights and Forecast, 2019-2031
- 13.1. Market Analysis, Insights and Forecast - By Country/Sub-region
- 13.1.1 China
- 13.1.2 India
- 13.1.3 Japan
- 13.1.4 South Korea
- 13.1.5 Rest of Asia Pacific
- 14. South America BIPV Industry Analysis, Insights and Forecast, 2019-2031
- 14.1. Market Analysis, Insights and Forecast - By Country/Sub-region
- 14.1.1 Brazil
- 14.1.2 Argentina
- 14.1.3 Rest of South America
- 15. Middle East and Africa BIPV Industry Analysis, Insights and Forecast, 2019-2031
- 15.1. Market Analysis, Insights and Forecast - By Country/Sub-region
- 15.1.1 Saudi Arabia
- 15.1.2 United Arab Emirates
- 15.1.3 South Africa
- 15.1.4 Rest of Middle East and Africa
- 16. Competitive Analysis
- 16.1. Global Market Share Analysis 2024
- 16.2. Company Profiles
- 16.2.1 Ertex solartechnik GmbH
- 16.2.1.1. Overview
- 16.2.1.2. Products
- 16.2.1.3. SWOT Analysis
- 16.2.1.4. Recent Developments
- 16.2.1.5. Financials (Based on Availability)
- 16.2.2 Merck KGaA
- 16.2.2.1. Overview
- 16.2.2.2. Products
- 16.2.2.3. SWOT Analysis
- 16.2.2.4. Recent Developments
- 16.2.2.5. Financials (Based on Availability)
- 16.2.3 Hanergy Holding Group Ltd
- 16.2.3.1. Overview
- 16.2.3.2. Products
- 16.2.3.3. SWOT Analysis
- 16.2.3.4. Recent Developments
- 16.2.3.5. Financials (Based on Availability)
- 16.2.4 Onyx Solar Group LLC
- 16.2.4.1. Overview
- 16.2.4.2. Products
- 16.2.4.3. SWOT Analysis
- 16.2.4.4. Recent Developments
- 16.2.4.5. Financials (Based on Availability)
- 16.2.5 Polysolar Domestic
- 16.2.5.1. Overview
- 16.2.5.2. Products
- 16.2.5.3. SWOT Analysis
- 16.2.5.4. Recent Developments
- 16.2.5.5. Financials (Based on Availability)
- 16.2.6 Nanoflex Power Corporation
- 16.2.6.1. Overview
- 16.2.6.2. Products
- 16.2.6.3. SWOT Analysis
- 16.2.6.4. Recent Developments
- 16.2.6.5. Financials (Based on Availability)
- 16.2.7 Solarday
- 16.2.7.1. Overview
- 16.2.7.2. Products
- 16.2.7.3. SWOT Analysis
- 16.2.7.4. Recent Developments
- 16.2.7.5. Financials (Based on Availability)
- 16.2.8 AGC Inc
- 16.2.8.1. Overview
- 16.2.8.2. Products
- 16.2.8.3. SWOT Analysis
- 16.2.8.4. Recent Developments
- 16.2.8.5. Financials (Based on Availability)
- 16.2.9 Changzhou Almaden Co Ltd
- 16.2.9.1. Overview
- 16.2.9.2. Products
- 16.2.9.3. SWOT Analysis
- 16.2.9.4. Recent Developments
- 16.2.9.5. Financials (Based on Availability)
- 16.2.10 Issol SA
- 16.2.10.1. Overview
- 16.2.10.2. Products
- 16.2.10.3. SWOT Analysis
- 16.2.10.4. Recent Developments
- 16.2.10.5. Financials (Based on Availability)
- 16.2.1 Ertex solartechnik GmbH
List of Figures
- Figure 1: Global BIPV Industry Revenue Breakdown (Million, %) by Region 2024 & 2032
- Figure 2: Global BIPV Industry Volume Breakdown (Gigawatt, %) by Region 2024 & 2032
- Figure 3: North America BIPV Industry Revenue (Million), by Country 2024 & 2032
- Figure 4: North America BIPV Industry Volume (Gigawatt), by Country 2024 & 2032
- Figure 5: North America BIPV Industry Revenue Share (%), by Country 2024 & 2032
- Figure 6: North America BIPV Industry Volume Share (%), by Country 2024 & 2032
- Figure 7: Europe BIPV Industry Revenue (Million), by Country 2024 & 2032
- Figure 8: Europe BIPV Industry Volume (Gigawatt), by Country 2024 & 2032
- Figure 9: Europe BIPV Industry Revenue Share (%), by Country 2024 & 2032
- Figure 10: Europe BIPV Industry Volume Share (%), by Country 2024 & 2032
- Figure 11: Asia Pacific BIPV Industry Revenue (Million), by Country 2024 & 2032
- Figure 12: Asia Pacific BIPV Industry Volume (Gigawatt), by Country 2024 & 2032
- Figure 13: Asia Pacific BIPV Industry Revenue Share (%), by Country 2024 & 2032
- Figure 14: Asia Pacific BIPV Industry Volume Share (%), by Country 2024 & 2032
- Figure 15: South America BIPV Industry Revenue (Million), by Country 2024 & 2032
- Figure 16: South America BIPV Industry Volume (Gigawatt), by Country 2024 & 2032
- Figure 17: South America BIPV Industry Revenue Share (%), by Country 2024 & 2032
- Figure 18: South America BIPV Industry Volume Share (%), by Country 2024 & 2032
- Figure 19: Middle East and Africa BIPV Industry Revenue (Million), by Country 2024 & 2032
- Figure 20: Middle East and Africa BIPV Industry Volume (Gigawatt), by Country 2024 & 2032
- Figure 21: Middle East and Africa BIPV Industry Revenue Share (%), by Country 2024 & 2032
- Figure 22: Middle East and Africa BIPV Industry Volume Share (%), by Country 2024 & 2032
- Figure 23: North America BIPV Industry Revenue (Million), by Type 2024 & 2032
- Figure 24: North America BIPV Industry Volume (Gigawatt), by Type 2024 & 2032
- Figure 25: North America BIPV Industry Revenue Share (%), by Type 2024 & 2032
- Figure 26: North America BIPV Industry Volume Share (%), by Type 2024 & 2032
- Figure 27: North America BIPV Industry Revenue (Million), by End User 2024 & 2032
- Figure 28: North America BIPV Industry Volume (Gigawatt), by End User 2024 & 2032
- Figure 29: North America BIPV Industry Revenue Share (%), by End User 2024 & 2032
- Figure 30: North America BIPV Industry Volume Share (%), by End User 2024 & 2032
- Figure 31: North America BIPV Industry Revenue (Million), by Country 2024 & 2032
- Figure 32: North America BIPV Industry Volume (Gigawatt), by Country 2024 & 2032
- Figure 33: North America BIPV Industry Revenue Share (%), by Country 2024 & 2032
- Figure 34: North America BIPV Industry Volume Share (%), by Country 2024 & 2032
- Figure 35: Europe BIPV Industry Revenue (Million), by Type 2024 & 2032
- Figure 36: Europe BIPV Industry Volume (Gigawatt), by Type 2024 & 2032
- Figure 37: Europe BIPV Industry Revenue Share (%), by Type 2024 & 2032
- Figure 38: Europe BIPV Industry Volume Share (%), by Type 2024 & 2032
- Figure 39: Europe BIPV Industry Revenue (Million), by End User 2024 & 2032
- Figure 40: Europe BIPV Industry Volume (Gigawatt), by End User 2024 & 2032
- Figure 41: Europe BIPV Industry Revenue Share (%), by End User 2024 & 2032
- Figure 42: Europe BIPV Industry Volume Share (%), by End User 2024 & 2032
- Figure 43: Europe BIPV Industry Revenue (Million), by Country 2024 & 2032
- Figure 44: Europe BIPV Industry Volume (Gigawatt), by Country 2024 & 2032
- Figure 45: Europe BIPV Industry Revenue Share (%), by Country 2024 & 2032
- Figure 46: Europe BIPV Industry Volume Share (%), by Country 2024 & 2032
- Figure 47: Asia Pacific BIPV Industry Revenue (Million), by Type 2024 & 2032
- Figure 48: Asia Pacific BIPV Industry Volume (Gigawatt), by Type 2024 & 2032
- Figure 49: Asia Pacific BIPV Industry Revenue Share (%), by Type 2024 & 2032
- Figure 50: Asia Pacific BIPV Industry Volume Share (%), by Type 2024 & 2032
- Figure 51: Asia Pacific BIPV Industry Revenue (Million), by End User 2024 & 2032
- Figure 52: Asia Pacific BIPV Industry Volume (Gigawatt), by End User 2024 & 2032
- Figure 53: Asia Pacific BIPV Industry Revenue Share (%), by End User 2024 & 2032
- Figure 54: Asia Pacific BIPV Industry Volume Share (%), by End User 2024 & 2032
- Figure 55: Asia Pacific BIPV Industry Revenue (Million), by Country 2024 & 2032
- Figure 56: Asia Pacific BIPV Industry Volume (Gigawatt), by Country 2024 & 2032
- Figure 57: Asia Pacific BIPV Industry Revenue Share (%), by Country 2024 & 2032
- Figure 58: Asia Pacific BIPV Industry Volume Share (%), by Country 2024 & 2032
- Figure 59: South America BIPV Industry Revenue (Million), by Type 2024 & 2032
- Figure 60: South America BIPV Industry Volume (Gigawatt), by Type 2024 & 2032
- Figure 61: South America BIPV Industry Revenue Share (%), by Type 2024 & 2032
- Figure 62: South America BIPV Industry Volume Share (%), by Type 2024 & 2032
- Figure 63: South America BIPV Industry Revenue (Million), by End User 2024 & 2032
- Figure 64: South America BIPV Industry Volume (Gigawatt), by End User 2024 & 2032
- Figure 65: South America BIPV Industry Revenue Share (%), by End User 2024 & 2032
- Figure 66: South America BIPV Industry Volume Share (%), by End User 2024 & 2032
- Figure 67: South America BIPV Industry Revenue (Million), by Country 2024 & 2032
- Figure 68: South America BIPV Industry Volume (Gigawatt), by Country 2024 & 2032
- Figure 69: South America BIPV Industry Revenue Share (%), by Country 2024 & 2032
- Figure 70: South America BIPV Industry Volume Share (%), by Country 2024 & 2032
- Figure 71: Middle East and Africa BIPV Industry Revenue (Million), by Type 2024 & 2032
- Figure 72: Middle East and Africa BIPV Industry Volume (Gigawatt), by Type 2024 & 2032
- Figure 73: Middle East and Africa BIPV Industry Revenue Share (%), by Type 2024 & 2032
- Figure 74: Middle East and Africa BIPV Industry Volume Share (%), by Type 2024 & 2032
- Figure 75: Middle East and Africa BIPV Industry Revenue (Million), by End User 2024 & 2032
- Figure 76: Middle East and Africa BIPV Industry Volume (Gigawatt), by End User 2024 & 2032
- Figure 77: Middle East and Africa BIPV Industry Revenue Share (%), by End User 2024 & 2032
- Figure 78: Middle East and Africa BIPV Industry Volume Share (%), by End User 2024 & 2032
- Figure 79: Middle East and Africa BIPV Industry Revenue (Million), by Country 2024 & 2032
- Figure 80: Middle East and Africa BIPV Industry Volume (Gigawatt), by Country 2024 & 2032
- Figure 81: Middle East and Africa BIPV Industry Revenue Share (%), by Country 2024 & 2032
- Figure 82: Middle East and Africa BIPV Industry Volume Share (%), by Country 2024 & 2032
List of Tables
- Table 1: Global BIPV Industry Revenue Million Forecast, by Region 2019 & 2032
- Table 2: Global BIPV Industry Volume Gigawatt Forecast, by Region 2019 & 2032
- Table 3: Global BIPV Industry Revenue Million Forecast, by Type 2019 & 2032
- Table 4: Global BIPV Industry Volume Gigawatt Forecast, by Type 2019 & 2032
- Table 5: Global BIPV Industry Revenue Million Forecast, by End User 2019 & 2032
- Table 6: Global BIPV Industry Volume Gigawatt Forecast, by End User 2019 & 2032
- Table 7: Global BIPV Industry Revenue Million Forecast, by Region 2019 & 2032
- Table 8: Global BIPV Industry Volume Gigawatt Forecast, by Region 2019 & 2032
- Table 9: Global BIPV Industry Revenue Million Forecast, by Country 2019 & 2032
- Table 10: Global BIPV Industry Volume Gigawatt Forecast, by Country 2019 & 2032
- Table 11: United States BIPV Industry Revenue (Million) Forecast, by Application 2019 & 2032
- Table 12: United States BIPV Industry Volume (Gigawatt) Forecast, by Application 2019 & 2032
- Table 13: Canada BIPV Industry Revenue (Million) Forecast, by Application 2019 & 2032
- Table 14: Canada BIPV Industry Volume (Gigawatt) Forecast, by Application 2019 & 2032
- Table 15: Rest of North America BIPV Industry Revenue (Million) Forecast, by Application 2019 & 2032
- Table 16: Rest of North America BIPV Industry Volume (Gigawatt) Forecast, by Application 2019 & 2032
- Table 17: Global BIPV Industry Revenue Million Forecast, by Country 2019 & 2032
- Table 18: Global BIPV Industry Volume Gigawatt Forecast, by Country 2019 & 2032
- Table 19: Germany BIPV Industry Revenue (Million) Forecast, by Application 2019 & 2032
- Table 20: Germany BIPV Industry Volume (Gigawatt) Forecast, by Application 2019 & 2032
- Table 21: France BIPV Industry Revenue (Million) Forecast, by Application 2019 & 2032
- Table 22: France BIPV Industry Volume (Gigawatt) Forecast, by Application 2019 & 2032
- Table 23: United Kingdom BIPV Industry Revenue (Million) Forecast, by Application 2019 & 2032
- Table 24: United Kingdom BIPV Industry Volume (Gigawatt) Forecast, by Application 2019 & 2032
- Table 25: Rest of Europe BIPV Industry Revenue (Million) Forecast, by Application 2019 & 2032
- Table 26: Rest of Europe BIPV Industry Volume (Gigawatt) Forecast, by Application 2019 & 2032
- Table 27: Global BIPV Industry Revenue Million Forecast, by Country 2019 & 2032
- Table 28: Global BIPV Industry Volume Gigawatt Forecast, by Country 2019 & 2032
- Table 29: China BIPV Industry Revenue (Million) Forecast, by Application 2019 & 2032
- Table 30: China BIPV Industry Volume (Gigawatt) Forecast, by Application 2019 & 2032
- Table 31: India BIPV Industry Revenue (Million) Forecast, by Application 2019 & 2032
- Table 32: India BIPV Industry Volume (Gigawatt) Forecast, by Application 2019 & 2032
- Table 33: Japan BIPV Industry Revenue (Million) Forecast, by Application 2019 & 2032
- Table 34: Japan BIPV Industry Volume (Gigawatt) Forecast, by Application 2019 & 2032
- Table 35: South Korea BIPV Industry Revenue (Million) Forecast, by Application 2019 & 2032
- Table 36: South Korea BIPV Industry Volume (Gigawatt) Forecast, by Application 2019 & 2032
- Table 37: Rest of Asia Pacific BIPV Industry Revenue (Million) Forecast, by Application 2019 & 2032
- Table 38: Rest of Asia Pacific BIPV Industry Volume (Gigawatt) Forecast, by Application 2019 & 2032
- Table 39: Global BIPV Industry Revenue Million Forecast, by Country 2019 & 2032
- Table 40: Global BIPV Industry Volume Gigawatt Forecast, by Country 2019 & 2032
- Table 41: Brazil BIPV Industry Revenue (Million) Forecast, by Application 2019 & 2032
- Table 42: Brazil BIPV Industry Volume (Gigawatt) Forecast, by Application 2019 & 2032
- Table 43: Argentina BIPV Industry Revenue (Million) Forecast, by Application 2019 & 2032
- Table 44: Argentina BIPV Industry Volume (Gigawatt) Forecast, by Application 2019 & 2032
- Table 45: Rest of South America BIPV Industry Revenue (Million) Forecast, by Application 2019 & 2032
- Table 46: Rest of South America BIPV Industry Volume (Gigawatt) Forecast, by Application 2019 & 2032
- Table 47: Global BIPV Industry Revenue Million Forecast, by Country 2019 & 2032
- Table 48: Global BIPV Industry Volume Gigawatt Forecast, by Country 2019 & 2032
- Table 49: Saudi Arabia BIPV Industry Revenue (Million) Forecast, by Application 2019 & 2032
- Table 50: Saudi Arabia BIPV Industry Volume (Gigawatt) Forecast, by Application 2019 & 2032
- Table 51: United Arab Emirates BIPV Industry Revenue (Million) Forecast, by Application 2019 & 2032
- Table 52: United Arab Emirates BIPV Industry Volume (Gigawatt) Forecast, by Application 2019 & 2032
- Table 53: South Africa BIPV Industry Revenue (Million) Forecast, by Application 2019 & 2032
- Table 54: South Africa BIPV Industry Volume (Gigawatt) Forecast, by Application 2019 & 2032
- Table 55: Rest of Middle East and Africa BIPV Industry Revenue (Million) Forecast, by Application 2019 & 2032
- Table 56: Rest of Middle East and Africa BIPV Industry Volume (Gigawatt) Forecast, by Application 2019 & 2032
- Table 57: Global BIPV Industry Revenue Million Forecast, by Type 2019 & 2032
- Table 58: Global BIPV Industry Volume Gigawatt Forecast, by Type 2019 & 2032
- Table 59: Global BIPV Industry Revenue Million Forecast, by End User 2019 & 2032
- Table 60: Global BIPV Industry Volume Gigawatt Forecast, by End User 2019 & 2032
- Table 61: Global BIPV Industry Revenue Million Forecast, by Country 2019 & 2032
- Table 62: Global BIPV Industry Volume Gigawatt Forecast, by Country 2019 & 2032
- Table 63: United States BIPV Industry Revenue (Million) Forecast, by Application 2019 & 2032
- Table 64: United States BIPV Industry Volume (Gigawatt) Forecast, by Application 2019 & 2032
- Table 65: Canada BIPV Industry Revenue (Million) Forecast, by Application 2019 & 2032
- Table 66: Canada BIPV Industry Volume (Gigawatt) Forecast, by Application 2019 & 2032
- Table 67: Rest of North America BIPV Industry Revenue (Million) Forecast, by Application 2019 & 2032
- Table 68: Rest of North America BIPV Industry Volume (Gigawatt) Forecast, by Application 2019 & 2032
- Table 69: Global BIPV Industry Revenue Million Forecast, by Type 2019 & 2032
- Table 70: Global BIPV Industry Volume Gigawatt Forecast, by Type 2019 & 2032
- Table 71: Global BIPV Industry Revenue Million Forecast, by End User 2019 & 2032
- Table 72: Global BIPV Industry Volume Gigawatt Forecast, by End User 2019 & 2032
- Table 73: Global BIPV Industry Revenue Million Forecast, by Country 2019 & 2032
- Table 74: Global BIPV Industry Volume Gigawatt Forecast, by Country 2019 & 2032
- Table 75: Germany BIPV Industry Revenue (Million) Forecast, by Application 2019 & 2032
- Table 76: Germany BIPV Industry Volume (Gigawatt) Forecast, by Application 2019 & 2032
- Table 77: France BIPV Industry Revenue (Million) Forecast, by Application 2019 & 2032
- Table 78: France BIPV Industry Volume (Gigawatt) Forecast, by Application 2019 & 2032
- Table 79: United Kingdom BIPV Industry Revenue (Million) Forecast, by Application 2019 & 2032
- Table 80: United Kingdom BIPV Industry Volume (Gigawatt) Forecast, by Application 2019 & 2032
- Table 81: Turkey BIPV Industry Revenue (Million) Forecast, by Application 2019 & 2032
- Table 82: Turkey BIPV Industry Volume (Gigawatt) Forecast, by Application 2019 & 2032
- Table 83: Spain BIPV Industry Revenue (Million) Forecast, by Application 2019 & 2032
- Table 84: Spain BIPV Industry Volume (Gigawatt) Forecast, by Application 2019 & 2032
- Table 85: NORDIC BIPV Industry Revenue (Million) Forecast, by Application 2019 & 2032
- Table 86: NORDIC BIPV Industry Volume (Gigawatt) Forecast, by Application 2019 & 2032
- Table 87: Russia BIPV Industry Revenue (Million) Forecast, by Application 2019 & 2032
- Table 88: Russia BIPV Industry Volume (Gigawatt) Forecast, by Application 2019 & 2032
- Table 89: Rest of Europe BIPV Industry Revenue (Million) Forecast, by Application 2019 & 2032
- Table 90: Rest of Europe BIPV Industry Volume (Gigawatt) Forecast, by Application 2019 & 2032
- Table 91: Global BIPV Industry Revenue Million Forecast, by Type 2019 & 2032
- Table 92: Global BIPV Industry Volume Gigawatt Forecast, by Type 2019 & 2032
- Table 93: Global BIPV Industry Revenue Million Forecast, by End User 2019 & 2032
- Table 94: Global BIPV Industry Volume Gigawatt Forecast, by End User 2019 & 2032
- Table 95: Global BIPV Industry Revenue Million Forecast, by Country 2019 & 2032
- Table 96: Global BIPV Industry Volume Gigawatt Forecast, by Country 2019 & 2032
- Table 97: China BIPV Industry Revenue (Million) Forecast, by Application 2019 & 2032
- Table 98: China BIPV Industry Volume (Gigawatt) Forecast, by Application 2019 & 2032
- Table 99: India BIPV Industry Revenue (Million) Forecast, by Application 2019 & 2032
- Table 100: India BIPV Industry Volume (Gigawatt) Forecast, by Application 2019 & 2032
- Table 101: Japan BIPV Industry Revenue (Million) Forecast, by Application 2019 & 2032
- Table 102: Japan BIPV Industry Volume (Gigawatt) Forecast, by Application 2019 & 2032
- Table 103: South Korea BIPV Industry Revenue (Million) Forecast, by Application 2019 & 2032
- Table 104: South Korea BIPV Industry Volume (Gigawatt) Forecast, by Application 2019 & 2032
- Table 105: Malaysia BIPV Industry Revenue (Million) Forecast, by Application 2019 & 2032
- Table 106: Malaysia BIPV Industry Volume (Gigawatt) Forecast, by Application 2019 & 2032
- Table 107: Thailand BIPV Industry Revenue (Million) Forecast, by Application 2019 & 2032
- Table 108: Thailand BIPV Industry Volume (Gigawatt) Forecast, by Application 2019 & 2032
- Table 109: Indonesia BIPV Industry Revenue (Million) Forecast, by Application 2019 & 2032
- Table 110: Indonesia BIPV Industry Volume (Gigawatt) Forecast, by Application 2019 & 2032
- Table 111: Vietnam BIPV Industry Revenue (Million) Forecast, by Application 2019 & 2032
- Table 112: Vietnam BIPV Industry Volume (Gigawatt) Forecast, by Application 2019 & 2032
- Table 113: Rest of Asia Pacific BIPV Industry Revenue (Million) Forecast, by Application 2019 & 2032
- Table 114: Rest of Asia Pacific BIPV Industry Volume (Gigawatt) Forecast, by Application 2019 & 2032
- Table 115: Global BIPV Industry Revenue Million Forecast, by Type 2019 & 2032
- Table 116: Global BIPV Industry Volume Gigawatt Forecast, by Type 2019 & 2032
- Table 117: Global BIPV Industry Revenue Million Forecast, by End User 2019 & 2032
- Table 118: Global BIPV Industry Volume Gigawatt Forecast, by End User 2019 & 2032
- Table 119: Global BIPV Industry Revenue Million Forecast, by Country 2019 & 2032
- Table 120: Global BIPV Industry Volume Gigawatt Forecast, by Country 2019 & 2032
- Table 121: Brazil BIPV Industry Revenue (Million) Forecast, by Application 2019 & 2032
- Table 122: Brazil BIPV Industry Volume (Gigawatt) Forecast, by Application 2019 & 2032
- Table 123: Argentina BIPV Industry Revenue (Million) Forecast, by Application 2019 & 2032
- Table 124: Argentina BIPV Industry Volume (Gigawatt) Forecast, by Application 2019 & 2032
- Table 125: Colombia BIPV Industry Revenue (Million) Forecast, by Application 2019 & 2032
- Table 126: Colombia BIPV Industry Volume (Gigawatt) Forecast, by Application 2019 & 2032
- Table 127: Rest of South America BIPV Industry Revenue (Million) Forecast, by Application 2019 & 2032
- Table 128: Rest of South America BIPV Industry Volume (Gigawatt) Forecast, by Application 2019 & 2032
- Table 129: Global BIPV Industry Revenue Million Forecast, by Type 2019 & 2032
- Table 130: Global BIPV Industry Volume Gigawatt Forecast, by Type 2019 & 2032
- Table 131: Global BIPV Industry Revenue Million Forecast, by End User 2019 & 2032
- Table 132: Global BIPV Industry Volume Gigawatt Forecast, by End User 2019 & 2032
- Table 133: Global BIPV Industry Revenue Million Forecast, by Country 2019 & 2032
- Table 134: Global BIPV Industry Volume Gigawatt Forecast, by Country 2019 & 2032
- Table 135: Saudi Arabia BIPV Industry Revenue (Million) Forecast, by Application 2019 & 2032
- Table 136: Saudi Arabia BIPV Industry Volume (Gigawatt) Forecast, by Application 2019 & 2032
- Table 137: United Arab Emirates BIPV Industry Revenue (Million) Forecast, by Application 2019 & 2032
- Table 138: United Arab Emirates BIPV Industry Volume (Gigawatt) Forecast, by Application 2019 & 2032
- Table 139: South Africa BIPV Industry Revenue (Million) Forecast, by Application 2019 & 2032
- Table 140: South Africa BIPV Industry Volume (Gigawatt) Forecast, by Application 2019 & 2032
- Table 141: Nigeria BIPV Industry Revenue (Million) Forecast, by Application 2019 & 2032
- Table 142: Nigeria BIPV Industry Volume (Gigawatt) Forecast, by Application 2019 & 2032
- Table 143: Qatar BIPV Industry Revenue (Million) Forecast, by Application 2019 & 2032
- Table 144: Qatar BIPV Industry Volume (Gigawatt) Forecast, by Application 2019 & 2032
- Table 145: Egypt BIPV Industry Revenue (Million) Forecast, by Application 2019 & 2032
- Table 146: Egypt BIPV Industry Volume (Gigawatt) Forecast, by Application 2019 & 2032
- Table 147: Rest of Middle East and Africa BIPV Industry Revenue (Million) Forecast, by Application 2019 & 2032
- Table 148: Rest of Middle East and Africa BIPV Industry Volume (Gigawatt) Forecast, by Application 2019 & 2032
Frequently Asked Questions
1. What is the projected Compound Annual Growth Rate (CAGR) of the BIPV Industry?
The projected CAGR is approximately 14.79%.
2. Which companies are prominent players in the BIPV Industry?
Key companies in the market include Ertex solartechnik GmbH, Merck KGaA, Hanergy Holding Group Ltd, Onyx Solar Group LLC, Polysolar Domestic, Nanoflex Power Corporation, Solarday, AGC Inc, Changzhou Almaden Co Ltd, Issol SA.
3. What are the main segments of the BIPV Industry?
The market segments include Type, End User.
4. Can you provide details about the market size?
The market size is estimated to be USD 6.31 Million as of 2022.
5. What are some drivers contributing to market growth?
4.; Reduction in Energy Bills Due to Self-Power Consumption4.; Increasing Installation of Solar PV Modules in Residential Segment.
6. What are the notable trends driving market growth?
Crystalline PV Expected to Dominate the Market.
7. Are there any restraints impacting market growth?
4.; High Installation Cost as Compared to Rooftop PV Systems.
8. Can you provide examples of recent developments in the market?
April 2023: ArcelorMittal announced joining forces with BP2 to supply low carbon-emissions steel for BP2's new product, the SOLROOF integrated photovoltaic roof. BP2's integrated photovoltaic FIT VOLT panels will likely be produced solely using XCarb recycled and renewably produced steel, obtained using a minimum of 75% scrap steel and providing 100% renewable electricity.
9. What pricing options are available for accessing the report?
Pricing options include single-user, multi-user, and enterprise licenses priced at USD 4750, USD 5250, and USD 8750 respectively.
10. Is the market size provided in terms of value or volume?
The market size is provided in terms of value, measured in Million and volume, measured in Gigawatt.
11. Are there any specific market keywords associated with the report?
Yes, the market keyword associated with the report is "BIPV Industry," which aids in identifying and referencing the specific market segment covered.
12. How do I determine which pricing option suits my needs best?
The pricing options vary based on user requirements and access needs. Individual users may opt for single-user licenses, while businesses requiring broader access may choose multi-user or enterprise licenses for cost-effective access to the report.
13. Are there any additional resources or data provided in the BIPV Industry report?
While the report offers comprehensive insights, it's advisable to review the specific contents or supplementary materials provided to ascertain if additional resources or data are available.
14. How can I stay updated on further developments or reports in the BIPV Industry?
To stay informed about further developments, trends, and reports in the BIPV Industry, consider subscribing to industry newsletters, following relevant companies and organizations, or regularly checking reputable industry news sources and publications.
Methodology
Step 1 - Identification of Relevant Samples Size from Population Database


Step 2 - Approaches for Defining Global Market Size (Value, Volume* & Price*)

Note*: In applicable scenarios
Step 3 - Data Sources
Primary Research
- Web Analytics
- Survey Reports
- Research Institute
- Latest Research Reports
- Opinion Leaders
Secondary Research
- Annual Reports
- White Paper
- Latest Press Release
- Industry Association
- Paid Database
- Investor Presentations

Step 4 - Data Triangulation
Involves using different sources of information in order to increase the validity of a study
These sources are likely to be stakeholders in a program - participants, other researchers, program staff, other community members, and so on.
Then we put all data in single framework & apply various statistical tools to find out the dynamic on the market.
During the analysis stage, feedback from the stakeholder groups would be compared to determine areas of agreement as well as areas of divergence
