

Key Insights
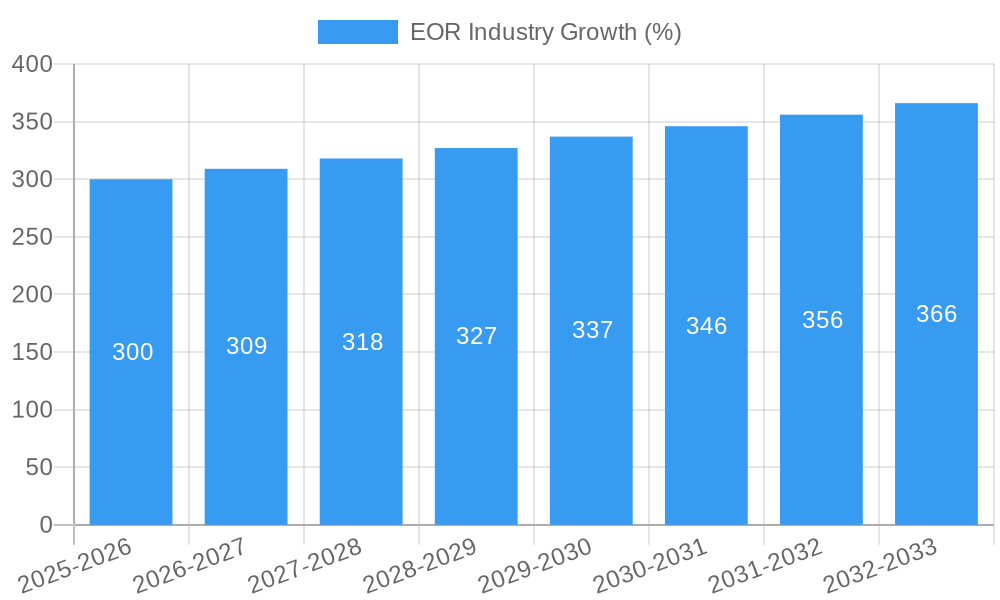
The Enhanced Oil Recovery (EOR) market is experiencing robust growth, driven by the increasing demand for oil and gas and dwindling reserves of easily accessible crude oil. The market's Compound Annual Growth Rate (CAGR) exceeding 2.00% indicates a consistent upward trajectory, projected to continue throughout the forecast period (2025-2033). Several factors contribute to this expansion, including technological advancements in injection techniques (gas, thermal, chemical, and microbial), increasing investments in exploration and production from major players like Shell, ExxonMobil, and Schlumberger, and governmental initiatives promoting energy independence in various regions. The onshore segment currently dominates the market due to easier accessibility and lower operational costs compared to offshore deployments. However, growing offshore exploration activities and technological improvements in offshore EOR are expected to fuel the growth of this segment in the coming years. Geographic growth is largely driven by North America and the Middle East & Africa regions due to significant oil reserves and substantial investment in EOR projects. Restraints include the high capital expenditures required for EOR projects, fluctuating oil prices, and environmental concerns associated with some EOR methods. Nevertheless, the ongoing depletion of conventional reserves and the continued global need for oil are expected to offset these challenges, ensuring the EOR market remains a dynamic and lucrative sector.
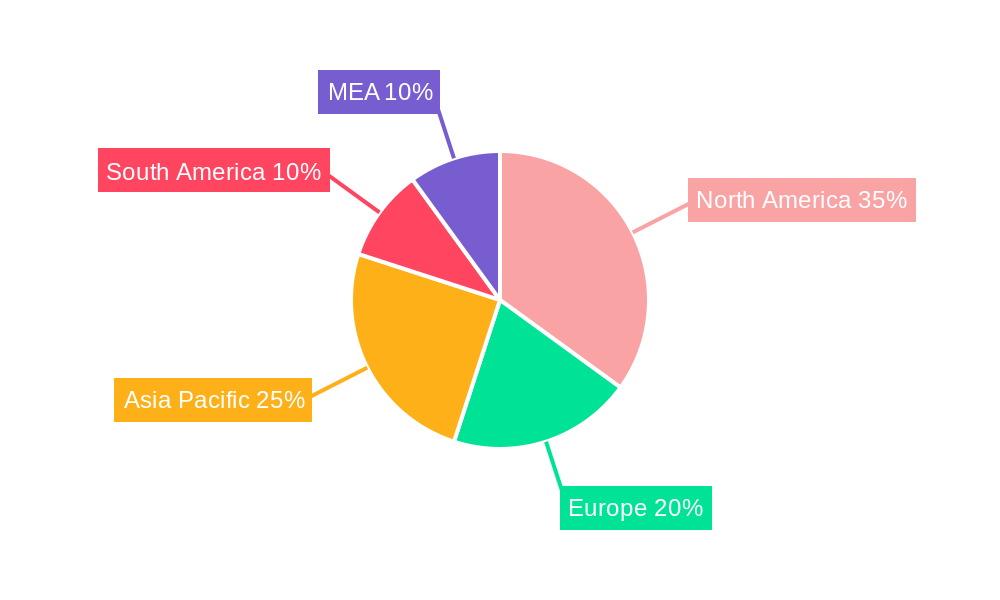
The segmentation of the EOR market reveals a diverse landscape of technologies and deployment locations. Gas injection, while a mature technology, continues to hold a substantial market share, alongside the growing adoption of chemical and thermal injection techniques, each presenting unique advantages and disadvantages based on reservoir characteristics. The emerging microbial EOR technology presents significant potential for cost-effective and environmentally friendly oil extraction, yet faces challenges in scalability and wider adoption. Regionally, North America’s dominance stems from established oil infrastructure and ongoing investment. However, the Asia-Pacific region, particularly China and India, shows considerable growth potential due to rising energy demands and increasing exploration activities. Europe, while having a smaller market share, is expected to contribute steadily through ongoing investments in mature fields and exploration in the North Sea. The Middle East and Africa possess substantial untapped reserves, offering significant long-term growth opportunities, albeit subject to geopolitical and economic factors. The competitive landscape is characterized by a mix of large multinational oil companies and specialized service providers, constantly innovating and competing for market share.
Enhanced Oil Recovery (EOR) Industry Market Report: 2019-2033
This comprehensive report provides a detailed analysis of the EOR industry, encompassing market dynamics, growth trends, regional landscapes, product innovations, and key players. The study period covers 2019-2033, with 2025 as the base and estimated year. The report utilizes data from various sources and expert analysis to present a holistic view of this critical sector within the upstream oil and gas industry.
Parent Market: Upstream Oil & Gas Child Market: Enhanced Oil Recovery (EOR) Technologies & Services
EOR Industry Market Dynamics & Structure
The EOR market is characterized by a moderately concentrated structure, with major international oil companies (IOCs) and specialized service providers holding significant market share. The market is valued at $XX million in 2025. Technological innovation is a key driver, with ongoing R&D efforts focused on improving efficiency and reducing environmental impact. Stringent environmental regulations, particularly concerning carbon emissions, are shaping industry practices and investment decisions. Competitive pressures exist from alternative oil recovery methods and evolving energy policies. Significant M&A activity has been observed, with larger companies consolidating their market position through acquisitions of smaller technology providers and service companies.
- Market Concentration: Moderately concentrated, with top 10 players holding approximately xx% market share in 2025.
- Technological Innovation: Driven by the need to improve recovery rates and reduce costs, focusing on advanced techniques like gas injection, chemical injection and microbial injection.
- Regulatory Frameworks: Stringent environmental regulations are shaping industry practices and driving demand for cleaner technologies.
- Competitive Product Substitutes: Pressure from alternative oil recovery methods and renewable energy sources.
- End-User Demographics: Primarily driven by major IOCs and national oil companies (NOCs).
- M&A Trends: Significant consolidation through acquisitions in recent years (estimated xx deals annually, valued at $XX million). Innovation barriers include high upfront capital investment requirements and technological complexities.
EOR Industry Growth Trends & Insights
The EOR market experienced significant growth during the historical period (2019-2024), driven by rising global oil demand, depleting conventional reserves, and technological advancements. The market is projected to maintain a steady growth trajectory during the forecast period (2025-2033), with a compound annual growth rate (CAGR) of xx%. Increased adoption of enhanced oil recovery methods, especially in mature oilfields, is a key driver. Technological disruptions, such as the development of more efficient and environmentally friendly EOR techniques, are further propelling market expansion. The shift towards sustainable energy practices is also influencing the adoption of EOR methodologies that minimize environmental impact.
Dominant Regions, Countries, or Segments in EOR Industry
The Middle East and North America currently dominate the EOR market, driven by large reserves of mature oil fields and significant investments in EOR technologies. The Onshore segment holds a larger market share compared to Offshore due to its established infrastructure and lower operating costs. Chemical Injection, followed by Gas Injection, accounts for a majority of technology segment. Growth is influenced by several key factors:
- Middle East: Vast mature oil reserves, high investment capacity, and government support for oil production.
- North America: Strong existing oil and gas infrastructure, technological expertise, and a robust service industry.
- Technology Segment:
- Chemical Injection: High market share due to its established effectiveness and relatively lower cost compared to other technologies.
- Gas Injection: Significant adoption due to its established effectiveness and versatility across various reservoir types.
- Location of Deployment:
- Onshore: Higher market share due to the accessibility and relative lower costs associated with this segment.
EOR Industry Product Landscape
The EOR product landscape comprises a range of technologies and services, including chemical injection systems, gas injection equipment, thermal injection systems, and microbial EOR solutions. These are deployed to increase recovery rates by altering reservoir properties, improving fluid mobility, and displacing hydrocarbons. Recent innovations focus on enhanced efficiency, reduced environmental impact, and cost optimization, offering unique selling propositions that attract buyers.
Key Drivers, Barriers & Challenges in EOR Industry
Key Drivers:
- Rising global oil demand
- Depletion of conventional reserves
- Technological advancements in EOR techniques
- Government incentives and support for oil production
Challenges and Restraints:
- High capital expenditure (CAPEX) requirements
- Technological complexities and uncertainties
- Environmental concerns and regulatory restrictions
- Price volatility of oil and gas
Emerging Opportunities in EOR Industry
Emerging opportunities lie in the development of innovative EOR techniques, including the application of nanotechnology, advanced imaging, and data analytics, enabling greater precision and efficiency. Expanding into untapped markets with less developed oil & gas infrastructure presents considerable potential for growth.
Growth Accelerators in the EOR Industry
Significant growth is anticipated due to continuous technological advancements leading to more efficient and environmentally friendly EOR methods. Strategic partnerships between IOCs, technology providers, and service companies will play a significant role in accelerating market expansion. Focus on CO2 capture and utilization projects to reduce carbon footprint will also enhance market growth.
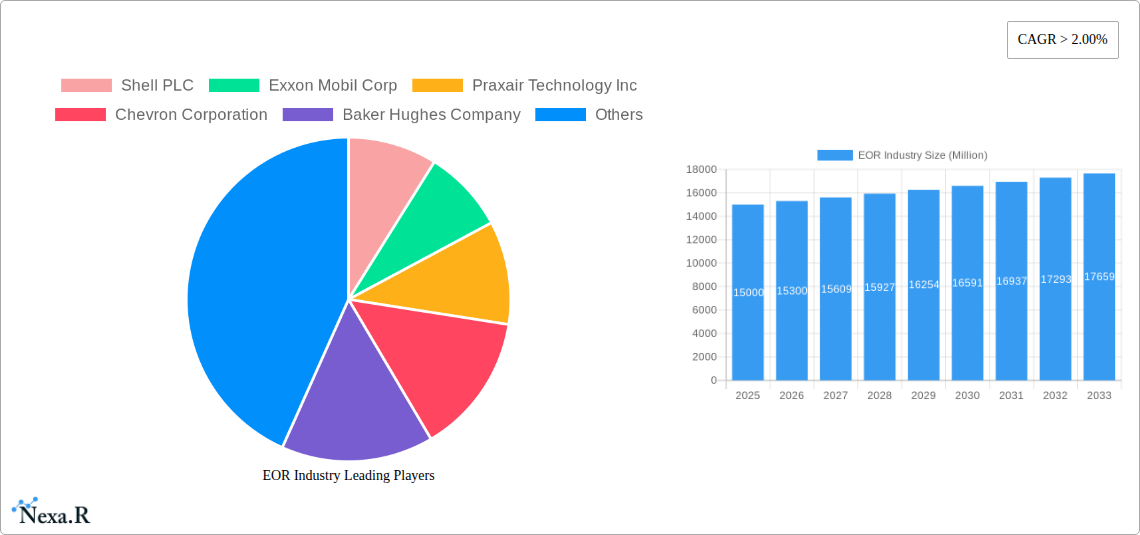
Key Players Shaping the EOR Industry Market
- Shell PLC
- Exxon Mobil Corp
- Praxair Technology Inc
- Chevron Corporation
- Baker Hughes Company
- TotalEnergies SE
- Halliburton Company
- Weatherford International PLC
- BP PLC
- Schlumberger Limited
Notable Milestones in EOR Industry Sector
- July 2021: Sinopec launched China's largest CCUS project, reinjecting CO2 for EOR.
- August 2021: J-Power and Schlumberger planned a joint study on CO2-free hydrogen production using coal gasification, with CO2 used for EOR.
- October 2021: Gazprom Neft and Tatarstan signed an agreement on EOR technology development and project implementation.
- October 2021: LUKOIL and Gazprom Neft agreed to cooperate on enhancing oil recovery projects using chemical methods.
In-Depth EOR Industry Market Outlook
The EOR market is poised for substantial growth, driven by the ongoing need to maximize hydrocarbon recovery from mature fields and the increasing focus on sustainable energy practices. Strategic partnerships, technological innovations, and government support will be instrumental in shaping the industry's future. The market's long-term potential is significant, presenting lucrative opportunities for companies engaged in EOR technologies and services.
EOR Industry Segmentation
-
1. Technology
- 1.1. Gas Injection
- 1.2. Thermal Injection
- 1.3. Chemical Injection
- 1.4. Microbial Injection
- 1.5. Other Technologies
-
2. Location of Deployment
- 2.1. Onshore
- 2.2. Offshore
EOR Industry Segmentation By Geography
- 1. North America
- 2. Europe
- 3. Asia Pacific
- 4. South America
- 5. Middle East
EOR Industry REPORT HIGHLIGHTS
| Aspects | Details |
|---|---|
| Study Period | 2019-2033 |
| Base Year | 2024 |
| Estimated Year | 2025 |
| Forecast Period | 2025-2033 |
| Historical Period | 2019-2024 |
| Growth Rate | CAGR of > 2.00% from 2019-2033 |
| Segmentation |
|
Table of Contents
- 1. Introduction
- 1.1. Research Scope
- 1.2. Market Segmentation
- 1.3. Research Methodology
- 1.4. Definitions and Assumptions
- 2. Executive Summary
- 2.1. Introduction
- 3. Market Dynamics
- 3.1. Introduction
- 3.2. Market Drivers
- 3.2.1. 4.; Rapid Recovery in the Oil and Gas and Mining Industries4.; Surge in the Construction Industry
- 3.3. Market Restrains
- 3.3.1. 4.; High Maintenance and Operation Costs of Submersible Pump Restrain the Market
- 3.4. Market Trends
- 3.4.1. Gas Injection Technique to Dominate the Market
- 4. Market Factor Analysis
- 4.1. Porters Five Forces
- 4.2. Supply/Value Chain
- 4.3. PESTEL analysis
- 4.4. Market Entropy
- 4.5. Patent/Trademark Analysis
- 5. Global EOR Industry Analysis, Insights and Forecast, 2019-2031
- 5.1. Market Analysis, Insights and Forecast - by Technology
- 5.1.1. Gas Injection
- 5.1.2. Thermal Injection
- 5.1.3. Chemical Injection
- 5.1.4. Microbial Injection
- 5.1.5. Other Technologies
- 5.2. Market Analysis, Insights and Forecast - by Location of Deployment
- 5.2.1. Onshore
- 5.2.2. Offshore
- 5.3. Market Analysis, Insights and Forecast - by Region
- 5.3.1. North America
- 5.3.2. Europe
- 5.3.3. Asia Pacific
- 5.3.4. South America
- 5.3.5. Middle East
- 5.1. Market Analysis, Insights and Forecast - by Technology
- 6. North America EOR Industry Analysis, Insights and Forecast, 2019-2031
- 6.1. Market Analysis, Insights and Forecast - by Technology
- 6.1.1. Gas Injection
- 6.1.2. Thermal Injection
- 6.1.3. Chemical Injection
- 6.1.4. Microbial Injection
- 6.1.5. Other Technologies
- 6.2. Market Analysis, Insights and Forecast - by Location of Deployment
- 6.2.1. Onshore
- 6.2.2. Offshore
- 6.1. Market Analysis, Insights and Forecast - by Technology
- 7. Europe EOR Industry Analysis, Insights and Forecast, 2019-2031
- 7.1. Market Analysis, Insights and Forecast - by Technology
- 7.1.1. Gas Injection
- 7.1.2. Thermal Injection
- 7.1.3. Chemical Injection
- 7.1.4. Microbial Injection
- 7.1.5. Other Technologies
- 7.2. Market Analysis, Insights and Forecast - by Location of Deployment
- 7.2.1. Onshore
- 7.2.2. Offshore
- 7.1. Market Analysis, Insights and Forecast - by Technology
- 8. Asia Pacific EOR Industry Analysis, Insights and Forecast, 2019-2031
- 8.1. Market Analysis, Insights and Forecast - by Technology
- 8.1.1. Gas Injection
- 8.1.2. Thermal Injection
- 8.1.3. Chemical Injection
- 8.1.4. Microbial Injection
- 8.1.5. Other Technologies
- 8.2. Market Analysis, Insights and Forecast - by Location of Deployment
- 8.2.1. Onshore
- 8.2.2. Offshore
- 8.1. Market Analysis, Insights and Forecast - by Technology
- 9. South America EOR Industry Analysis, Insights and Forecast, 2019-2031
- 9.1. Market Analysis, Insights and Forecast - by Technology
- 9.1.1. Gas Injection
- 9.1.2. Thermal Injection
- 9.1.3. Chemical Injection
- 9.1.4. Microbial Injection
- 9.1.5. Other Technologies
- 9.2. Market Analysis, Insights and Forecast - by Location of Deployment
- 9.2.1. Onshore
- 9.2.2. Offshore
- 9.1. Market Analysis, Insights and Forecast - by Technology
- 10. Middle East EOR Industry Analysis, Insights and Forecast, 2019-2031
- 10.1. Market Analysis, Insights and Forecast - by Technology
- 10.1.1. Gas Injection
- 10.1.2. Thermal Injection
- 10.1.3. Chemical Injection
- 10.1.4. Microbial Injection
- 10.1.5. Other Technologies
- 10.2. Market Analysis, Insights and Forecast - by Location of Deployment
- 10.2.1. Onshore
- 10.2.2. Offshore
- 10.1. Market Analysis, Insights and Forecast - by Technology
- 11. North America EOR Industry Analysis, Insights and Forecast, 2019-2031
- 11.1. Market Analysis, Insights and Forecast - By Country/Sub-region
- 11.1.1 United States
- 11.1.2 Canada
- 11.1.3 Mexico
- 12. Europe EOR Industry Analysis, Insights and Forecast, 2019-2031
- 12.1. Market Analysis, Insights and Forecast - By Country/Sub-region
- 12.1.1 Germany
- 12.1.2 United Kingdom
- 12.1.3 France
- 12.1.4 Spain
- 12.1.5 Italy
- 12.1.6 Spain
- 12.1.7 Belgium
- 12.1.8 Netherland
- 12.1.9 Nordics
- 12.1.10 Rest of Europe
- 13. Asia Pacific EOR Industry Analysis, Insights and Forecast, 2019-2031
- 13.1. Market Analysis, Insights and Forecast - By Country/Sub-region
- 13.1.1 China
- 13.1.2 Japan
- 13.1.3 India
- 13.1.4 South Korea
- 13.1.5 Southeast Asia
- 13.1.6 Australia
- 13.1.7 Indonesia
- 13.1.8 Phillipes
- 13.1.9 Singapore
- 13.1.10 Thailandc
- 13.1.11 Rest of Asia Pacific
- 14. South America EOR Industry Analysis, Insights and Forecast, 2019-2031
- 14.1. Market Analysis, Insights and Forecast - By Country/Sub-region
- 14.1.1 Brazil
- 14.1.2 Argentina
- 14.1.3 Peru
- 14.1.4 Chile
- 14.1.5 Colombia
- 14.1.6 Ecuador
- 14.1.7 Venezuela
- 14.1.8 Rest of South America
- 15. North America EOR Industry Analysis, Insights and Forecast, 2019-2031
- 15.1. Market Analysis, Insights and Forecast - By Country/Sub-region
- 15.1.1 United States
- 15.1.2 Canada
- 15.1.3 Mexico
- 16. MEA EOR Industry Analysis, Insights and Forecast, 2019-2031
- 16.1. Market Analysis, Insights and Forecast - By Country/Sub-region
- 16.1.1 United Arab Emirates
- 16.1.2 Saudi Arabia
- 16.1.3 South Africa
- 16.1.4 Rest of Middle East and Africa
- 17. Competitive Analysis
- 17.1. Global Market Share Analysis 2024
- 17.2. Company Profiles
- 17.2.1 Shell PLC
- 17.2.1.1. Overview
- 17.2.1.2. Products
- 17.2.1.3. SWOT Analysis
- 17.2.1.4. Recent Developments
- 17.2.1.5. Financials (Based on Availability)
- 17.2.2 Exxon Mobil Corp
- 17.2.2.1. Overview
- 17.2.2.2. Products
- 17.2.2.3. SWOT Analysis
- 17.2.2.4. Recent Developments
- 17.2.2.5. Financials (Based on Availability)
- 17.2.3 Praxair Technology Inc
- 17.2.3.1. Overview
- 17.2.3.2. Products
- 17.2.3.3. SWOT Analysis
- 17.2.3.4. Recent Developments
- 17.2.3.5. Financials (Based on Availability)
- 17.2.4 Chevron Corporation
- 17.2.4.1. Overview
- 17.2.4.2. Products
- 17.2.4.3. SWOT Analysis
- 17.2.4.4. Recent Developments
- 17.2.4.5. Financials (Based on Availability)
- 17.2.5 Baker Hughes Company
- 17.2.5.1. Overview
- 17.2.5.2. Products
- 17.2.5.3. SWOT Analysis
- 17.2.5.4. Recent Developments
- 17.2.5.5. Financials (Based on Availability)
- 17.2.6 TotalEnergies SE
- 17.2.6.1. Overview
- 17.2.6.2. Products
- 17.2.6.3. SWOT Analysis
- 17.2.6.4. Recent Developments
- 17.2.6.5. Financials (Based on Availability)
- 17.2.7 Halliburton Company
- 17.2.7.1. Overview
- 17.2.7.2. Products
- 17.2.7.3. SWOT Analysis
- 17.2.7.4. Recent Developments
- 17.2.7.5. Financials (Based on Availability)
- 17.2.8 Weatherford International PLC*List Not Exhaustive
- 17.2.8.1. Overview
- 17.2.8.2. Products
- 17.2.8.3. SWOT Analysis
- 17.2.8.4. Recent Developments
- 17.2.8.5. Financials (Based on Availability)
- 17.2.9 BP PLC
- 17.2.9.1. Overview
- 17.2.9.2. Products
- 17.2.9.3. SWOT Analysis
- 17.2.9.4. Recent Developments
- 17.2.9.5. Financials (Based on Availability)
- 17.2.10 Schlumberger Limited
- 17.2.10.1. Overview
- 17.2.10.2. Products
- 17.2.10.3. SWOT Analysis
- 17.2.10.4. Recent Developments
- 17.2.10.5. Financials (Based on Availability)
- 17.2.1 Shell PLC
List of Figures
- Figure 1: Global EOR Industry Revenue Breakdown (Million, %) by Region 2024 & 2032
- Figure 2: North America EOR Industry Revenue (Million), by Country 2024 & 2032
- Figure 3: North America EOR Industry Revenue Share (%), by Country 2024 & 2032
- Figure 4: Europe EOR Industry Revenue (Million), by Country 2024 & 2032
- Figure 5: Europe EOR Industry Revenue Share (%), by Country 2024 & 2032
- Figure 6: Asia Pacific EOR Industry Revenue (Million), by Country 2024 & 2032
- Figure 7: Asia Pacific EOR Industry Revenue Share (%), by Country 2024 & 2032
- Figure 8: South America EOR Industry Revenue (Million), by Country 2024 & 2032
- Figure 9: South America EOR Industry Revenue Share (%), by Country 2024 & 2032
- Figure 10: North America EOR Industry Revenue (Million), by Country 2024 & 2032
- Figure 11: North America EOR Industry Revenue Share (%), by Country 2024 & 2032
- Figure 12: MEA EOR Industry Revenue (Million), by Country 2024 & 2032
- Figure 13: MEA EOR Industry Revenue Share (%), by Country 2024 & 2032
- Figure 14: North America EOR Industry Revenue (Million), by Technology 2024 & 2032
- Figure 15: North America EOR Industry Revenue Share (%), by Technology 2024 & 2032
- Figure 16: North America EOR Industry Revenue (Million), by Location of Deployment 2024 & 2032
- Figure 17: North America EOR Industry Revenue Share (%), by Location of Deployment 2024 & 2032
- Figure 18: North America EOR Industry Revenue (Million), by Country 2024 & 2032
- Figure 19: North America EOR Industry Revenue Share (%), by Country 2024 & 2032
- Figure 20: Europe EOR Industry Revenue (Million), by Technology 2024 & 2032
- Figure 21: Europe EOR Industry Revenue Share (%), by Technology 2024 & 2032
- Figure 22: Europe EOR Industry Revenue (Million), by Location of Deployment 2024 & 2032
- Figure 23: Europe EOR Industry Revenue Share (%), by Location of Deployment 2024 & 2032
- Figure 24: Europe EOR Industry Revenue (Million), by Country 2024 & 2032
- Figure 25: Europe EOR Industry Revenue Share (%), by Country 2024 & 2032
- Figure 26: Asia Pacific EOR Industry Revenue (Million), by Technology 2024 & 2032
- Figure 27: Asia Pacific EOR Industry Revenue Share (%), by Technology 2024 & 2032
- Figure 28: Asia Pacific EOR Industry Revenue (Million), by Location of Deployment 2024 & 2032
- Figure 29: Asia Pacific EOR Industry Revenue Share (%), by Location of Deployment 2024 & 2032
- Figure 30: Asia Pacific EOR Industry Revenue (Million), by Country 2024 & 2032
- Figure 31: Asia Pacific EOR Industry Revenue Share (%), by Country 2024 & 2032
- Figure 32: South America EOR Industry Revenue (Million), by Technology 2024 & 2032
- Figure 33: South America EOR Industry Revenue Share (%), by Technology 2024 & 2032
- Figure 34: South America EOR Industry Revenue (Million), by Location of Deployment 2024 & 2032
- Figure 35: South America EOR Industry Revenue Share (%), by Location of Deployment 2024 & 2032
- Figure 36: South America EOR Industry Revenue (Million), by Country 2024 & 2032
- Figure 37: South America EOR Industry Revenue Share (%), by Country 2024 & 2032
- Figure 38: Middle East EOR Industry Revenue (Million), by Technology 2024 & 2032
- Figure 39: Middle East EOR Industry Revenue Share (%), by Technology 2024 & 2032
- Figure 40: Middle East EOR Industry Revenue (Million), by Location of Deployment 2024 & 2032
- Figure 41: Middle East EOR Industry Revenue Share (%), by Location of Deployment 2024 & 2032
- Figure 42: Middle East EOR Industry Revenue (Million), by Country 2024 & 2032
- Figure 43: Middle East EOR Industry Revenue Share (%), by Country 2024 & 2032
List of Tables
- Table 1: Global EOR Industry Revenue Million Forecast, by Region 2019 & 2032
- Table 2: Global EOR Industry Revenue Million Forecast, by Technology 2019 & 2032
- Table 3: Global EOR Industry Revenue Million Forecast, by Location of Deployment 2019 & 2032
- Table 4: Global EOR Industry Revenue Million Forecast, by Region 2019 & 2032
- Table 5: Global EOR Industry Revenue Million Forecast, by Country 2019 & 2032
- Table 6: United States EOR Industry Revenue (Million) Forecast, by Application 2019 & 2032
- Table 7: Canada EOR Industry Revenue (Million) Forecast, by Application 2019 & 2032
- Table 8: Mexico EOR Industry Revenue (Million) Forecast, by Application 2019 & 2032
- Table 9: Global EOR Industry Revenue Million Forecast, by Country 2019 & 2032
- Table 10: Germany EOR Industry Revenue (Million) Forecast, by Application 2019 & 2032
- Table 11: United Kingdom EOR Industry Revenue (Million) Forecast, by Application 2019 & 2032
- Table 12: France EOR Industry Revenue (Million) Forecast, by Application 2019 & 2032
- Table 13: Spain EOR Industry Revenue (Million) Forecast, by Application 2019 & 2032
- Table 14: Italy EOR Industry Revenue (Million) Forecast, by Application 2019 & 2032
- Table 15: Spain EOR Industry Revenue (Million) Forecast, by Application 2019 & 2032
- Table 16: Belgium EOR Industry Revenue (Million) Forecast, by Application 2019 & 2032
- Table 17: Netherland EOR Industry Revenue (Million) Forecast, by Application 2019 & 2032
- Table 18: Nordics EOR Industry Revenue (Million) Forecast, by Application 2019 & 2032
- Table 19: Rest of Europe EOR Industry Revenue (Million) Forecast, by Application 2019 & 2032
- Table 20: Global EOR Industry Revenue Million Forecast, by Country 2019 & 2032
- Table 21: China EOR Industry Revenue (Million) Forecast, by Application 2019 & 2032
- Table 22: Japan EOR Industry Revenue (Million) Forecast, by Application 2019 & 2032
- Table 23: India EOR Industry Revenue (Million) Forecast, by Application 2019 & 2032
- Table 24: South Korea EOR Industry Revenue (Million) Forecast, by Application 2019 & 2032
- Table 25: Southeast Asia EOR Industry Revenue (Million) Forecast, by Application 2019 & 2032
- Table 26: Australia EOR Industry Revenue (Million) Forecast, by Application 2019 & 2032
- Table 27: Indonesia EOR Industry Revenue (Million) Forecast, by Application 2019 & 2032
- Table 28: Phillipes EOR Industry Revenue (Million) Forecast, by Application 2019 & 2032
- Table 29: Singapore EOR Industry Revenue (Million) Forecast, by Application 2019 & 2032
- Table 30: Thailandc EOR Industry Revenue (Million) Forecast, by Application 2019 & 2032
- Table 31: Rest of Asia Pacific EOR Industry Revenue (Million) Forecast, by Application 2019 & 2032
- Table 32: Global EOR Industry Revenue Million Forecast, by Country 2019 & 2032
- Table 33: Brazil EOR Industry Revenue (Million) Forecast, by Application 2019 & 2032
- Table 34: Argentina EOR Industry Revenue (Million) Forecast, by Application 2019 & 2032
- Table 35: Peru EOR Industry Revenue (Million) Forecast, by Application 2019 & 2032
- Table 36: Chile EOR Industry Revenue (Million) Forecast, by Application 2019 & 2032
- Table 37: Colombia EOR Industry Revenue (Million) Forecast, by Application 2019 & 2032
- Table 38: Ecuador EOR Industry Revenue (Million) Forecast, by Application 2019 & 2032
- Table 39: Venezuela EOR Industry Revenue (Million) Forecast, by Application 2019 & 2032
- Table 40: Rest of South America EOR Industry Revenue (Million) Forecast, by Application 2019 & 2032
- Table 41: Global EOR Industry Revenue Million Forecast, by Country 2019 & 2032
- Table 42: United States EOR Industry Revenue (Million) Forecast, by Application 2019 & 2032
- Table 43: Canada EOR Industry Revenue (Million) Forecast, by Application 2019 & 2032
- Table 44: Mexico EOR Industry Revenue (Million) Forecast, by Application 2019 & 2032
- Table 45: Global EOR Industry Revenue Million Forecast, by Country 2019 & 2032
- Table 46: United Arab Emirates EOR Industry Revenue (Million) Forecast, by Application 2019 & 2032
- Table 47: Saudi Arabia EOR Industry Revenue (Million) Forecast, by Application 2019 & 2032
- Table 48: South Africa EOR Industry Revenue (Million) Forecast, by Application 2019 & 2032
- Table 49: Rest of Middle East and Africa EOR Industry Revenue (Million) Forecast, by Application 2019 & 2032
- Table 50: Global EOR Industry Revenue Million Forecast, by Technology 2019 & 2032
- Table 51: Global EOR Industry Revenue Million Forecast, by Location of Deployment 2019 & 2032
- Table 52: Global EOR Industry Revenue Million Forecast, by Country 2019 & 2032
- Table 53: Global EOR Industry Revenue Million Forecast, by Technology 2019 & 2032
- Table 54: Global EOR Industry Revenue Million Forecast, by Location of Deployment 2019 & 2032
- Table 55: Global EOR Industry Revenue Million Forecast, by Country 2019 & 2032
- Table 56: Global EOR Industry Revenue Million Forecast, by Technology 2019 & 2032
- Table 57: Global EOR Industry Revenue Million Forecast, by Location of Deployment 2019 & 2032
- Table 58: Global EOR Industry Revenue Million Forecast, by Country 2019 & 2032
- Table 59: Global EOR Industry Revenue Million Forecast, by Technology 2019 & 2032
- Table 60: Global EOR Industry Revenue Million Forecast, by Location of Deployment 2019 & 2032
- Table 61: Global EOR Industry Revenue Million Forecast, by Country 2019 & 2032
- Table 62: Global EOR Industry Revenue Million Forecast, by Technology 2019 & 2032
- Table 63: Global EOR Industry Revenue Million Forecast, by Location of Deployment 2019 & 2032
- Table 64: Global EOR Industry Revenue Million Forecast, by Country 2019 & 2032
Frequently Asked Questions
1. What is the projected Compound Annual Growth Rate (CAGR) of the EOR Industry?
The projected CAGR is approximately > 2.00%.
2. Which companies are prominent players in the EOR Industry?
Key companies in the market include Shell PLC, Exxon Mobil Corp, Praxair Technology Inc, Chevron Corporation, Baker Hughes Company, TotalEnergies SE, Halliburton Company, Weatherford International PLC*List Not Exhaustive, BP PLC, Schlumberger Limited.
3. What are the main segments of the EOR Industry?
The market segments include Technology, Location of Deployment.
4. Can you provide details about the market size?
The market size is estimated to be USD XX Million as of 2022.
5. What are some drivers contributing to market growth?
4.; Rapid Recovery in the Oil and Gas and Mining Industries4.; Surge in the Construction Industry.
6. What are the notable trends driving market growth?
Gas Injection Technique to Dominate the Market.
7. Are there any restraints impacting market growth?
4.; High Maintenance and Operation Costs of Submersible Pump Restrain the Market.
8. Can you provide examples of recent developments in the market?
In July 2021, Sinopec launched China's largest carbon capture, storage, and utilization (CCUS) project. The scheme involves sending carbon dioxide captured at a petrochemical refinery to the Shengli oilfield, where it will be reinjected as part of the field's enhanced oil recovery program.
9. What pricing options are available for accessing the report?
Pricing options include single-user, multi-user, and enterprise licenses priced at USD 4750, USD 5250, and USD 8750 respectively.
10. Is the market size provided in terms of value or volume?
The market size is provided in terms of value, measured in Million.
11. Are there any specific market keywords associated with the report?
Yes, the market keyword associated with the report is "EOR Industry," which aids in identifying and referencing the specific market segment covered.
12. How do I determine which pricing option suits my needs best?
The pricing options vary based on user requirements and access needs. Individual users may opt for single-user licenses, while businesses requiring broader access may choose multi-user or enterprise licenses for cost-effective access to the report.
13. Are there any additional resources or data provided in the EOR Industry report?
While the report offers comprehensive insights, it's advisable to review the specific contents or supplementary materials provided to ascertain if additional resources or data are available.
14. How can I stay updated on further developments or reports in the EOR Industry?
To stay informed about further developments, trends, and reports in the EOR Industry, consider subscribing to industry newsletters, following relevant companies and organizations, or regularly checking reputable industry news sources and publications.
Methodology
Step 1 - Identification of Relevant Samples Size from Population Database


Step 2 - Approaches for Defining Global Market Size (Value, Volume* & Price*)

Note*: In applicable scenarios
Step 3 - Data Sources
Primary Research
- Web Analytics
- Survey Reports
- Research Institute
- Latest Research Reports
- Opinion Leaders
Secondary Research
- Annual Reports
- White Paper
- Latest Press Release
- Industry Association
- Paid Database
- Investor Presentations

Step 4 - Data Triangulation
Involves using different sources of information in order to increase the validity of a study
These sources are likely to be stakeholders in a program - participants, other researchers, program staff, other community members, and so on.
Then we put all data in single framework & apply various statistical tools to find out the dynamic on the market.
During the analysis stage, feedback from the stakeholder groups would be compared to determine areas of agreement as well as areas of divergence
