

Key Insights
The Bladder Cancer Therapeutics and Diagnostics Market is projected for substantial growth, expected to reach 4065.1 million by 2033, with a Compound Annual Growth Rate (CAGR) of 7.1% from the base year 2025. This expansion is driven by the increasing global incidence of bladder cancer, advancements in early detection technologies, and the development of novel therapeutic strategies. Rising awareness, escalating healthcare expenditures, and an aging global population further contribute to market demand. Key factors include the prevalence of risk factors like smoking and occupational carcinogen exposure, alongside pharmaceutical and diagnostic company innovation in product portfolios. The market is shifting towards personalized medicine and targeted therapies, notably immunotherapy, which shows promising results for various bladder cancer subtypes.
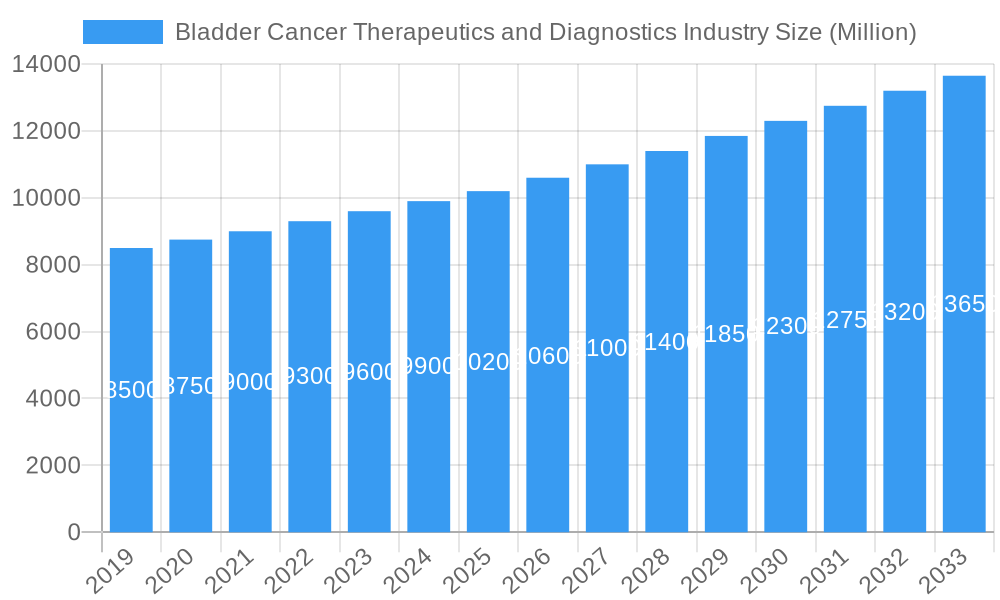
Bladder Cancer Therapeutics and Diagnostics Industry Market Size (In Billion)
The market is segmented into therapeutics and diagnostics, further categorized by cancer type. Chemotherapy remains vital in therapeutics, with immunotherapy rapidly gaining prominence for its efficacy and patient tolerability. Diagnostic segments are innovating with more accurate, less invasive tests, including advanced cystoscopy, sophisticated bladder ultrasound, and enhanced urinalysis. Transitional Cell Bladder Cancer, the most prevalent type, drives significant demand for treatments and diagnostics. Leading industry players, including Novartis, Merck, Roche, and Pfizer, are actively investing in R&D, forming strategic collaborations, and pursuing M&A activities to strengthen market positions and address unmet medical needs. Emerging markets, especially in the Asia Pacific, offer lucrative opportunities due to developing healthcare infrastructure and increased patient access to advanced medical solutions. However, high treatment costs and reimbursement challenges may present restraints, requiring continuous innovation and policy support for broader market access.
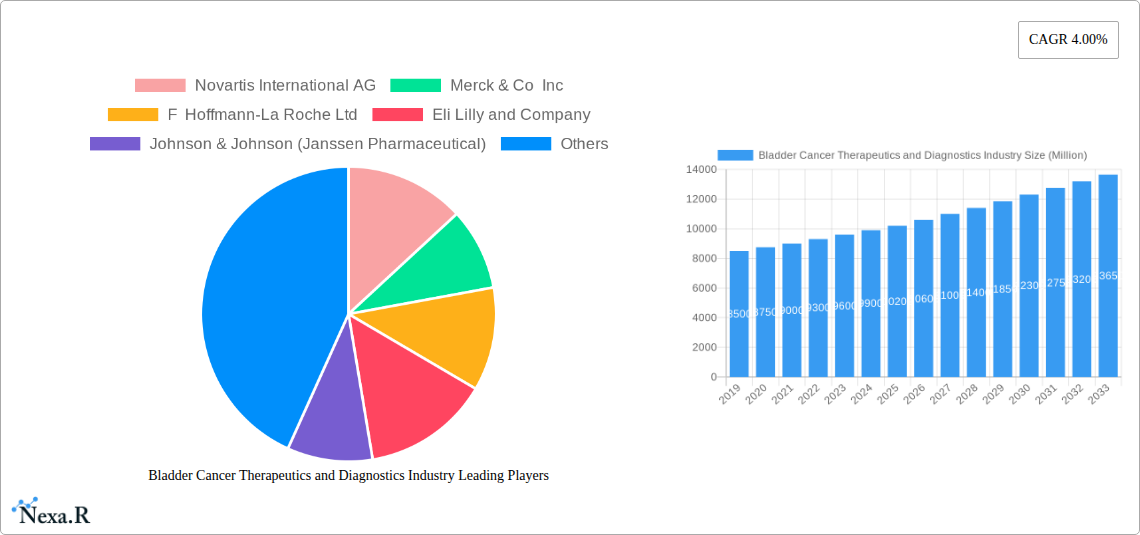
Bladder Cancer Therapeutics and Diagnostics Industry Company Market Share
Bladder Cancer Therapeutics and Diagnostics Industry: Comprehensive Market Analysis & Forecast 2019-2033
Unlock critical insights into the dynamic Bladder Cancer Therapeutics and Diagnostics Industry. This in-depth report provides a meticulous analysis of market size, growth drivers, regional dominance, product innovations, key players, and future opportunities. Covering the period from 2019 to 2033, with a base year of 2025, this report is your essential guide to navigating the evolving landscape of bladder cancer treatment and diagnosis. Leverage granular data on therapeutics (chemotherapy, immunotherapy, others) and diagnostics (cystoscopy, bladder ultrasound, urinalysis, others), segmented by cancer type (transitional cell, squamous cell, others) to inform strategic decisions.
Bladder Cancer Therapeutics and Diagnostics Industry Market Dynamics & Structure
The Bladder Cancer Therapeutics and Diagnostics Industry is characterized by a moderately concentrated market, with a few dominant players like Novartis International AG, Merck & Co Inc, F Hoffmann-La Roche Ltd, Eli Lilly and Company, and Johnson & Johnson (Janssen Pharmaceutical) holding significant shares. Technological innovation is a primary driver, fueled by advancements in immunotherapy, targeted therapies, and early detection diagnostic tools. Stringent regulatory frameworks, particularly from bodies like the United States Food and Drug Administration (FDA), shape product development and market entry strategies. Competitive product substitutes exist, especially in the therapeutic segment with the emergence of novel drug classes challenging traditional chemotherapy. End-user demographics are influenced by aging populations and increasing awareness of cancer screening. Mergers and acquisitions (M&A) are a recurring trend, as larger companies seek to bolster their pipelines and expand market reach.
- Market Concentration: Dominated by key pharmaceutical and diagnostic giants.
- Innovation Drivers: Immunotherapy, precision medicine, and advanced diagnostics.
- Regulatory Influence: FDA, EMA, and other global health authorities significantly impact market access and product approval.
- Competitive Landscape: Dynamic with continuous development of novel therapeutic and diagnostic solutions.
- End-User Profile: Driven by an aging global population and increased cancer incidence.
- M&A Activity: Strategic acquisitions are crucial for pipeline expansion and market consolidation.
Bladder Cancer Therapeutics and Diagnostics Industry Growth Trends & Insights
The Bladder Cancer Therapeutics and Diagnostics Industry is poised for substantial growth, driven by an increasing global incidence of bladder cancer, particularly among aging populations and specific demographic groups. The market size evolution is projected to witness a significant upward trajectory from its base year of 2025 through 2033. Adoption rates for advanced therapeutic modalities, especially immunotherapies and targeted treatments, are accelerating as their efficacy in improving patient outcomes becomes increasingly evident. Technological disruptions are a constant, with novel diagnostic platforms enabling earlier and more accurate detection, thereby improving the therapeutic window for patients. Consumer behavior shifts are also contributing, with greater patient engagement in treatment decisions and demand for less invasive diagnostic procedures. The projected Compound Annual Growth Rate (CAGR) indicates a robust expansion, with market penetration deepening as awareness and accessibility of advanced treatments and diagnostics improve worldwide.
Dominant Regions, Countries, or Segments in Bladder Cancer Therapeutics and Diagnostics Industry
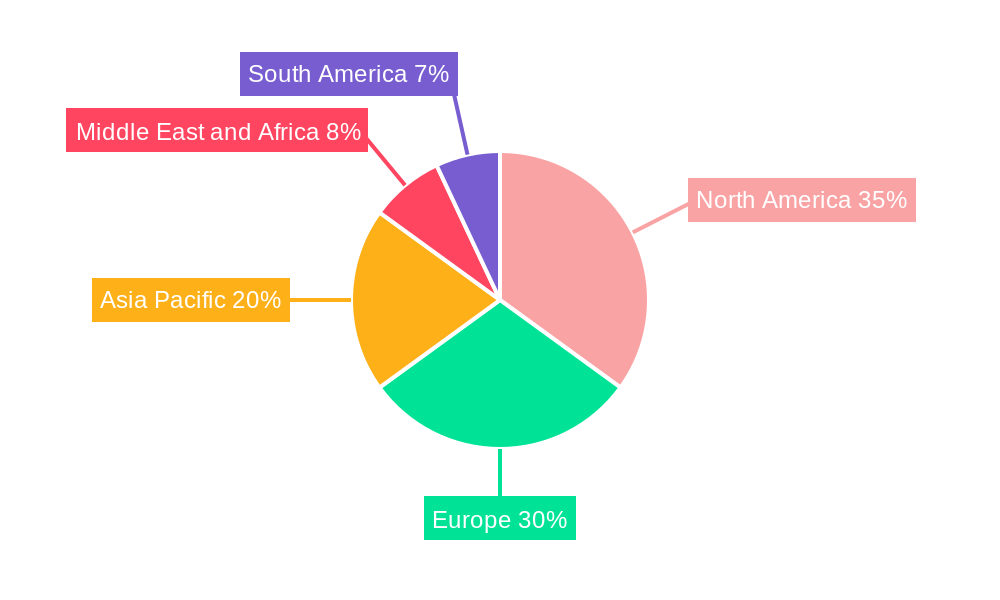
North America, particularly the United States, currently dominates the Bladder Cancer Therapeutics and Diagnostics Industry, owing to its robust healthcare infrastructure, high healthcare expenditure, and significant investment in research and development. The region benefits from a strong presence of leading pharmaceutical and diagnostic companies, coupled with a proactive regulatory environment that supports innovation.
Dominant Product Segment: Therapeutics
Within the therapeutics segment, Immunotherapy is emerging as a pivotal growth driver. Its ability to harness the patient's immune system to fight cancer has revolutionized treatment paradigms for bladder cancer, offering improved survival rates and quality of life compared to traditional chemotherapy.
- Key Drivers for Immunotherapy Dominance:
- High Efficacy in NMIBC and Advanced Cancers: Immunotherapies have demonstrated significant success in non-muscle-invasive bladder cancer (NMIBC) and metastatic bladder cancer.
- Increasing Approvals and Pipeline: Regulatory bodies are approving new immunotherapy agents, and a robust pipeline of investigational immunotherapies promises further advancements.
- Favorable Safety Profile: Compared to some chemotherapy regimens, immunotherapies often present a more manageable side-effect profile.
Dominant Cancer Type: Transitional Cell Bladder Cancer
Transitional Cell Bladder Cancer, also known as urothelial carcinoma, accounts for the vast majority of bladder cancer cases globally, making it the most significant segment in terms of market demand for both therapeutics and diagnostics.
- Factors Contributing to Dominance:
- Prevalence: It represents approximately 90-95% of all bladder cancer diagnoses.
- Research Focus: The high prevalence naturally attracts significant research and development efforts, leading to a wealth of treatment and diagnostic options tailored for this subtype.
Dominant Diagnostic Segment: Urinalysis
While cystoscopy remains a gold standard for direct visualization, Urinalysis is a critical and widely adopted diagnostic tool due to its non-invasiveness, cost-effectiveness, and early screening potential. Advancements in urinalysis technology are continuously enhancing its diagnostic accuracy.
- Drivers for Urinalysis Dominance:
- Early Detection and Screening: Effective in identifying potential bladder cancer markers at an early stage.
- Accessibility and Affordability: Widely available across healthcare settings, making it a primary diagnostic step.
- Technological Advancements: Newer urine-based biomarkers are improving specificity and sensitivity.
Bladder Cancer Therapeutics and Diagnostics Industry Product Landscape
The Bladder Cancer Therapeutics and Diagnostics Industry is characterized by a dynamic product landscape driven by innovation. In therapeutics, immunotherapy agents like checkpoint inhibitors are revolutionizing patient outcomes, while novel chemotherapy regimens offer refined treatment strategies. Advanced diagnostic tools, including next-generation sequencing for genetic profiling and sophisticated imaging techniques, are enhancing early detection and personalized treatment approaches. The unique selling propositions lie in improved efficacy, reduced toxicity, and non-invasive diagnostic capabilities, pushing the boundaries of bladder cancer management. Technological advancements are focused on biomarkers for early detection and monitoring treatment response, ensuring more precise and effective patient care.
Key Drivers, Barriers & Challenges in Bladder Cancer Therapeutics and Diagnostics Industry
Key Drivers:
- Rising Global Incidence: Increasing prevalence of bladder cancer, particularly in aging populations, fuels demand.
- Advancements in Immunotherapy: Breakthroughs in harnessing the immune system are transforming treatment efficacy.
- Technological Innovations in Diagnostics: Development of more sensitive and less invasive diagnostic tools enhances early detection rates.
- Growing Healthcare Expenditure: Increased investment in oncology research and patient care globally supports market growth.
- Favorable Regulatory Pathways: Streamlined approval processes for promising novel therapies and diagnostics.
Barriers & Challenges:
- High Cost of Novel Therapies: Advanced treatments often come with substantial price tags, impacting accessibility.
- Complex Regulatory Hurdles: Stringent approval processes for new drugs and devices can prolong market entry.
- Limited Efficacy in Certain Subtypes: Not all bladder cancers respond equally well to current treatments, necessitating further research.
- Diagnostic Accuracy Limitations: Persistent challenges in achieving 100% accuracy in early-stage detection through non-invasive methods.
- Competition and Market Saturation: Increasing number of players and products can intensify competition.
- Supply Chain Disruptions: Global supply chain vulnerabilities can impact the availability of essential raw materials and finished products.
Emerging Opportunities in Bladder Cancer Therapeutics and Diagnostics Industry
Emerging opportunities in the Bladder Cancer Therapeutics and Diagnostics Industry lie in the development of more targeted therapies for specific genetic mutations within bladder cancer subtypes. The expansion of liquid biopsy technologies for non-invasive diagnosis and monitoring of treatment response presents a significant untapped market. Furthermore, the growing demand for personalized medicine approaches, tailoring treatments based on individual patient profiles, offers substantial growth potential. Partnerships between pharmaceutical companies and diagnostic developers are crucial for creating integrated treatment solutions, while exploring emerging markets with increasing healthcare infrastructure and awareness also represents a key avenue for expansion.
Growth Accelerators in the Bladder Cancer Therapeutics and Diagnostics Industry Industry
Several catalysts are propelling the long-term growth of the Bladder Cancer Therapeutics and Diagnostics Industry. Technological breakthroughs in areas like AI-powered diagnostics and gene editing therapies are poised to redefine treatment standards. Strategic partnerships and collaborations between established pharmaceutical giants and innovative biotech startups are accelerating the development and commercialization of novel solutions. Market expansion strategies targeting underserved regions with growing healthcare needs will further amplify growth. The increasing focus on early detection and preventative measures, supported by public health initiatives and patient advocacy, will also act as significant growth accelerators, driving demand for both diagnostic and therapeutic interventions.
Key Players Shaping the Bladder Cancer Therapeutics and Diagnostics Industry Market
- Novartis International AG
- Merck & Co Inc
- F Hoffmann-La Roche Ltd
- Eli Lilly and Company
- Johnson & Johnson (Janssen Pharmaceutical)
- Ameritech Diagnostic Reagent (Jiaxing) Co Ltd
- Endo Pharmaceuticals Inc
- Astellas Pharma Inc
- Abbott Inc
- Bristol-Myers Squibb Company
- GlaxoSmithKline PLC
- Pfizer Inc
Notable Milestones in Bladder Cancer Therapeutics and Diagnostics Industry Sector
- July 2022: The United States Food and Drug Administration (FDA) agreed to review ImmunityBio's Biologics License Application (BLA) for N-803 in patients with or without Ta or T1 illness who have non-muscle-invasive bladder cancer (NMIBC) carcinoma in situ (CIS).
- July 2022: Nanostics Inc. launched a prospective clinical study designed to validate a novel and minimally invasive bladder cancer diagnostic test, ClarityDX Bladder, using its ClarityDX diagnostic platform. This initiative is a partnership with the University of Alberta's Alberta Prostate Cancer Research Initiative (APCaRI) and DynaLIFE Medical Labs.
In-Depth Bladder Cancer Therapeutics and Diagnostics Industry Market Outlook
The Bladder Cancer Therapeutics and Diagnostics Industry is set for robust expansion, driven by ongoing advancements and strategic initiatives. Future market potential is immense, with a continued focus on precision medicine, personalized therapies, and enhanced diagnostic accuracy. Strategic opportunities abound in developing combination therapies, leveraging real-world evidence to refine treatment protocols, and expanding access to life-saving innovations in emerging economies. The increasing understanding of bladder cancer heterogeneity will further fuel the demand for targeted therapeutics and advanced companion diagnostics. This dynamic market will continue to evolve, offering significant opportunities for stakeholders committed to improving patient outcomes and addressing the unmet needs in bladder cancer management.
Bladder Cancer Therapeutics and Diagnostics Industry Segmentation
-
1. Product
-
1.1. Therapeutics
- 1.1.1. Chemotherapy
- 1.1.2. Immunotherapy
- 1.1.3. Other Therapeuticss
-
1.2. Diagnostics
- 1.2.1. Cystoscopy
- 1.2.2. Bladder Ultrasound
- 1.2.3. Urinalysis
- 1.2.4. Other Diagnostics
-
1.1. Therapeutics
-
2. Cancer Type
- 2.1. Transitional Cell Bladder Cancer
- 2.2. Squamous Cell Bladder Cancer
- 2.3. Other Cancer Types
Bladder Cancer Therapeutics and Diagnostics Industry Segmentation By Geography
-
1. North America
- 1.1. United States
- 1.2. Canada
- 1.3. Mexico
-
2. Europe
- 2.1. Germany
- 2.2. United Kingdom
- 2.3. France
- 2.4. Italy
- 2.5. Spain
- 2.6. Rest of Europe
-
3. Asia Pacific
- 3.1. China
- 3.2. Japan
- 3.3. India
- 3.4. Australia
- 3.5. South Korea
- 3.6. Rest of Asia Pacific
-
4. Middle East and Africa
- 4.1. GCC
- 4.2. South Africa
- 4.3. Rest of Middle East and Africa
-
5. South America
- 5.1. Brazil
- 5.2. Argentina
- 5.3. Rest of South America
Bladder Cancer Therapeutics and Diagnostics Industry Regional Market Share
Geographic Coverage of Bladder Cancer Therapeutics and Diagnostics Industry
Bladder Cancer Therapeutics and Diagnostics Industry REPORT HIGHLIGHTS
| Aspects | Details |
|---|---|
| Study Period | 2020-2034 |
| Base Year | 2025 |
| Estimated Year | 2026 |
| Forecast Period | 2026-2034 |
| Historical Period | 2020-2025 |
| Growth Rate | CAGR of 7.1% from 2020-2034 |
| Segmentation |
|
Table of Contents
- 1. Introduction
- 1.1. Research Scope
- 1.2. Market Segmentation
- 1.3. Research Objective
- 1.4. Definitions and Assumptions
- 2. Executive Summary
- 2.1. Market Snapshot
- 3. Market Dynamics
- 3.1. Market Drivers
- 3.2. Market Restrains
- 3.3. Market Trends
- 3.4. Market Opportunities
- 4. Market Factor Analysis
- 4.1. Porters Five Forces
- 4.1.1. Bargaining Power of Suppliers
- 4.1.2. Bargaining Power of Buyers
- 4.1.3. Threat of New Entrants
- 4.1.4. Threat of Substitutes
- 4.1.5. Competitive Rivalry
- 4.2. PESTEL analysis
- 4.3. BCG Analysis
- 4.3.1. Stars (High Growth, High Market Share)
- 4.3.2. Cash Cows (Low Growth, High Market Share)
- 4.3.3. Question Mark (High Growth, Low Market Share)
- 4.3.4. Dogs (Low Growth, Low Market Share)
- 4.4. Ansoff Matrix Analysis
- 4.5. Supply Chain Analysis
- 4.6. Regulatory Landscape
- 4.7. Current Market Potential and Opportunity Assessment (TAM–SAM–SOM Framework)
- 4.8. NRP Analyst Note
- 4.1. Porters Five Forces
- 5. Market Analysis, Insights and Forecast 2021-2033
- 5.1. Market Analysis, Insights and Forecast - by Product
- 5.1.1. Therapeutics
- 5.1.1.1. Chemotherapy
- 5.1.1.2. Immunotherapy
- 5.1.1.3. Other Therapeuticss
- 5.1.2. Diagnostics
- 5.1.2.1. Cystoscopy
- 5.1.2.2. Bladder Ultrasound
- 5.1.2.3. Urinalysis
- 5.1.2.4. Other Diagnostics
- 5.1.1. Therapeutics
- 5.2. Market Analysis, Insights and Forecast - by Cancer Type
- 5.2.1. Transitional Cell Bladder Cancer
- 5.2.2. Squamous Cell Bladder Cancer
- 5.2.3. Other Cancer Types
- 5.3. Market Analysis, Insights and Forecast - by Region
- 5.3.1. North America
- 5.3.2. Europe
- 5.3.3. Asia Pacific
- 5.3.4. Middle East and Africa
- 5.3.5. South America
- 5.1. Market Analysis, Insights and Forecast - by Product
- 6. Global Bladder Cancer Therapeutics and Diagnostics Industry Analysis, Insights and Forecast, 2021-2033
- 6.1. Market Analysis, Insights and Forecast - by Product
- 6.1.1. Therapeutics
- 6.1.1.1. Chemotherapy
- 6.1.1.2. Immunotherapy
- 6.1.1.3. Other Therapeuticss
- 6.1.2. Diagnostics
- 6.1.2.1. Cystoscopy
- 6.1.2.2. Bladder Ultrasound
- 6.1.2.3. Urinalysis
- 6.1.2.4. Other Diagnostics
- 6.1.1. Therapeutics
- 6.2. Market Analysis, Insights and Forecast - by Cancer Type
- 6.2.1. Transitional Cell Bladder Cancer
- 6.2.2. Squamous Cell Bladder Cancer
- 6.2.3. Other Cancer Types
- 6.1. Market Analysis, Insights and Forecast - by Product
- 7. North America Bladder Cancer Therapeutics and Diagnostics Industry Analysis, Insights and Forecast, 2020-2032
- 7.1. Market Analysis, Insights and Forecast - by Product
- 7.1.1. Therapeutics
- 7.1.1.1. Chemotherapy
- 7.1.1.2. Immunotherapy
- 7.1.1.3. Other Therapeuticss
- 7.1.2. Diagnostics
- 7.1.2.1. Cystoscopy
- 7.1.2.2. Bladder Ultrasound
- 7.1.2.3. Urinalysis
- 7.1.2.4. Other Diagnostics
- 7.1.1. Therapeutics
- 7.2. Market Analysis, Insights and Forecast - by Cancer Type
- 7.2.1. Transitional Cell Bladder Cancer
- 7.2.2. Squamous Cell Bladder Cancer
- 7.2.3. Other Cancer Types
- 7.1. Market Analysis, Insights and Forecast - by Product
- 8. Europe Bladder Cancer Therapeutics and Diagnostics Industry Analysis, Insights and Forecast, 2020-2032
- 8.1. Market Analysis, Insights and Forecast - by Product
- 8.1.1. Therapeutics
- 8.1.1.1. Chemotherapy
- 8.1.1.2. Immunotherapy
- 8.1.1.3. Other Therapeuticss
- 8.1.2. Diagnostics
- 8.1.2.1. Cystoscopy
- 8.1.2.2. Bladder Ultrasound
- 8.1.2.3. Urinalysis
- 8.1.2.4. Other Diagnostics
- 8.1.1. Therapeutics
- 8.2. Market Analysis, Insights and Forecast - by Cancer Type
- 8.2.1. Transitional Cell Bladder Cancer
- 8.2.2. Squamous Cell Bladder Cancer
- 8.2.3. Other Cancer Types
- 8.1. Market Analysis, Insights and Forecast - by Product
- 9. Asia Pacific Bladder Cancer Therapeutics and Diagnostics Industry Analysis, Insights and Forecast, 2020-2032
- 9.1. Market Analysis, Insights and Forecast - by Product
- 9.1.1. Therapeutics
- 9.1.1.1. Chemotherapy
- 9.1.1.2. Immunotherapy
- 9.1.1.3. Other Therapeuticss
- 9.1.2. Diagnostics
- 9.1.2.1. Cystoscopy
- 9.1.2.2. Bladder Ultrasound
- 9.1.2.3. Urinalysis
- 9.1.2.4. Other Diagnostics
- 9.1.1. Therapeutics
- 9.2. Market Analysis, Insights and Forecast - by Cancer Type
- 9.2.1. Transitional Cell Bladder Cancer
- 9.2.2. Squamous Cell Bladder Cancer
- 9.2.3. Other Cancer Types
- 9.1. Market Analysis, Insights and Forecast - by Product
- 10. Middle East and Africa Bladder Cancer Therapeutics and Diagnostics Industry Analysis, Insights and Forecast, 2020-2032
- 10.1. Market Analysis, Insights and Forecast - by Product
- 10.1.1. Therapeutics
- 10.1.1.1. Chemotherapy
- 10.1.1.2. Immunotherapy
- 10.1.1.3. Other Therapeuticss
- 10.1.2. Diagnostics
- 10.1.2.1. Cystoscopy
- 10.1.2.2. Bladder Ultrasound
- 10.1.2.3. Urinalysis
- 10.1.2.4. Other Diagnostics
- 10.1.1. Therapeutics
- 10.2. Market Analysis, Insights and Forecast - by Cancer Type
- 10.2.1. Transitional Cell Bladder Cancer
- 10.2.2. Squamous Cell Bladder Cancer
- 10.2.3. Other Cancer Types
- 10.1. Market Analysis, Insights and Forecast - by Product
- 11. South America Bladder Cancer Therapeutics and Diagnostics Industry Analysis, Insights and Forecast, 2020-2032
- 11.1. Market Analysis, Insights and Forecast - by Product
- 11.1.1. Therapeutics
- 11.1.1.1. Chemotherapy
- 11.1.1.2. Immunotherapy
- 11.1.1.3. Other Therapeuticss
- 11.1.2. Diagnostics
- 11.1.2.1. Cystoscopy
- 11.1.2.2. Bladder Ultrasound
- 11.1.2.3. Urinalysis
- 11.1.2.4. Other Diagnostics
- 11.1.1. Therapeutics
- 11.2. Market Analysis, Insights and Forecast - by Cancer Type
- 11.2.1. Transitional Cell Bladder Cancer
- 11.2.2. Squamous Cell Bladder Cancer
- 11.2.3. Other Cancer Types
- 11.1. Market Analysis, Insights and Forecast - by Product
- 12. Competitive Analysis
- 12.1. Company Profiles
- 12.1.1 Novartis International AG
- 12.1.1.1. Company Overview
- 12.1.1.2. Products
- 12.1.1.3. Company Financials
- 12.1.1.4. SWOT Analysis
- 12.1.2 Merck & Co Inc
- 12.1.2.1. Company Overview
- 12.1.2.2. Products
- 12.1.2.3. Company Financials
- 12.1.2.4. SWOT Analysis
- 12.1.3 F Hoffmann-La Roche Ltd
- 12.1.3.1. Company Overview
- 12.1.3.2. Products
- 12.1.3.3. Company Financials
- 12.1.3.4. SWOT Analysis
- 12.1.4 Eli Lilly and Company
- 12.1.4.1. Company Overview
- 12.1.4.2. Products
- 12.1.4.3. Company Financials
- 12.1.4.4. SWOT Analysis
- 12.1.5 Johnson & Johnson (Janssen Pharmaceutical)
- 12.1.5.1. Company Overview
- 12.1.5.2. Products
- 12.1.5.3. Company Financials
- 12.1.5.4. SWOT Analysis
- 12.1.6 Ameritech Diagnostic Reagent(Jiaxing)Co Ltd
- 12.1.6.1. Company Overview
- 12.1.6.2. Products
- 12.1.6.3. Company Financials
- 12.1.6.4. SWOT Analysis
- 12.1.7 Endo Pharmaceuticals Inc
- 12.1.7.1. Company Overview
- 12.1.7.2. Products
- 12.1.7.3. Company Financials
- 12.1.7.4. SWOT Analysis
- 12.1.8 Astellas Pharma Inc
- 12.1.8.1. Company Overview
- 12.1.8.2. Products
- 12.1.8.3. Company Financials
- 12.1.8.4. SWOT Analysis
- 12.1.9 Abbott Inc
- 12.1.9.1. Company Overview
- 12.1.9.2. Products
- 12.1.9.3. Company Financials
- 12.1.9.4. SWOT Analysis
- 12.1.10 Bristol-Myers Squibb Company
- 12.1.10.1. Company Overview
- 12.1.10.2. Products
- 12.1.10.3. Company Financials
- 12.1.10.4. SWOT Analysis
- 12.1.11 GlaxoSmithKline PLC
- 12.1.11.1. Company Overview
- 12.1.11.2. Products
- 12.1.11.3. Company Financials
- 12.1.11.4. SWOT Analysis
- 12.1.12 Pfizer Inc
- 12.1.12.1. Company Overview
- 12.1.12.2. Products
- 12.1.12.3. Company Financials
- 12.1.12.4. SWOT Analysis
- 12.1.1 Novartis International AG
- 12.2. Market Entropy
- 12.2.1 Company's Key Areas Served
- 12.2.2 Recent Developments
- 12.3. Company Market Share Analysis 2025
- 12.3.1 Top 5 Companies Market Share Analysis
- 12.3.2 Top 3 Companies Market Share Analysis
- 12.4. List of Potential Customers
- 13. Research Methodology
List of Figures
- Figure 1: Global Bladder Cancer Therapeutics and Diagnostics Industry Revenue Breakdown (million, %) by Region 2025 & 2033
- Figure 2: Global Bladder Cancer Therapeutics and Diagnostics Industry Volume Breakdown (K Unit, %) by Region 2025 & 2033
- Figure 3: North America Bladder Cancer Therapeutics and Diagnostics Industry Revenue (million), by Product 2025 & 2033
- Figure 4: North America Bladder Cancer Therapeutics and Diagnostics Industry Volume (K Unit), by Product 2025 & 2033
- Figure 5: North America Bladder Cancer Therapeutics and Diagnostics Industry Revenue Share (%), by Product 2025 & 2033
- Figure 6: North America Bladder Cancer Therapeutics and Diagnostics Industry Volume Share (%), by Product 2025 & 2033
- Figure 7: North America Bladder Cancer Therapeutics and Diagnostics Industry Revenue (million), by Cancer Type 2025 & 2033
- Figure 8: North America Bladder Cancer Therapeutics and Diagnostics Industry Volume (K Unit), by Cancer Type 2025 & 2033
- Figure 9: North America Bladder Cancer Therapeutics and Diagnostics Industry Revenue Share (%), by Cancer Type 2025 & 2033
- Figure 10: North America Bladder Cancer Therapeutics and Diagnostics Industry Volume Share (%), by Cancer Type 2025 & 2033
- Figure 11: North America Bladder Cancer Therapeutics and Diagnostics Industry Revenue (million), by Country 2025 & 2033
- Figure 12: North America Bladder Cancer Therapeutics and Diagnostics Industry Volume (K Unit), by Country 2025 & 2033
- Figure 13: North America Bladder Cancer Therapeutics and Diagnostics Industry Revenue Share (%), by Country 2025 & 2033
- Figure 14: North America Bladder Cancer Therapeutics and Diagnostics Industry Volume Share (%), by Country 2025 & 2033
- Figure 15: Europe Bladder Cancer Therapeutics and Diagnostics Industry Revenue (million), by Product 2025 & 2033
- Figure 16: Europe Bladder Cancer Therapeutics and Diagnostics Industry Volume (K Unit), by Product 2025 & 2033
- Figure 17: Europe Bladder Cancer Therapeutics and Diagnostics Industry Revenue Share (%), by Product 2025 & 2033
- Figure 18: Europe Bladder Cancer Therapeutics and Diagnostics Industry Volume Share (%), by Product 2025 & 2033
- Figure 19: Europe Bladder Cancer Therapeutics and Diagnostics Industry Revenue (million), by Cancer Type 2025 & 2033
- Figure 20: Europe Bladder Cancer Therapeutics and Diagnostics Industry Volume (K Unit), by Cancer Type 2025 & 2033
- Figure 21: Europe Bladder Cancer Therapeutics and Diagnostics Industry Revenue Share (%), by Cancer Type 2025 & 2033
- Figure 22: Europe Bladder Cancer Therapeutics and Diagnostics Industry Volume Share (%), by Cancer Type 2025 & 2033
- Figure 23: Europe Bladder Cancer Therapeutics and Diagnostics Industry Revenue (million), by Country 2025 & 2033
- Figure 24: Europe Bladder Cancer Therapeutics and Diagnostics Industry Volume (K Unit), by Country 2025 & 2033
- Figure 25: Europe Bladder Cancer Therapeutics and Diagnostics Industry Revenue Share (%), by Country 2025 & 2033
- Figure 26: Europe Bladder Cancer Therapeutics and Diagnostics Industry Volume Share (%), by Country 2025 & 2033
- Figure 27: Asia Pacific Bladder Cancer Therapeutics and Diagnostics Industry Revenue (million), by Product 2025 & 2033
- Figure 28: Asia Pacific Bladder Cancer Therapeutics and Diagnostics Industry Volume (K Unit), by Product 2025 & 2033
- Figure 29: Asia Pacific Bladder Cancer Therapeutics and Diagnostics Industry Revenue Share (%), by Product 2025 & 2033
- Figure 30: Asia Pacific Bladder Cancer Therapeutics and Diagnostics Industry Volume Share (%), by Product 2025 & 2033
- Figure 31: Asia Pacific Bladder Cancer Therapeutics and Diagnostics Industry Revenue (million), by Cancer Type 2025 & 2033
- Figure 32: Asia Pacific Bladder Cancer Therapeutics and Diagnostics Industry Volume (K Unit), by Cancer Type 2025 & 2033
- Figure 33: Asia Pacific Bladder Cancer Therapeutics and Diagnostics Industry Revenue Share (%), by Cancer Type 2025 & 2033
- Figure 34: Asia Pacific Bladder Cancer Therapeutics and Diagnostics Industry Volume Share (%), by Cancer Type 2025 & 2033
- Figure 35: Asia Pacific Bladder Cancer Therapeutics and Diagnostics Industry Revenue (million), by Country 2025 & 2033
- Figure 36: Asia Pacific Bladder Cancer Therapeutics and Diagnostics Industry Volume (K Unit), by Country 2025 & 2033
- Figure 37: Asia Pacific Bladder Cancer Therapeutics and Diagnostics Industry Revenue Share (%), by Country 2025 & 2033
- Figure 38: Asia Pacific Bladder Cancer Therapeutics and Diagnostics Industry Volume Share (%), by Country 2025 & 2033
- Figure 39: Middle East and Africa Bladder Cancer Therapeutics and Diagnostics Industry Revenue (million), by Product 2025 & 2033
- Figure 40: Middle East and Africa Bladder Cancer Therapeutics and Diagnostics Industry Volume (K Unit), by Product 2025 & 2033
- Figure 41: Middle East and Africa Bladder Cancer Therapeutics and Diagnostics Industry Revenue Share (%), by Product 2025 & 2033
- Figure 42: Middle East and Africa Bladder Cancer Therapeutics and Diagnostics Industry Volume Share (%), by Product 2025 & 2033
- Figure 43: Middle East and Africa Bladder Cancer Therapeutics and Diagnostics Industry Revenue (million), by Cancer Type 2025 & 2033
- Figure 44: Middle East and Africa Bladder Cancer Therapeutics and Diagnostics Industry Volume (K Unit), by Cancer Type 2025 & 2033
- Figure 45: Middle East and Africa Bladder Cancer Therapeutics and Diagnostics Industry Revenue Share (%), by Cancer Type 2025 & 2033
- Figure 46: Middle East and Africa Bladder Cancer Therapeutics and Diagnostics Industry Volume Share (%), by Cancer Type 2025 & 2033
- Figure 47: Middle East and Africa Bladder Cancer Therapeutics and Diagnostics Industry Revenue (million), by Country 2025 & 2033
- Figure 48: Middle East and Africa Bladder Cancer Therapeutics and Diagnostics Industry Volume (K Unit), by Country 2025 & 2033
- Figure 49: Middle East and Africa Bladder Cancer Therapeutics and Diagnostics Industry Revenue Share (%), by Country 2025 & 2033
- Figure 50: Middle East and Africa Bladder Cancer Therapeutics and Diagnostics Industry Volume Share (%), by Country 2025 & 2033
- Figure 51: South America Bladder Cancer Therapeutics and Diagnostics Industry Revenue (million), by Product 2025 & 2033
- Figure 52: South America Bladder Cancer Therapeutics and Diagnostics Industry Volume (K Unit), by Product 2025 & 2033
- Figure 53: South America Bladder Cancer Therapeutics and Diagnostics Industry Revenue Share (%), by Product 2025 & 2033
- Figure 54: South America Bladder Cancer Therapeutics and Diagnostics Industry Volume Share (%), by Product 2025 & 2033
- Figure 55: South America Bladder Cancer Therapeutics and Diagnostics Industry Revenue (million), by Cancer Type 2025 & 2033
- Figure 56: South America Bladder Cancer Therapeutics and Diagnostics Industry Volume (K Unit), by Cancer Type 2025 & 2033
- Figure 57: South America Bladder Cancer Therapeutics and Diagnostics Industry Revenue Share (%), by Cancer Type 2025 & 2033
- Figure 58: South America Bladder Cancer Therapeutics and Diagnostics Industry Volume Share (%), by Cancer Type 2025 & 2033
- Figure 59: South America Bladder Cancer Therapeutics and Diagnostics Industry Revenue (million), by Country 2025 & 2033
- Figure 60: South America Bladder Cancer Therapeutics and Diagnostics Industry Volume (K Unit), by Country 2025 & 2033
- Figure 61: South America Bladder Cancer Therapeutics and Diagnostics Industry Revenue Share (%), by Country 2025 & 2033
- Figure 62: South America Bladder Cancer Therapeutics and Diagnostics Industry Volume Share (%), by Country 2025 & 2033
List of Tables
- Table 1: Global Bladder Cancer Therapeutics and Diagnostics Industry Revenue million Forecast, by Product 2020 & 2033
- Table 2: Global Bladder Cancer Therapeutics and Diagnostics Industry Volume K Unit Forecast, by Product 2020 & 2033
- Table 3: Global Bladder Cancer Therapeutics and Diagnostics Industry Revenue million Forecast, by Cancer Type 2020 & 2033
- Table 4: Global Bladder Cancer Therapeutics and Diagnostics Industry Volume K Unit Forecast, by Cancer Type 2020 & 2033
- Table 5: Global Bladder Cancer Therapeutics and Diagnostics Industry Revenue million Forecast, by Region 2020 & 2033
- Table 6: Global Bladder Cancer Therapeutics and Diagnostics Industry Volume K Unit Forecast, by Region 2020 & 2033
- Table 7: Global Bladder Cancer Therapeutics and Diagnostics Industry Revenue million Forecast, by Product 2020 & 2033
- Table 8: Global Bladder Cancer Therapeutics and Diagnostics Industry Volume K Unit Forecast, by Product 2020 & 2033
- Table 9: Global Bladder Cancer Therapeutics and Diagnostics Industry Revenue million Forecast, by Cancer Type 2020 & 2033
- Table 10: Global Bladder Cancer Therapeutics and Diagnostics Industry Volume K Unit Forecast, by Cancer Type 2020 & 2033
- Table 11: Global Bladder Cancer Therapeutics and Diagnostics Industry Revenue million Forecast, by Country 2020 & 2033
- Table 12: Global Bladder Cancer Therapeutics and Diagnostics Industry Volume K Unit Forecast, by Country 2020 & 2033
- Table 13: United States Bladder Cancer Therapeutics and Diagnostics Industry Revenue (million) Forecast, by Application 2020 & 2033
- Table 14: United States Bladder Cancer Therapeutics and Diagnostics Industry Volume (K Unit) Forecast, by Application 2020 & 2033
- Table 15: Canada Bladder Cancer Therapeutics and Diagnostics Industry Revenue (million) Forecast, by Application 2020 & 2033
- Table 16: Canada Bladder Cancer Therapeutics and Diagnostics Industry Volume (K Unit) Forecast, by Application 2020 & 2033
- Table 17: Mexico Bladder Cancer Therapeutics and Diagnostics Industry Revenue (million) Forecast, by Application 2020 & 2033
- Table 18: Mexico Bladder Cancer Therapeutics and Diagnostics Industry Volume (K Unit) Forecast, by Application 2020 & 2033
- Table 19: Global Bladder Cancer Therapeutics and Diagnostics Industry Revenue million Forecast, by Product 2020 & 2033
- Table 20: Global Bladder Cancer Therapeutics and Diagnostics Industry Volume K Unit Forecast, by Product 2020 & 2033
- Table 21: Global Bladder Cancer Therapeutics and Diagnostics Industry Revenue million Forecast, by Cancer Type 2020 & 2033
- Table 22: Global Bladder Cancer Therapeutics and Diagnostics Industry Volume K Unit Forecast, by Cancer Type 2020 & 2033
- Table 23: Global Bladder Cancer Therapeutics and Diagnostics Industry Revenue million Forecast, by Country 2020 & 2033
- Table 24: Global Bladder Cancer Therapeutics and Diagnostics Industry Volume K Unit Forecast, by Country 2020 & 2033
- Table 25: Germany Bladder Cancer Therapeutics and Diagnostics Industry Revenue (million) Forecast, by Application 2020 & 2033
- Table 26: Germany Bladder Cancer Therapeutics and Diagnostics Industry Volume (K Unit) Forecast, by Application 2020 & 2033
- Table 27: United Kingdom Bladder Cancer Therapeutics and Diagnostics Industry Revenue (million) Forecast, by Application 2020 & 2033
- Table 28: United Kingdom Bladder Cancer Therapeutics and Diagnostics Industry Volume (K Unit) Forecast, by Application 2020 & 2033
- Table 29: France Bladder Cancer Therapeutics and Diagnostics Industry Revenue (million) Forecast, by Application 2020 & 2033
- Table 30: France Bladder Cancer Therapeutics and Diagnostics Industry Volume (K Unit) Forecast, by Application 2020 & 2033
- Table 31: Italy Bladder Cancer Therapeutics and Diagnostics Industry Revenue (million) Forecast, by Application 2020 & 2033
- Table 32: Italy Bladder Cancer Therapeutics and Diagnostics Industry Volume (K Unit) Forecast, by Application 2020 & 2033
- Table 33: Spain Bladder Cancer Therapeutics and Diagnostics Industry Revenue (million) Forecast, by Application 2020 & 2033
- Table 34: Spain Bladder Cancer Therapeutics and Diagnostics Industry Volume (K Unit) Forecast, by Application 2020 & 2033
- Table 35: Rest of Europe Bladder Cancer Therapeutics and Diagnostics Industry Revenue (million) Forecast, by Application 2020 & 2033
- Table 36: Rest of Europe Bladder Cancer Therapeutics and Diagnostics Industry Volume (K Unit) Forecast, by Application 2020 & 2033
- Table 37: Global Bladder Cancer Therapeutics and Diagnostics Industry Revenue million Forecast, by Product 2020 & 2033
- Table 38: Global Bladder Cancer Therapeutics and Diagnostics Industry Volume K Unit Forecast, by Product 2020 & 2033
- Table 39: Global Bladder Cancer Therapeutics and Diagnostics Industry Revenue million Forecast, by Cancer Type 2020 & 2033
- Table 40: Global Bladder Cancer Therapeutics and Diagnostics Industry Volume K Unit Forecast, by Cancer Type 2020 & 2033
- Table 41: Global Bladder Cancer Therapeutics and Diagnostics Industry Revenue million Forecast, by Country 2020 & 2033
- Table 42: Global Bladder Cancer Therapeutics and Diagnostics Industry Volume K Unit Forecast, by Country 2020 & 2033
- Table 43: China Bladder Cancer Therapeutics and Diagnostics Industry Revenue (million) Forecast, by Application 2020 & 2033
- Table 44: China Bladder Cancer Therapeutics and Diagnostics Industry Volume (K Unit) Forecast, by Application 2020 & 2033
- Table 45: Japan Bladder Cancer Therapeutics and Diagnostics Industry Revenue (million) Forecast, by Application 2020 & 2033
- Table 46: Japan Bladder Cancer Therapeutics and Diagnostics Industry Volume (K Unit) Forecast, by Application 2020 & 2033
- Table 47: India Bladder Cancer Therapeutics and Diagnostics Industry Revenue (million) Forecast, by Application 2020 & 2033
- Table 48: India Bladder Cancer Therapeutics and Diagnostics Industry Volume (K Unit) Forecast, by Application 2020 & 2033
- Table 49: Australia Bladder Cancer Therapeutics and Diagnostics Industry Revenue (million) Forecast, by Application 2020 & 2033
- Table 50: Australia Bladder Cancer Therapeutics and Diagnostics Industry Volume (K Unit) Forecast, by Application 2020 & 2033
- Table 51: South Korea Bladder Cancer Therapeutics and Diagnostics Industry Revenue (million) Forecast, by Application 2020 & 2033
- Table 52: South Korea Bladder Cancer Therapeutics and Diagnostics Industry Volume (K Unit) Forecast, by Application 2020 & 2033
- Table 53: Rest of Asia Pacific Bladder Cancer Therapeutics and Diagnostics Industry Revenue (million) Forecast, by Application 2020 & 2033
- Table 54: Rest of Asia Pacific Bladder Cancer Therapeutics and Diagnostics Industry Volume (K Unit) Forecast, by Application 2020 & 2033
- Table 55: Global Bladder Cancer Therapeutics and Diagnostics Industry Revenue million Forecast, by Product 2020 & 2033
- Table 56: Global Bladder Cancer Therapeutics and Diagnostics Industry Volume K Unit Forecast, by Product 2020 & 2033
- Table 57: Global Bladder Cancer Therapeutics and Diagnostics Industry Revenue million Forecast, by Cancer Type 2020 & 2033
- Table 58: Global Bladder Cancer Therapeutics and Diagnostics Industry Volume K Unit Forecast, by Cancer Type 2020 & 2033
- Table 59: Global Bladder Cancer Therapeutics and Diagnostics Industry Revenue million Forecast, by Country 2020 & 2033
- Table 60: Global Bladder Cancer Therapeutics and Diagnostics Industry Volume K Unit Forecast, by Country 2020 & 2033
- Table 61: GCC Bladder Cancer Therapeutics and Diagnostics Industry Revenue (million) Forecast, by Application 2020 & 2033
- Table 62: GCC Bladder Cancer Therapeutics and Diagnostics Industry Volume (K Unit) Forecast, by Application 2020 & 2033
- Table 63: South Africa Bladder Cancer Therapeutics and Diagnostics Industry Revenue (million) Forecast, by Application 2020 & 2033
- Table 64: South Africa Bladder Cancer Therapeutics and Diagnostics Industry Volume (K Unit) Forecast, by Application 2020 & 2033
- Table 65: Rest of Middle East and Africa Bladder Cancer Therapeutics and Diagnostics Industry Revenue (million) Forecast, by Application 2020 & 2033
- Table 66: Rest of Middle East and Africa Bladder Cancer Therapeutics and Diagnostics Industry Volume (K Unit) Forecast, by Application 2020 & 2033
- Table 67: Global Bladder Cancer Therapeutics and Diagnostics Industry Revenue million Forecast, by Product 2020 & 2033
- Table 68: Global Bladder Cancer Therapeutics and Diagnostics Industry Volume K Unit Forecast, by Product 2020 & 2033
- Table 69: Global Bladder Cancer Therapeutics and Diagnostics Industry Revenue million Forecast, by Cancer Type 2020 & 2033
- Table 70: Global Bladder Cancer Therapeutics and Diagnostics Industry Volume K Unit Forecast, by Cancer Type 2020 & 2033
- Table 71: Global Bladder Cancer Therapeutics and Diagnostics Industry Revenue million Forecast, by Country 2020 & 2033
- Table 72: Global Bladder Cancer Therapeutics and Diagnostics Industry Volume K Unit Forecast, by Country 2020 & 2033
- Table 73: Brazil Bladder Cancer Therapeutics and Diagnostics Industry Revenue (million) Forecast, by Application 2020 & 2033
- Table 74: Brazil Bladder Cancer Therapeutics and Diagnostics Industry Volume (K Unit) Forecast, by Application 2020 & 2033
- Table 75: Argentina Bladder Cancer Therapeutics and Diagnostics Industry Revenue (million) Forecast, by Application 2020 & 2033
- Table 76: Argentina Bladder Cancer Therapeutics and Diagnostics Industry Volume (K Unit) Forecast, by Application 2020 & 2033
- Table 77: Rest of South America Bladder Cancer Therapeutics and Diagnostics Industry Revenue (million) Forecast, by Application 2020 & 2033
- Table 78: Rest of South America Bladder Cancer Therapeutics and Diagnostics Industry Volume (K Unit) Forecast, by Application 2020 & 2033
Frequently Asked Questions
1. What is the projected Compound Annual Growth Rate (CAGR) of the Bladder Cancer Therapeutics and Diagnostics Industry?
The projected CAGR is approximately 7.1%.
2. Which companies are prominent players in the Bladder Cancer Therapeutics and Diagnostics Industry?
Key companies in the market include Novartis International AG, Merck & Co Inc, F Hoffmann-La Roche Ltd, Eli Lilly and Company, Johnson & Johnson (Janssen Pharmaceutical), Ameritech Diagnostic Reagent(Jiaxing)Co Ltd, Endo Pharmaceuticals Inc, Astellas Pharma Inc , Abbott Inc, Bristol-Myers Squibb Company, GlaxoSmithKline PLC, Pfizer Inc.
3. What are the main segments of the Bladder Cancer Therapeutics and Diagnostics Industry?
The market segments include Product, Cancer Type.
4. Can you provide details about the market size?
The market size is estimated to be USD 4065.1 million as of 2022.
5. What are some drivers contributing to market growth?
Increasing Awareness on Bladder Diseases and Available Therapies; Increasing Healthcare Expenditure; Increasing Burden of Bladder Cancer.
6. What are the notable trends driving market growth?
Cystoscopy is Anticipated to be the Dominant Segment in Studied Market Over the Forecast Period.
7. Are there any restraints impacting market growth?
Rise in the Number of Patent Expiration and Increased Use of Generic Drugs; Asymptomatic Nature of the Disease.
8. Can you provide examples of recent developments in the market?
In July 2022, The United States Food and Drug Administration (FDA) agreed to review ImmunityBio's Biologics License Application (BLA) for N-803 in patients with or without Ta or T1 illness who have non-muscle-invasive bladder cancer (NMIBC) carcinoma in situ (CIS).
9. What pricing options are available for accessing the report?
Pricing options include single-user, multi-user, and enterprise licenses priced at USD 4750, USD 5250, and USD 8750 respectively.
10. Is the market size provided in terms of value or volume?
The market size is provided in terms of value, measured in million and volume, measured in K Unit.
11. Are there any specific market keywords associated with the report?
Yes, the market keyword associated with the report is "Bladder Cancer Therapeutics and Diagnostics Industry," which aids in identifying and referencing the specific market segment covered.
12. How do I determine which pricing option suits my needs best?
The pricing options vary based on user requirements and access needs. Individual users may opt for single-user licenses, while businesses requiring broader access may choose multi-user or enterprise licenses for cost-effective access to the report.
13. Are there any additional resources or data provided in the Bladder Cancer Therapeutics and Diagnostics Industry report?
While the report offers comprehensive insights, it's advisable to review the specific contents or supplementary materials provided to ascertain if additional resources or data are available.
14. How can I stay updated on further developments or reports in the Bladder Cancer Therapeutics and Diagnostics Industry?
To stay informed about further developments, trends, and reports in the Bladder Cancer Therapeutics and Diagnostics Industry, consider subscribing to industry newsletters, following relevant companies and organizations, or regularly checking reputable industry news sources and publications.
Methodology
Step 1 - Identification of Relevant Samples Size from Population Database


Step 2 - Approaches for Defining Global Market Size (Value, Volume* & Price*)

Note*: In applicable scenarios
Step 3 - Data Sources
Primary Research
- Web Analytics
- Survey Reports
- Research Institute
- Latest Research Reports
- Opinion Leaders
Secondary Research
- Annual Reports
- White Paper
- Latest Press Release
- Industry Association
- Paid Database
- Investor Presentations

Step 4 - Data Triangulation
Involves using different sources of information in order to increase the validity of a study
These sources are likely to be stakeholders in a program - participants, other researchers, program staff, other community members, and so on.
Then we put all data in single framework & apply various statistical tools to find out the dynamic on the market.
During the analysis stage, feedback from the stakeholder groups would be compared to determine areas of agreement as well as areas of divergence