

Key Insights
The CAR T-cell therapy market is poised for significant expansion, driven by the increasing incidence of hematological malignancies such as leukemia, lymphoma, and multiple myeloma. Advancements in therapeutic efficacy and safety, coupled with robust research and development investments from key industry players, are accelerating market growth. Strategic investments in next-generation CAR T-cell therapies targeting a broader spectrum of cancers and autoimmune conditions, alongside efforts to mitigate treatment-related toxicities, are expanding the therapeutic potential. The market is segmented by therapy type, application (including leukemia, lymphoma, multiple myeloma, and autoimmune disorders), and end-user (hospitals and specialized cancer treatment centers). North America currently leads the market, supported by its advanced healthcare infrastructure and strong regulatory environment. However, the Asia-Pacific region is projected to experience the most rapid growth, fueled by rising healthcare expenditures and increasing cancer prevalence. High treatment costs and potential adverse effects represent key market restraints.
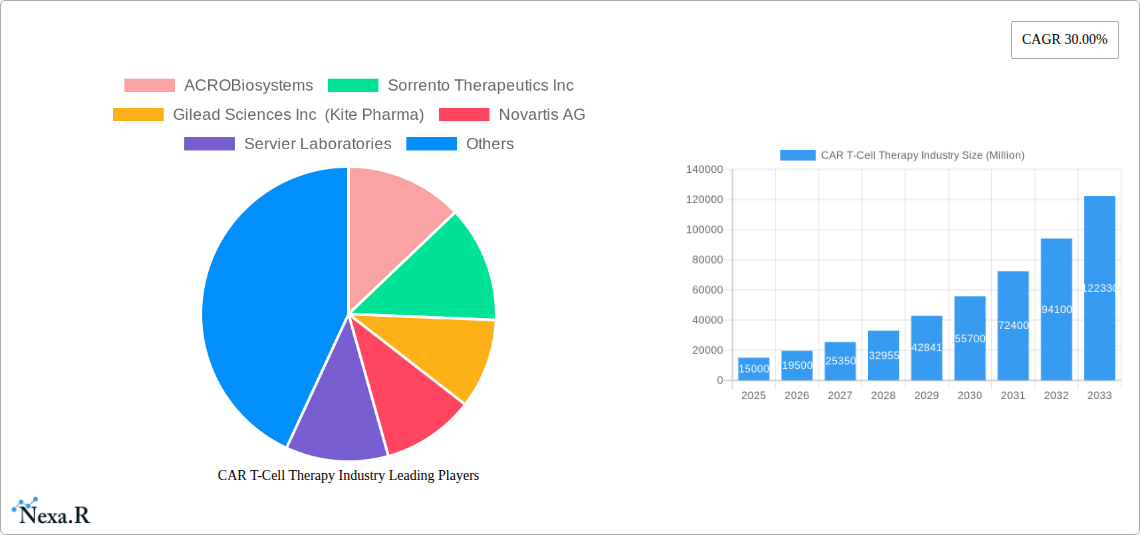
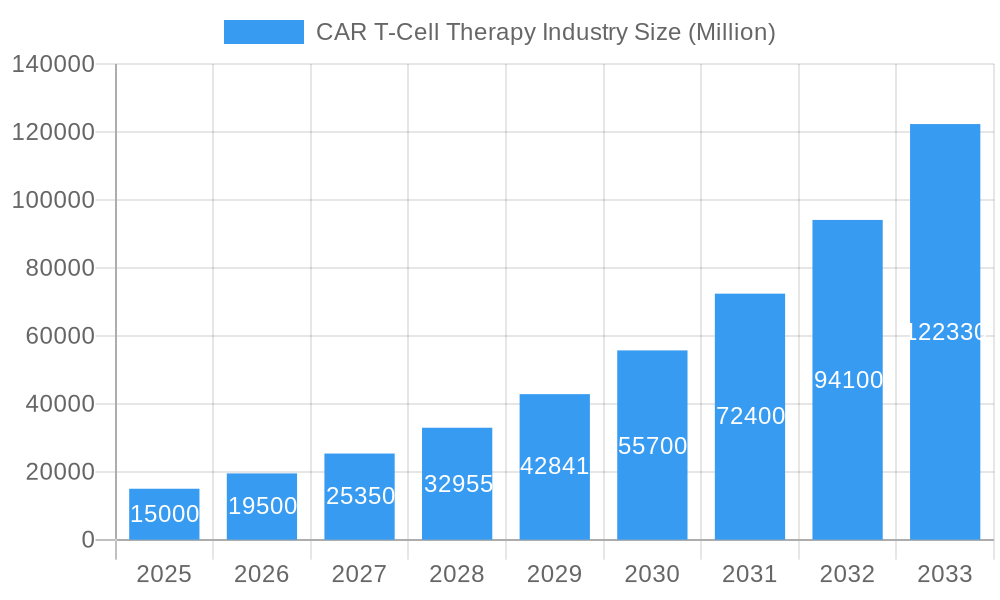
CAR T-Cell Therapy Industry Market Size (In Billion)
The market is projected to grow at a Compound Annual Growth Rate (CAGR) of 22.4% from 2025 to 2033, reaching an estimated market size of 5.9 billion by 2025. This growth trajectory is supported by the continuous development and approval of novel CAR T-cell therapies, expanding the patient population eligible for treatment. Geographic market expansion, particularly in emerging economies, will also be a key growth driver. Challenges related to manufacturing complexity, treatment affordability, and long-term efficacy studies will continue to influence market dynamics. The competitive landscape is characterized by strategic collaborations, mergers, and acquisitions, as companies aim to strengthen their market positions and pipeline development. Future success hinges on navigating regulatory pathways, enhancing treatment accessibility, and demonstrating tangible clinical benefits for a diverse patient base.
CAR T-Cell Therapy Industry Company Market Share
CAR T-Cell Therapy Market Report: 2019-2033
This comprehensive report provides a detailed analysis of the CAR T-cell therapy market, encompassing market dynamics, growth trends, regional insights, product landscapes, and key players. With a study period spanning 2019-2033, a base year of 2025, and a forecast period of 2025-2033, this report is an invaluable resource for industry professionals, investors, and researchers seeking to understand and capitalize on this rapidly evolving therapeutic area. The report segments the market by Type (Abecma, Breyanzi, Kymriah, Tecartus, Yescarta, Others), Application (Leukemia, Lymphoma, Multiple Myeloma, Autoimmune Disorders, Other Application), and End User (Hospitals, Cancer Care Treatment Centers, Other End Users). The total market size is projected to reach xx Million by 2033.
CAR T-Cell Therapy Industry Market Dynamics & Structure
The CAR T-cell therapy market is characterized by high growth potential, driven by technological advancements and increasing prevalence of blood cancers. However, the market is also characterized by a high degree of concentration among a few key players, resulting in competitive dynamics. Regulatory approvals play a crucial role in market expansion. The industry faces challenges from high treatment costs and potential side effects. The market's evolution is influenced by mergers and acquisitions (M&A), as larger pharmaceutical companies seek to expand their portfolios and establish a foothold in this promising segment.
- Market Concentration: Highly concentrated, with a few major players holding significant market share (e.g., Gilead Sciences, Novartis, Bristol Myers Squibb). Estimates suggest the top 5 players hold approximately 70% of the market share in 2025.
- Technological Innovation: Continuous development of next-generation CAR T-cell therapies, including allogeneic CAR T cells and improved targeting mechanisms, drives market growth.
- Regulatory Frameworks: Stringent regulatory pathways (e.g., FDA approval process) create a high barrier to entry but also ensure product safety and efficacy.
- Competitive Product Substitutes: Emerging immunotherapies present competitive challenges; however, CAR T-cell therapy holds a unique position for specific indications.
- End-User Demographics: The aging global population and increasing incidence of blood cancers fuel market demand, primarily targeting oncology patients.
- M&A Trends: Significant M&A activity indicates a consolidation trend within the industry, leading to increased market share for major companies. The number of M&A deals in the last five years is estimated at xx.
CAR T-Cell Therapy Industry Growth Trends & Insights
The CAR T-cell therapy market has witnessed exponential growth over the past few years, fueled by several factors. The increasing prevalence of hematological malignancies like leukemia and lymphoma, coupled with the approval of several novel therapies, has driven significant adoption rates. The market's expansion is further propelled by continuous technological advancements leading to enhanced efficacy and safety profiles. Consumer behavior shifts are also evident, with increasing awareness and acceptance of advanced therapies among patients.
The market size experienced a CAGR of xx% during the historical period (2019-2024) and is projected to maintain a CAGR of xx% during the forecast period (2025-2033), reaching an estimated xx Million by 2033. Market penetration is increasing steadily, particularly in developed regions with robust healthcare infrastructure. Technological disruptions, such as the development of allogeneic CAR T-cell therapies and improved manufacturing processes, are expected to further accelerate market growth.
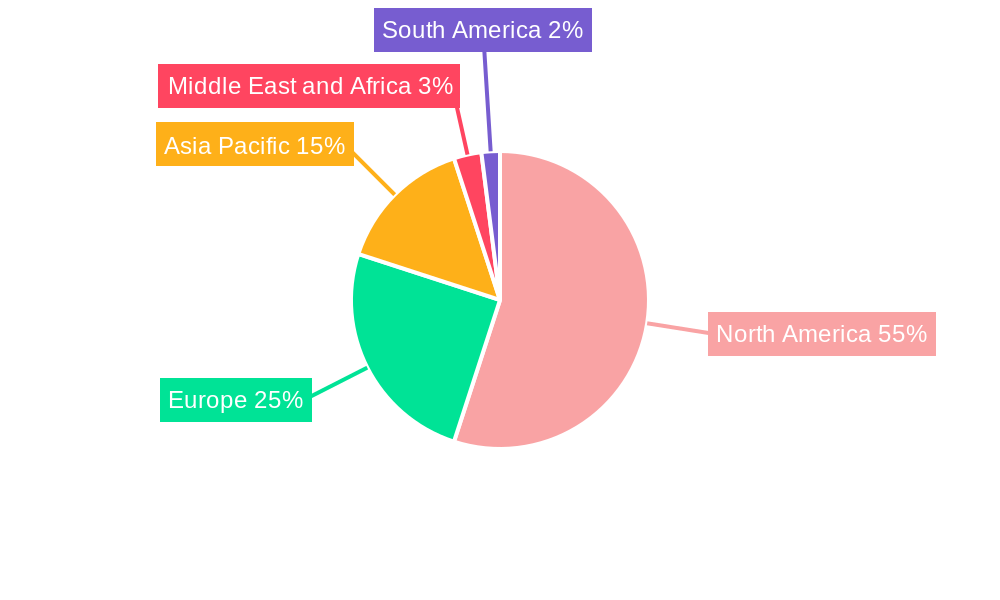
Dominant Regions, Countries, or Segments in CAR T-Cell Therapy Industry
North America, specifically the United States, holds a dominant position in the CAR T-cell therapy market due to high adoption rates, advanced healthcare infrastructure, and early approval of several key therapies. Europe follows closely, with significant market potential in countries such as Germany and the UK. The growth in Asia-Pacific is projected to be the fastest due to the rising prevalence of blood cancers and improving healthcare access.
By Type: Yescarta and Kymriah currently dominate the market share followed by Breyanzi and Tecartus. Other therapies are emerging rapidly.
By Application: Lymphoma and Leukemia currently account for a major portion of the market. Multiple myeloma is a rapidly expanding segment.
By End User: Hospitals and Cancer Care Treatment Centers are the major end-users.
Key Drivers: Robust healthcare infrastructure, high healthcare expenditure, early adoption of advanced therapies, favorable regulatory environment, and strong R&D investment are major drivers.
CAR T-Cell Therapy Industry Product Landscape
The CAR T-cell therapy product landscape is dynamic, with ongoing innovation focused on enhancing efficacy, reducing toxicity, and expanding treatment options. Key advancements include the development of allogeneic CAR T-cell therapies, which overcome the limitations of autologous therapies by eliminating the need for individual patient cell harvesting. Improvements in manufacturing processes have increased scalability and reduced manufacturing time. The unique selling proposition (USP) of CAR T-cell therapy lies in its targeted approach, offering high efficacy against specific cancer types with fewer side effects compared to traditional chemotherapy.
Key Drivers, Barriers & Challenges in CAR T-Cell Therapy Industry
Key Drivers:
- Technological advancements in CAR T-cell engineering and manufacturing.
- Increasing prevalence of hematological malignancies.
- Favorable regulatory environment supporting the approval and adoption of innovative therapies.
- Growing investments in research and development.
Key Challenges:
- High treatment costs and limited healthcare insurance coverage.
- Potential for serious adverse events, including cytokine release syndrome (CRS) and neurotoxicity.
- Complex manufacturing processes requiring specialized facilities and expertise.
- Competition from alternative cancer therapies.
- Supply chain constraints in manufacturing raw materials and producing final products.
Emerging Opportunities in CAR T-Cell Therapy Industry
Emerging opportunities include expansion into new therapeutic areas such as solid tumors, improved manufacturing methods to reduce costs, and developing personalized CAR T-cell therapies tailored to individual patients' genetic profiles. Untapped markets in emerging economies present significant growth potential. The development of combination therapies with other immunotherapies or chemotherapy agents holds promise for enhanced treatment outcomes.
Growth Accelerators in the CAR T-Cell Therapy Industry
Technological breakthroughs, such as the development of allogeneic CAR T-cells and improved vector designs, will significantly accelerate market growth. Strategic partnerships between pharmaceutical companies and biotechnology firms will facilitate innovation and market expansion. Expanding access to CAR T-cell therapies in emerging economies through government initiatives and public-private partnerships represents a major growth catalyst.
Key Players Shaping the CAR T-Cell Therapy Industry Market
- ACROBiosystems
- Sorrento Therapeutics Inc
- Gilead Sciences Inc (Kite Pharma)
- Novartis AG
- Servier Laboratories
- Eli Lilly and Company
- Noile-Immune Biotech Inc
- Celyad Oncology
- Johnson & Johnson
- Sangamo Therapeutics Inc
- Miltenyi Biotec
- Bristol-Myers Squibb Company
Notable Milestones in CAR T-Cell Therapy Industry Sector
- June 2022: Bristol Myers Squibb received FDA approval for Breyanzi (lisocabtagene maraleucel) for large B-cell lymphoma (LBCL). This significantly expanded treatment options for this cancer type.
- April 2022: Kite, a Gilead Company, received FDA approval for Yescarta (axicabtagene ciloleucel) for adult patients with large B-cell lymphoma refractory to or relapsing after first-line treatment. This broadened Yescarta’s applicability and boosted market share.
In-Depth CAR T-Cell Therapy Industry Market Outlook
The CAR T-cell therapy market is poised for continued robust growth, driven by technological advancements, expanding indications, and increasing patient access. Strategic partnerships and collaborations will play a key role in accelerating innovation and market penetration. The focus on improving manufacturing processes, reducing costs, and expanding access to emerging markets will shape the future of this transformative therapy. The long-term outlook remains extremely positive, with significant potential for continued market expansion.
CAR T-Cell Therapy Industry Segmentation
-
1. Type
- 1.1. Abecma
- 1.2. Breyanzi
- 1.3. Kymriah
- 1.4. Tecartus
- 1.5. Yescarta
- 1.6. Others
-
2. Application
- 2.1. Leukemia
- 2.2. Lymphoma
- 2.3. Multiple Myeloma
- 2.4. Autoimmune Disorders
- 2.5. Other Application
-
3. End User
- 3.1. Hospitals
- 3.2. Cancer Care Treatment Centers
- 3.3. Other End Users
CAR T-Cell Therapy Industry Segmentation By Geography
-
1. North America
- 1.1. United States
- 1.2. Canada
- 1.3. Mexico
-
2. Europe
- 2.1. Germany
- 2.2. United Kingdom
- 2.3. France
- 2.4. Italy
- 2.5. Spain
- 2.6. Rest of Europe
-
3. Asia Pacific
- 3.1. China
- 3.2. Japan
- 3.3. India
- 3.4. Australia
- 3.5. South Korea
- 3.6. Rest of Asia Pacific
-
4. Middle East and Africa
- 4.1. GCC
- 4.2. South Africa
- 4.3. Rest of Middle East and Africa
-
5. South America
- 5.1. Brazil
- 5.2. Argentina
- 5.3. Rest of South America
CAR T-Cell Therapy Industry Regional Market Share
Geographic Coverage of CAR T-Cell Therapy Industry
CAR T-Cell Therapy Industry REPORT HIGHLIGHTS
| Aspects | Details |
|---|---|
| Study Period | 2020-2034 |
| Base Year | 2025 |
| Estimated Year | 2026 |
| Forecast Period | 2026-2034 |
| Historical Period | 2020-2025 |
| Growth Rate | CAGR of 22.4% from 2020-2034 |
| Segmentation |
|
Table of Contents
- 1. Introduction
- 1.1. Research Scope
- 1.2. Market Segmentation
- 1.3. Research Objective
- 1.4. Definitions and Assumptions
- 2. Executive Summary
- 2.1. Market Snapshot
- 3. Market Dynamics
- 3.1. Market Drivers
- 3.2. Market Restrains
- 3.3. Market Trends
- 3.4. Market Opportunities
- 4. Market Factor Analysis
- 4.1. Porters Five Forces
- 4.1.1. Bargaining Power of Suppliers
- 4.1.2. Bargaining Power of Buyers
- 4.1.3. Threat of New Entrants
- 4.1.4. Threat of Substitutes
- 4.1.5. Competitive Rivalry
- 4.2. PESTEL analysis
- 4.3. BCG Analysis
- 4.3.1. Stars (High Growth, High Market Share)
- 4.3.2. Cash Cows (Low Growth, High Market Share)
- 4.3.3. Question Mark (High Growth, Low Market Share)
- 4.3.4. Dogs (Low Growth, Low Market Share)
- 4.4. Ansoff Matrix Analysis
- 4.5. Supply Chain Analysis
- 4.6. Regulatory Landscape
- 4.7. Current Market Potential and Opportunity Assessment (TAM–SAM–SOM Framework)
- 4.8. NRP Analyst Note
- 4.1. Porters Five Forces
- 5. Market Analysis, Insights and Forecast 2021-2033
- 5.1. Market Analysis, Insights and Forecast - by Type
- 5.1.1. Abecma
- 5.1.2. Breyanzi
- 5.1.3. Kymriah
- 5.1.4. Tecartus
- 5.1.5. Yescarta
- 5.1.6. Others
- 5.2. Market Analysis, Insights and Forecast - by Application
- 5.2.1. Leukemia
- 5.2.2. Lymphoma
- 5.2.3. Multiple Myeloma
- 5.2.4. Autoimmune Disorders
- 5.2.5. Other Application
- 5.3. Market Analysis, Insights and Forecast - by End User
- 5.3.1. Hospitals
- 5.3.2. Cancer Care Treatment Centers
- 5.3.3. Other End Users
- 5.4. Market Analysis, Insights and Forecast - by Region
- 5.4.1. North America
- 5.4.2. Europe
- 5.4.3. Asia Pacific
- 5.4.4. Middle East and Africa
- 5.4.5. South America
- 5.1. Market Analysis, Insights and Forecast - by Type
- 6. Global CAR T-Cell Therapy Industry Analysis, Insights and Forecast, 2021-2033
- 6.1. Market Analysis, Insights and Forecast - by Type
- 6.1.1. Abecma
- 6.1.2. Breyanzi
- 6.1.3. Kymriah
- 6.1.4. Tecartus
- 6.1.5. Yescarta
- 6.1.6. Others
- 6.2. Market Analysis, Insights and Forecast - by Application
- 6.2.1. Leukemia
- 6.2.2. Lymphoma
- 6.2.3. Multiple Myeloma
- 6.2.4. Autoimmune Disorders
- 6.2.5. Other Application
- 6.3. Market Analysis, Insights and Forecast - by End User
- 6.3.1. Hospitals
- 6.3.2. Cancer Care Treatment Centers
- 6.3.3. Other End Users
- 6.1. Market Analysis, Insights and Forecast - by Type
- 7. North America CAR T-Cell Therapy Industry Analysis, Insights and Forecast, 2020-2032
- 7.1. Market Analysis, Insights and Forecast - by Type
- 7.1.1. Abecma
- 7.1.2. Breyanzi
- 7.1.3. Kymriah
- 7.1.4. Tecartus
- 7.1.5. Yescarta
- 7.1.6. Others
- 7.2. Market Analysis, Insights and Forecast - by Application
- 7.2.1. Leukemia
- 7.2.2. Lymphoma
- 7.2.3. Multiple Myeloma
- 7.2.4. Autoimmune Disorders
- 7.2.5. Other Application
- 7.3. Market Analysis, Insights and Forecast - by End User
- 7.3.1. Hospitals
- 7.3.2. Cancer Care Treatment Centers
- 7.3.3. Other End Users
- 7.1. Market Analysis, Insights and Forecast - by Type
- 8. Europe CAR T-Cell Therapy Industry Analysis, Insights and Forecast, 2020-2032
- 8.1. Market Analysis, Insights and Forecast - by Type
- 8.1.1. Abecma
- 8.1.2. Breyanzi
- 8.1.3. Kymriah
- 8.1.4. Tecartus
- 8.1.5. Yescarta
- 8.1.6. Others
- 8.2. Market Analysis, Insights and Forecast - by Application
- 8.2.1. Leukemia
- 8.2.2. Lymphoma
- 8.2.3. Multiple Myeloma
- 8.2.4. Autoimmune Disorders
- 8.2.5. Other Application
- 8.3. Market Analysis, Insights and Forecast - by End User
- 8.3.1. Hospitals
- 8.3.2. Cancer Care Treatment Centers
- 8.3.3. Other End Users
- 8.1. Market Analysis, Insights and Forecast - by Type
- 9. Asia Pacific CAR T-Cell Therapy Industry Analysis, Insights and Forecast, 2020-2032
- 9.1. Market Analysis, Insights and Forecast - by Type
- 9.1.1. Abecma
- 9.1.2. Breyanzi
- 9.1.3. Kymriah
- 9.1.4. Tecartus
- 9.1.5. Yescarta
- 9.1.6. Others
- 9.2. Market Analysis, Insights and Forecast - by Application
- 9.2.1. Leukemia
- 9.2.2. Lymphoma
- 9.2.3. Multiple Myeloma
- 9.2.4. Autoimmune Disorders
- 9.2.5. Other Application
- 9.3. Market Analysis, Insights and Forecast - by End User
- 9.3.1. Hospitals
- 9.3.2. Cancer Care Treatment Centers
- 9.3.3. Other End Users
- 9.1. Market Analysis, Insights and Forecast - by Type
- 10. Middle East and Africa CAR T-Cell Therapy Industry Analysis, Insights and Forecast, 2020-2032
- 10.1. Market Analysis, Insights and Forecast - by Type
- 10.1.1. Abecma
- 10.1.2. Breyanzi
- 10.1.3. Kymriah
- 10.1.4. Tecartus
- 10.1.5. Yescarta
- 10.1.6. Others
- 10.2. Market Analysis, Insights and Forecast - by Application
- 10.2.1. Leukemia
- 10.2.2. Lymphoma
- 10.2.3. Multiple Myeloma
- 10.2.4. Autoimmune Disorders
- 10.2.5. Other Application
- 10.3. Market Analysis, Insights and Forecast - by End User
- 10.3.1. Hospitals
- 10.3.2. Cancer Care Treatment Centers
- 10.3.3. Other End Users
- 10.1. Market Analysis, Insights and Forecast - by Type
- 11. South America CAR T-Cell Therapy Industry Analysis, Insights and Forecast, 2020-2032
- 11.1. Market Analysis, Insights and Forecast - by Type
- 11.1.1. Abecma
- 11.1.2. Breyanzi
- 11.1.3. Kymriah
- 11.1.4. Tecartus
- 11.1.5. Yescarta
- 11.1.6. Others
- 11.2. Market Analysis, Insights and Forecast - by Application
- 11.2.1. Leukemia
- 11.2.2. Lymphoma
- 11.2.3. Multiple Myeloma
- 11.2.4. Autoimmune Disorders
- 11.2.5. Other Application
- 11.3. Market Analysis, Insights and Forecast - by End User
- 11.3.1. Hospitals
- 11.3.2. Cancer Care Treatment Centers
- 11.3.3. Other End Users
- 11.1. Market Analysis, Insights and Forecast - by Type
- 12. Competitive Analysis
- 12.1. Company Profiles
- 12.1.1 ACROBiosystems
- 12.1.1.1. Company Overview
- 12.1.1.2. Products
- 12.1.1.3. Company Financials
- 12.1.1.4. SWOT Analysis
- 12.1.2 Sorrento Therapeutics Inc
- 12.1.2.1. Company Overview
- 12.1.2.2. Products
- 12.1.2.3. Company Financials
- 12.1.2.4. SWOT Analysis
- 12.1.3 Gilead Sciences Inc (Kite Pharma)
- 12.1.3.1. Company Overview
- 12.1.3.2. Products
- 12.1.3.3. Company Financials
- 12.1.3.4. SWOT Analysis
- 12.1.4 Novartis AG
- 12.1.4.1. Company Overview
- 12.1.4.2. Products
- 12.1.4.3. Company Financials
- 12.1.4.4. SWOT Analysis
- 12.1.5 Servier Laboratories
- 12.1.5.1. Company Overview
- 12.1.5.2. Products
- 12.1.5.3. Company Financials
- 12.1.5.4. SWOT Analysis
- 12.1.6 Eli Lilly and Company
- 12.1.6.1. Company Overview
- 12.1.6.2. Products
- 12.1.6.3. Company Financials
- 12.1.6.4. SWOT Analysis
- 12.1.7 Noile-Immune Biotech Inc
- 12.1.7.1. Company Overview
- 12.1.7.2. Products
- 12.1.7.3. Company Financials
- 12.1.7.4. SWOT Analysis
- 12.1.8 Celyad Oncology
- 12.1.8.1. Company Overview
- 12.1.8.2. Products
- 12.1.8.3. Company Financials
- 12.1.8.4. SWOT Analysis
- 12.1.9 Johnson & Johnson
- 12.1.9.1. Company Overview
- 12.1.9.2. Products
- 12.1.9.3. Company Financials
- 12.1.9.4. SWOT Analysis
- 12.1.10 Sangamo Therapeutics Inc
- 12.1.10.1. Company Overview
- 12.1.10.2. Products
- 12.1.10.3. Company Financials
- 12.1.10.4. SWOT Analysis
- 12.1.11 Miltenyi Biotec
- 12.1.11.1. Company Overview
- 12.1.11.2. Products
- 12.1.11.3. Company Financials
- 12.1.11.4. SWOT Analysis
- 12.1.12 Bristol-Myers Squibb Company
- 12.1.12.1. Company Overview
- 12.1.12.2. Products
- 12.1.12.3. Company Financials
- 12.1.12.4. SWOT Analysis
- 12.1.1 ACROBiosystems
- 12.2. Market Entropy
- 12.2.1 Company's Key Areas Served
- 12.2.2 Recent Developments
- 12.3. Company Market Share Analysis 2025
- 12.3.1 Top 5 Companies Market Share Analysis
- 12.3.2 Top 3 Companies Market Share Analysis
- 12.4. List of Potential Customers
- 13. Research Methodology
List of Figures
- Figure 1: Global CAR T-Cell Therapy Industry Revenue Breakdown (billion, %) by Region 2025 & 2033
- Figure 2: Global CAR T-Cell Therapy Industry Volume Breakdown (K Unit, %) by Region 2025 & 2033
- Figure 3: North America CAR T-Cell Therapy Industry Revenue (billion), by Type 2025 & 2033
- Figure 4: North America CAR T-Cell Therapy Industry Volume (K Unit), by Type 2025 & 2033
- Figure 5: North America CAR T-Cell Therapy Industry Revenue Share (%), by Type 2025 & 2033
- Figure 6: North America CAR T-Cell Therapy Industry Volume Share (%), by Type 2025 & 2033
- Figure 7: North America CAR T-Cell Therapy Industry Revenue (billion), by Application 2025 & 2033
- Figure 8: North America CAR T-Cell Therapy Industry Volume (K Unit), by Application 2025 & 2033
- Figure 9: North America CAR T-Cell Therapy Industry Revenue Share (%), by Application 2025 & 2033
- Figure 10: North America CAR T-Cell Therapy Industry Volume Share (%), by Application 2025 & 2033
- Figure 11: North America CAR T-Cell Therapy Industry Revenue (billion), by End User 2025 & 2033
- Figure 12: North America CAR T-Cell Therapy Industry Volume (K Unit), by End User 2025 & 2033
- Figure 13: North America CAR T-Cell Therapy Industry Revenue Share (%), by End User 2025 & 2033
- Figure 14: North America CAR T-Cell Therapy Industry Volume Share (%), by End User 2025 & 2033
- Figure 15: North America CAR T-Cell Therapy Industry Revenue (billion), by Country 2025 & 2033
- Figure 16: North America CAR T-Cell Therapy Industry Volume (K Unit), by Country 2025 & 2033
- Figure 17: North America CAR T-Cell Therapy Industry Revenue Share (%), by Country 2025 & 2033
- Figure 18: North America CAR T-Cell Therapy Industry Volume Share (%), by Country 2025 & 2033
- Figure 19: Europe CAR T-Cell Therapy Industry Revenue (billion), by Type 2025 & 2033
- Figure 20: Europe CAR T-Cell Therapy Industry Volume (K Unit), by Type 2025 & 2033
- Figure 21: Europe CAR T-Cell Therapy Industry Revenue Share (%), by Type 2025 & 2033
- Figure 22: Europe CAR T-Cell Therapy Industry Volume Share (%), by Type 2025 & 2033
- Figure 23: Europe CAR T-Cell Therapy Industry Revenue (billion), by Application 2025 & 2033
- Figure 24: Europe CAR T-Cell Therapy Industry Volume (K Unit), by Application 2025 & 2033
- Figure 25: Europe CAR T-Cell Therapy Industry Revenue Share (%), by Application 2025 & 2033
- Figure 26: Europe CAR T-Cell Therapy Industry Volume Share (%), by Application 2025 & 2033
- Figure 27: Europe CAR T-Cell Therapy Industry Revenue (billion), by End User 2025 & 2033
- Figure 28: Europe CAR T-Cell Therapy Industry Volume (K Unit), by End User 2025 & 2033
- Figure 29: Europe CAR T-Cell Therapy Industry Revenue Share (%), by End User 2025 & 2033
- Figure 30: Europe CAR T-Cell Therapy Industry Volume Share (%), by End User 2025 & 2033
- Figure 31: Europe CAR T-Cell Therapy Industry Revenue (billion), by Country 2025 & 2033
- Figure 32: Europe CAR T-Cell Therapy Industry Volume (K Unit), by Country 2025 & 2033
- Figure 33: Europe CAR T-Cell Therapy Industry Revenue Share (%), by Country 2025 & 2033
- Figure 34: Europe CAR T-Cell Therapy Industry Volume Share (%), by Country 2025 & 2033
- Figure 35: Asia Pacific CAR T-Cell Therapy Industry Revenue (billion), by Type 2025 & 2033
- Figure 36: Asia Pacific CAR T-Cell Therapy Industry Volume (K Unit), by Type 2025 & 2033
- Figure 37: Asia Pacific CAR T-Cell Therapy Industry Revenue Share (%), by Type 2025 & 2033
- Figure 38: Asia Pacific CAR T-Cell Therapy Industry Volume Share (%), by Type 2025 & 2033
- Figure 39: Asia Pacific CAR T-Cell Therapy Industry Revenue (billion), by Application 2025 & 2033
- Figure 40: Asia Pacific CAR T-Cell Therapy Industry Volume (K Unit), by Application 2025 & 2033
- Figure 41: Asia Pacific CAR T-Cell Therapy Industry Revenue Share (%), by Application 2025 & 2033
- Figure 42: Asia Pacific CAR T-Cell Therapy Industry Volume Share (%), by Application 2025 & 2033
- Figure 43: Asia Pacific CAR T-Cell Therapy Industry Revenue (billion), by End User 2025 & 2033
- Figure 44: Asia Pacific CAR T-Cell Therapy Industry Volume (K Unit), by End User 2025 & 2033
- Figure 45: Asia Pacific CAR T-Cell Therapy Industry Revenue Share (%), by End User 2025 & 2033
- Figure 46: Asia Pacific CAR T-Cell Therapy Industry Volume Share (%), by End User 2025 & 2033
- Figure 47: Asia Pacific CAR T-Cell Therapy Industry Revenue (billion), by Country 2025 & 2033
- Figure 48: Asia Pacific CAR T-Cell Therapy Industry Volume (K Unit), by Country 2025 & 2033
- Figure 49: Asia Pacific CAR T-Cell Therapy Industry Revenue Share (%), by Country 2025 & 2033
- Figure 50: Asia Pacific CAR T-Cell Therapy Industry Volume Share (%), by Country 2025 & 2033
- Figure 51: Middle East and Africa CAR T-Cell Therapy Industry Revenue (billion), by Type 2025 & 2033
- Figure 52: Middle East and Africa CAR T-Cell Therapy Industry Volume (K Unit), by Type 2025 & 2033
- Figure 53: Middle East and Africa CAR T-Cell Therapy Industry Revenue Share (%), by Type 2025 & 2033
- Figure 54: Middle East and Africa CAR T-Cell Therapy Industry Volume Share (%), by Type 2025 & 2033
- Figure 55: Middle East and Africa CAR T-Cell Therapy Industry Revenue (billion), by Application 2025 & 2033
- Figure 56: Middle East and Africa CAR T-Cell Therapy Industry Volume (K Unit), by Application 2025 & 2033
- Figure 57: Middle East and Africa CAR T-Cell Therapy Industry Revenue Share (%), by Application 2025 & 2033
- Figure 58: Middle East and Africa CAR T-Cell Therapy Industry Volume Share (%), by Application 2025 & 2033
- Figure 59: Middle East and Africa CAR T-Cell Therapy Industry Revenue (billion), by End User 2025 & 2033
- Figure 60: Middle East and Africa CAR T-Cell Therapy Industry Volume (K Unit), by End User 2025 & 2033
- Figure 61: Middle East and Africa CAR T-Cell Therapy Industry Revenue Share (%), by End User 2025 & 2033
- Figure 62: Middle East and Africa CAR T-Cell Therapy Industry Volume Share (%), by End User 2025 & 2033
- Figure 63: Middle East and Africa CAR T-Cell Therapy Industry Revenue (billion), by Country 2025 & 2033
- Figure 64: Middle East and Africa CAR T-Cell Therapy Industry Volume (K Unit), by Country 2025 & 2033
- Figure 65: Middle East and Africa CAR T-Cell Therapy Industry Revenue Share (%), by Country 2025 & 2033
- Figure 66: Middle East and Africa CAR T-Cell Therapy Industry Volume Share (%), by Country 2025 & 2033
- Figure 67: South America CAR T-Cell Therapy Industry Revenue (billion), by Type 2025 & 2033
- Figure 68: South America CAR T-Cell Therapy Industry Volume (K Unit), by Type 2025 & 2033
- Figure 69: South America CAR T-Cell Therapy Industry Revenue Share (%), by Type 2025 & 2033
- Figure 70: South America CAR T-Cell Therapy Industry Volume Share (%), by Type 2025 & 2033
- Figure 71: South America CAR T-Cell Therapy Industry Revenue (billion), by Application 2025 & 2033
- Figure 72: South America CAR T-Cell Therapy Industry Volume (K Unit), by Application 2025 & 2033
- Figure 73: South America CAR T-Cell Therapy Industry Revenue Share (%), by Application 2025 & 2033
- Figure 74: South America CAR T-Cell Therapy Industry Volume Share (%), by Application 2025 & 2033
- Figure 75: South America CAR T-Cell Therapy Industry Revenue (billion), by End User 2025 & 2033
- Figure 76: South America CAR T-Cell Therapy Industry Volume (K Unit), by End User 2025 & 2033
- Figure 77: South America CAR T-Cell Therapy Industry Revenue Share (%), by End User 2025 & 2033
- Figure 78: South America CAR T-Cell Therapy Industry Volume Share (%), by End User 2025 & 2033
- Figure 79: South America CAR T-Cell Therapy Industry Revenue (billion), by Country 2025 & 2033
- Figure 80: South America CAR T-Cell Therapy Industry Volume (K Unit), by Country 2025 & 2033
- Figure 81: South America CAR T-Cell Therapy Industry Revenue Share (%), by Country 2025 & 2033
- Figure 82: South America CAR T-Cell Therapy Industry Volume Share (%), by Country 2025 & 2033
List of Tables
- Table 1: Global CAR T-Cell Therapy Industry Revenue billion Forecast, by Type 2020 & 2033
- Table 2: Global CAR T-Cell Therapy Industry Volume K Unit Forecast, by Type 2020 & 2033
- Table 3: Global CAR T-Cell Therapy Industry Revenue billion Forecast, by Application 2020 & 2033
- Table 4: Global CAR T-Cell Therapy Industry Volume K Unit Forecast, by Application 2020 & 2033
- Table 5: Global CAR T-Cell Therapy Industry Revenue billion Forecast, by End User 2020 & 2033
- Table 6: Global CAR T-Cell Therapy Industry Volume K Unit Forecast, by End User 2020 & 2033
- Table 7: Global CAR T-Cell Therapy Industry Revenue billion Forecast, by Region 2020 & 2033
- Table 8: Global CAR T-Cell Therapy Industry Volume K Unit Forecast, by Region 2020 & 2033
- Table 9: Global CAR T-Cell Therapy Industry Revenue billion Forecast, by Type 2020 & 2033
- Table 10: Global CAR T-Cell Therapy Industry Volume K Unit Forecast, by Type 2020 & 2033
- Table 11: Global CAR T-Cell Therapy Industry Revenue billion Forecast, by Application 2020 & 2033
- Table 12: Global CAR T-Cell Therapy Industry Volume K Unit Forecast, by Application 2020 & 2033
- Table 13: Global CAR T-Cell Therapy Industry Revenue billion Forecast, by End User 2020 & 2033
- Table 14: Global CAR T-Cell Therapy Industry Volume K Unit Forecast, by End User 2020 & 2033
- Table 15: Global CAR T-Cell Therapy Industry Revenue billion Forecast, by Country 2020 & 2033
- Table 16: Global CAR T-Cell Therapy Industry Volume K Unit Forecast, by Country 2020 & 2033
- Table 17: United States CAR T-Cell Therapy Industry Revenue (billion) Forecast, by Application 2020 & 2033
- Table 18: United States CAR T-Cell Therapy Industry Volume (K Unit) Forecast, by Application 2020 & 2033
- Table 19: Canada CAR T-Cell Therapy Industry Revenue (billion) Forecast, by Application 2020 & 2033
- Table 20: Canada CAR T-Cell Therapy Industry Volume (K Unit) Forecast, by Application 2020 & 2033
- Table 21: Mexico CAR T-Cell Therapy Industry Revenue (billion) Forecast, by Application 2020 & 2033
- Table 22: Mexico CAR T-Cell Therapy Industry Volume (K Unit) Forecast, by Application 2020 & 2033
- Table 23: Global CAR T-Cell Therapy Industry Revenue billion Forecast, by Type 2020 & 2033
- Table 24: Global CAR T-Cell Therapy Industry Volume K Unit Forecast, by Type 2020 & 2033
- Table 25: Global CAR T-Cell Therapy Industry Revenue billion Forecast, by Application 2020 & 2033
- Table 26: Global CAR T-Cell Therapy Industry Volume K Unit Forecast, by Application 2020 & 2033
- Table 27: Global CAR T-Cell Therapy Industry Revenue billion Forecast, by End User 2020 & 2033
- Table 28: Global CAR T-Cell Therapy Industry Volume K Unit Forecast, by End User 2020 & 2033
- Table 29: Global CAR T-Cell Therapy Industry Revenue billion Forecast, by Country 2020 & 2033
- Table 30: Global CAR T-Cell Therapy Industry Volume K Unit Forecast, by Country 2020 & 2033
- Table 31: Germany CAR T-Cell Therapy Industry Revenue (billion) Forecast, by Application 2020 & 2033
- Table 32: Germany CAR T-Cell Therapy Industry Volume (K Unit) Forecast, by Application 2020 & 2033
- Table 33: United Kingdom CAR T-Cell Therapy Industry Revenue (billion) Forecast, by Application 2020 & 2033
- Table 34: United Kingdom CAR T-Cell Therapy Industry Volume (K Unit) Forecast, by Application 2020 & 2033
- Table 35: France CAR T-Cell Therapy Industry Revenue (billion) Forecast, by Application 2020 & 2033
- Table 36: France CAR T-Cell Therapy Industry Volume (K Unit) Forecast, by Application 2020 & 2033
- Table 37: Italy CAR T-Cell Therapy Industry Revenue (billion) Forecast, by Application 2020 & 2033
- Table 38: Italy CAR T-Cell Therapy Industry Volume (K Unit) Forecast, by Application 2020 & 2033
- Table 39: Spain CAR T-Cell Therapy Industry Revenue (billion) Forecast, by Application 2020 & 2033
- Table 40: Spain CAR T-Cell Therapy Industry Volume (K Unit) Forecast, by Application 2020 & 2033
- Table 41: Rest of Europe CAR T-Cell Therapy Industry Revenue (billion) Forecast, by Application 2020 & 2033
- Table 42: Rest of Europe CAR T-Cell Therapy Industry Volume (K Unit) Forecast, by Application 2020 & 2033
- Table 43: Global CAR T-Cell Therapy Industry Revenue billion Forecast, by Type 2020 & 2033
- Table 44: Global CAR T-Cell Therapy Industry Volume K Unit Forecast, by Type 2020 & 2033
- Table 45: Global CAR T-Cell Therapy Industry Revenue billion Forecast, by Application 2020 & 2033
- Table 46: Global CAR T-Cell Therapy Industry Volume K Unit Forecast, by Application 2020 & 2033
- Table 47: Global CAR T-Cell Therapy Industry Revenue billion Forecast, by End User 2020 & 2033
- Table 48: Global CAR T-Cell Therapy Industry Volume K Unit Forecast, by End User 2020 & 2033
- Table 49: Global CAR T-Cell Therapy Industry Revenue billion Forecast, by Country 2020 & 2033
- Table 50: Global CAR T-Cell Therapy Industry Volume K Unit Forecast, by Country 2020 & 2033
- Table 51: China CAR T-Cell Therapy Industry Revenue (billion) Forecast, by Application 2020 & 2033
- Table 52: China CAR T-Cell Therapy Industry Volume (K Unit) Forecast, by Application 2020 & 2033
- Table 53: Japan CAR T-Cell Therapy Industry Revenue (billion) Forecast, by Application 2020 & 2033
- Table 54: Japan CAR T-Cell Therapy Industry Volume (K Unit) Forecast, by Application 2020 & 2033
- Table 55: India CAR T-Cell Therapy Industry Revenue (billion) Forecast, by Application 2020 & 2033
- Table 56: India CAR T-Cell Therapy Industry Volume (K Unit) Forecast, by Application 2020 & 2033
- Table 57: Australia CAR T-Cell Therapy Industry Revenue (billion) Forecast, by Application 2020 & 2033
- Table 58: Australia CAR T-Cell Therapy Industry Volume (K Unit) Forecast, by Application 2020 & 2033
- Table 59: South Korea CAR T-Cell Therapy Industry Revenue (billion) Forecast, by Application 2020 & 2033
- Table 60: South Korea CAR T-Cell Therapy Industry Volume (K Unit) Forecast, by Application 2020 & 2033
- Table 61: Rest of Asia Pacific CAR T-Cell Therapy Industry Revenue (billion) Forecast, by Application 2020 & 2033
- Table 62: Rest of Asia Pacific CAR T-Cell Therapy Industry Volume (K Unit) Forecast, by Application 2020 & 2033
- Table 63: Global CAR T-Cell Therapy Industry Revenue billion Forecast, by Type 2020 & 2033
- Table 64: Global CAR T-Cell Therapy Industry Volume K Unit Forecast, by Type 2020 & 2033
- Table 65: Global CAR T-Cell Therapy Industry Revenue billion Forecast, by Application 2020 & 2033
- Table 66: Global CAR T-Cell Therapy Industry Volume K Unit Forecast, by Application 2020 & 2033
- Table 67: Global CAR T-Cell Therapy Industry Revenue billion Forecast, by End User 2020 & 2033
- Table 68: Global CAR T-Cell Therapy Industry Volume K Unit Forecast, by End User 2020 & 2033
- Table 69: Global CAR T-Cell Therapy Industry Revenue billion Forecast, by Country 2020 & 2033
- Table 70: Global CAR T-Cell Therapy Industry Volume K Unit Forecast, by Country 2020 & 2033
- Table 71: GCC CAR T-Cell Therapy Industry Revenue (billion) Forecast, by Application 2020 & 2033
- Table 72: GCC CAR T-Cell Therapy Industry Volume (K Unit) Forecast, by Application 2020 & 2033
- Table 73: South Africa CAR T-Cell Therapy Industry Revenue (billion) Forecast, by Application 2020 & 2033
- Table 74: South Africa CAR T-Cell Therapy Industry Volume (K Unit) Forecast, by Application 2020 & 2033
- Table 75: Rest of Middle East and Africa CAR T-Cell Therapy Industry Revenue (billion) Forecast, by Application 2020 & 2033
- Table 76: Rest of Middle East and Africa CAR T-Cell Therapy Industry Volume (K Unit) Forecast, by Application 2020 & 2033
- Table 77: Global CAR T-Cell Therapy Industry Revenue billion Forecast, by Type 2020 & 2033
- Table 78: Global CAR T-Cell Therapy Industry Volume K Unit Forecast, by Type 2020 & 2033
- Table 79: Global CAR T-Cell Therapy Industry Revenue billion Forecast, by Application 2020 & 2033
- Table 80: Global CAR T-Cell Therapy Industry Volume K Unit Forecast, by Application 2020 & 2033
- Table 81: Global CAR T-Cell Therapy Industry Revenue billion Forecast, by End User 2020 & 2033
- Table 82: Global CAR T-Cell Therapy Industry Volume K Unit Forecast, by End User 2020 & 2033
- Table 83: Global CAR T-Cell Therapy Industry Revenue billion Forecast, by Country 2020 & 2033
- Table 84: Global CAR T-Cell Therapy Industry Volume K Unit Forecast, by Country 2020 & 2033
- Table 85: Brazil CAR T-Cell Therapy Industry Revenue (billion) Forecast, by Application 2020 & 2033
- Table 86: Brazil CAR T-Cell Therapy Industry Volume (K Unit) Forecast, by Application 2020 & 2033
- Table 87: Argentina CAR T-Cell Therapy Industry Revenue (billion) Forecast, by Application 2020 & 2033
- Table 88: Argentina CAR T-Cell Therapy Industry Volume (K Unit) Forecast, by Application 2020 & 2033
- Table 89: Rest of South America CAR T-Cell Therapy Industry Revenue (billion) Forecast, by Application 2020 & 2033
- Table 90: Rest of South America CAR T-Cell Therapy Industry Volume (K Unit) Forecast, by Application 2020 & 2033
Frequently Asked Questions
1. What is the projected Compound Annual Growth Rate (CAGR) of the CAR T-Cell Therapy Industry?
The projected CAGR is approximately 22.4%.
2. Which companies are prominent players in the CAR T-Cell Therapy Industry?
Key companies in the market include ACROBiosystems, Sorrento Therapeutics Inc, Gilead Sciences Inc (Kite Pharma), Novartis AG, Servier Laboratories, Eli Lilly and Company, Noile-Immune Biotech Inc, Celyad Oncology, Johnson & Johnson, Sangamo Therapeutics Inc, Miltenyi Biotec, Bristol-Myers Squibb Company.
3. What are the main segments of the CAR T-Cell Therapy Industry?
The market segments include Type, Application, End User.
4. Can you provide details about the market size?
The market size is estimated to be USD 5.9 billion as of 2022.
5. What are some drivers contributing to market growth?
Growing Burden of Cancer Worldwide; Increasing Invesment and Research and Development to Develop CAR T-Cell Therapy.
6. What are the notable trends driving market growth?
Multiple Myeloma is Expected to Observe a Significant Growth Over the Forecast Period.
7. Are there any restraints impacting market growth?
High Cost of Developing CAR T-Cell Therapy.
8. Can you provide examples of recent developments in the market?
June 2022: Bristol Myers Squibb received FDA approval for Breyanzi (lisocabtagene maraleucel), a CD19-directed chimeric antigen receptor (CAR) T-cell therapy, for the treatment of adult patients with large B-cell lymphoma (LBCL).
9. What pricing options are available for accessing the report?
Pricing options include single-user, multi-user, and enterprise licenses priced at USD 4750, USD 5250, and USD 8750 respectively.
10. Is the market size provided in terms of value or volume?
The market size is provided in terms of value, measured in billion and volume, measured in K Unit.
11. Are there any specific market keywords associated with the report?
Yes, the market keyword associated with the report is "CAR T-Cell Therapy Industry," which aids in identifying and referencing the specific market segment covered.
12. How do I determine which pricing option suits my needs best?
The pricing options vary based on user requirements and access needs. Individual users may opt for single-user licenses, while businesses requiring broader access may choose multi-user or enterprise licenses for cost-effective access to the report.
13. Are there any additional resources or data provided in the CAR T-Cell Therapy Industry report?
While the report offers comprehensive insights, it's advisable to review the specific contents or supplementary materials provided to ascertain if additional resources or data are available.
14. How can I stay updated on further developments or reports in the CAR T-Cell Therapy Industry?
To stay informed about further developments, trends, and reports in the CAR T-Cell Therapy Industry, consider subscribing to industry newsletters, following relevant companies and organizations, or regularly checking reputable industry news sources and publications.
Methodology
Step 1 - Identification of Relevant Samples Size from Population Database


Step 2 - Approaches for Defining Global Market Size (Value, Volume* & Price*)

Note*: In applicable scenarios
Step 3 - Data Sources
Primary Research
- Web Analytics
- Survey Reports
- Research Institute
- Latest Research Reports
- Opinion Leaders
Secondary Research
- Annual Reports
- White Paper
- Latest Press Release
- Industry Association
- Paid Database
- Investor Presentations

Step 4 - Data Triangulation
Involves using different sources of information in order to increase the validity of a study
These sources are likely to be stakeholders in a program - participants, other researchers, program staff, other community members, and so on.
Then we put all data in single framework & apply various statistical tools to find out the dynamic on the market.
During the analysis stage, feedback from the stakeholder groups would be compared to determine areas of agreement as well as areas of divergence