

Key Insights
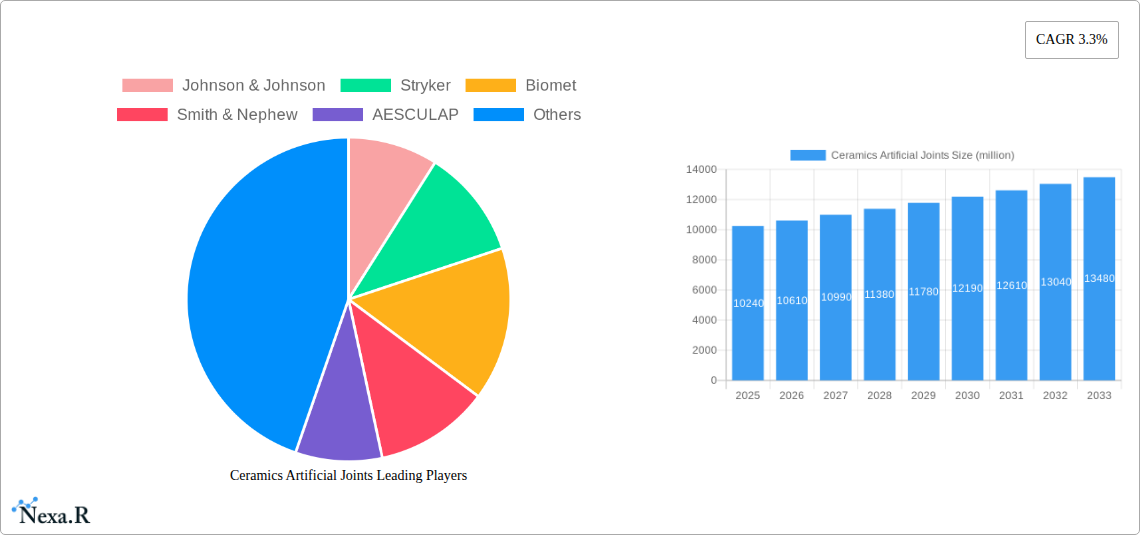
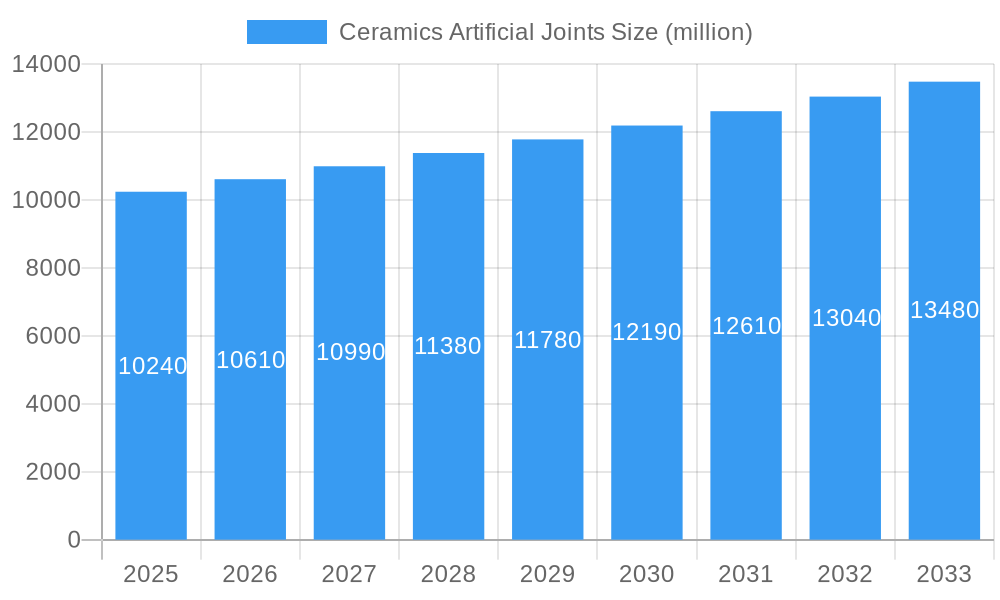
The global ceramics artificial joints market, valued at approximately $10.24 billion in 2025, is projected to experience steady growth, driven by a rising geriatric population, increasing prevalence of osteoarthritis and other joint disorders, and advancements in ceramic material technology leading to improved joint longevity and reduced wear. The market's 3.3% Compound Annual Growth Rate (CAGR) from 2019 to 2024 suggests a continued, albeit moderate, expansion. This growth is fueled by the increasing preference for ceramic-on-ceramic and ceramic-on-polymer bearings due to their superior biocompatibility, reduced friction, and wear resistance compared to traditional metal-on-metal or metal-on-polymer alternatives. While challenges such as the relatively high cost of ceramic implants and potential for fracture remain, ongoing research and development efforts focused on improving the strength and durability of ceramic materials are mitigating these concerns. The competitive landscape is dominated by major players such as Johnson & Johnson, Stryker, and Zimmer Biomet, each investing heavily in research and expanding their product portfolios to cater to the growing demand.
Ceramics Artificial Joints Market Size (In Billion)
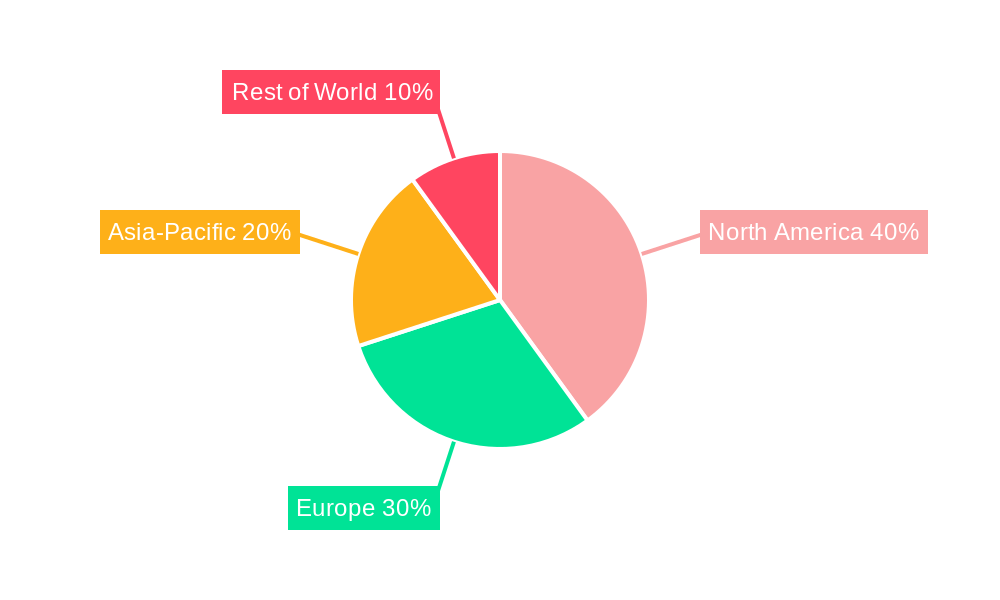
Further market segmentation reveals significant regional variations, with developed economies like North America and Europe currently holding larger market shares due to high healthcare expenditure and established medical infrastructure. However, emerging economies in Asia-Pacific and Latin America are anticipated to witness faster growth rates in the coming years, driven by rising disposable incomes and improved access to healthcare. This presents lucrative opportunities for market entrants and existing players aiming to expand their global reach. The forecast period (2025-2033) promises continued growth, with a focus on innovation in implant design, surgical techniques, and post-operative care to further enhance patient outcomes and overall market expansion.
Ceramics Artificial Joints Company Market Share
This comprehensive report provides a detailed analysis of the Ceramics Artificial Joints market, encompassing market dynamics, growth trends, regional segmentation, product landscape, key players, and future outlook. The study period covers 2019-2033, with 2025 as the base and estimated year. The forecast period spans 2025-2033, and the historical period is 2019-2024. This report is essential for industry professionals, investors, and strategic decision-makers seeking a deep understanding of this rapidly evolving market. The parent market is Orthopedic Implants, and the child market is Artificial Joints.
Target Audience: Medical device manufacturers, orthopedic surgeons, hospital administrators, investors, market research analysts, regulatory bodies.
Ceramics Artificial Joints Market Dynamics & Structure
The Ceramics Artificial Joints market is characterized by moderate concentration, with key players like Johnson & Johnson, Stryker, and Zimmer Biomet holding significant market share (estimated at xx% collectively in 2025). Technological innovation, primarily in biomaterial science and manufacturing processes, is a key driver. Stringent regulatory frameworks, including those set by the FDA and equivalent international bodies, influence product development and market entry. Competitive substitutes include other artificial joint materials (e.g., metal-on-metal, polyethylene). The end-user demographics are primarily aging populations in developed countries, with a growing incidence of osteoarthritis and other degenerative joint diseases. M&A activity has been moderate in recent years, with approximately xx deals recorded between 2019 and 2024, largely focused on enhancing product portfolios and expanding geographical reach.
- Market Concentration: Moderately concentrated, with top 3 players holding xx% market share in 2025.
- Technological Innovation: Focus on biocompatibility, durability, and minimally invasive surgical techniques.
- Regulatory Landscape: Stringent regulatory approvals required for market entry.
- Competitive Substitutes: Metal-on-metal, polyethylene, and other biomaterials.
- End-User Demographics: Aging population, increasing prevalence of osteoarthritis.
- M&A Activity: xx deals between 2019-2024, focused on portfolio expansion and geographic reach.
Ceramics Artificial Joints Growth Trends & Insights
The Ceramics Artificial Joints market has witnessed robust growth during the historical period (2019-2024), with a CAGR of xx%. This growth is projected to continue throughout the forecast period (2025-2033), driven by factors such as the rising prevalence of osteoarthritis, technological advancements leading to improved joint replacements, and increasing demand for minimally invasive surgical procedures. Market penetration is currently estimated at xx% in major markets, with significant room for growth in emerging economies. Technological disruptions, such as the introduction of 3D-printed components and AI-assisted surgical planning, are further accelerating adoption rates. Shifting consumer preferences towards longer-lasting and more biocompatible implants also contribute to the growth trajectory. Market size is expected to reach $xx billion by 2033.
Dominant Regions, Countries, or Segments in Ceramics Artificial Joints
North America currently dominates the Ceramics Artificial Joints market, holding the largest market share in 2025 (estimated at xx%). This dominance is attributed to factors such as high prevalence of osteoarthritis, advanced healthcare infrastructure, and high disposable incomes. However, strong growth is anticipated in the Asia-Pacific region due to rapidly aging populations, increasing healthcare expenditure, and rising awareness of joint replacement surgeries. Europe also represents a significant market, driven by robust healthcare systems and established orthopedic practices.
- North America: High prevalence of osteoarthritis, advanced healthcare infrastructure, high disposable incomes.
- Asia-Pacific: Rapidly aging population, rising healthcare expenditure, increasing awareness.
- Europe: Robust healthcare systems, established orthopedic practices.
Ceramics Artificial Joints Product Landscape
The ceramics artificial joints market offers a range of products tailored to different anatomical locations (hip, knee, shoulder) and patient needs. Recent innovations focus on improved biocompatibility, enhanced wear resistance, and reduced friction. Key advancements include the use of advanced ceramic materials, such as zirconia and alumina, and the incorporation of surface modifications to enhance osseointegration (bone bonding). These improvements aim to extend the lifespan of the implants and reduce the risk of complications.
Key Drivers, Barriers & Challenges in Ceramics Artificial Joints
Key Drivers:
- Increasing prevalence of osteoarthritis and other degenerative joint diseases.
- Technological advancements leading to improved implant design and performance.
- Growing demand for minimally invasive surgical procedures.
- Rising healthcare expenditure in developed and emerging markets.
Key Barriers & Challenges:
- High cost of implants and procedures.
- Potential for complications, such as implant loosening or infection.
- Stringent regulatory requirements for product approval and market access.
- Competition from other joint replacement materials. The total impact of these challenges on market growth is estimated at xx% reduction in the CAGR.
Emerging Opportunities in Ceramics Artificial Joints
Emerging opportunities include expanding into untapped markets in developing countries, developing new applications for ceramics in other joint replacements (e.g., wrist, ankle), and focusing on personalized medicine approaches to optimize implant selection and surgical planning. Furthermore, the integration of advanced technologies like AI and machine learning in surgical planning and post-operative care creates new avenues for growth.
Growth Accelerators in the Ceramics Artificial Joints Industry
Long-term growth will be driven by technological advancements, such as the development of next-generation ceramic materials with enhanced properties. Strategic partnerships between device manufacturers, research institutions, and healthcare providers will accelerate innovation and market penetration. Expansion into new markets and the development of minimally invasive surgical techniques will also contribute to sustained market growth.
Key Players Shaping the Ceramics Artificial Joints Market
- Johnson & Johnson
- Stryker
- Biomet (Zimmer Biomet)
- Smith & Nephew
- AESCULAP
- Wright Medical Technology
- Exactech
- Limacorporate
- JRI
- Medtronic
Notable Milestones in Ceramics Artificial Joints Sector
- 2020: Launch of a new generation of ceramic hip implants by Johnson & Johnson with enhanced biocompatibility.
- 2022: Stryker acquires a smaller company specializing in ceramic knee implants, expanding its product portfolio.
- 2023: FDA approval for a novel 3D-printed ceramic joint component. (Specific dates may need verification).
In-Depth Ceramics Artificial Joints Market Outlook
The Ceramics Artificial Joints market is poised for significant growth in the coming years, driven by continuous innovation in materials science, surgical techniques, and market expansion strategies. Opportunities exist in developing personalized implants, integrating digital technologies, and expanding into underserved populations. Strategic partnerships and investments in research and development will play a crucial role in shaping the future of this dynamic market. The long-term outlook is highly positive, with projections indicating substantial market expansion over the forecast period.
Ceramics Artificial Joints Segmentation
-
1. Application
- 1.1. Artificial Joints of Knee
- 1.2. Artificial Joints of Hip
- 1.3. Artificial Joints of Shoulder
- 1.4. Other
-
2. Type
- 2.1. Ceramics Composite Materials
- 2.2. Ceramics
Ceramics Artificial Joints Segmentation By Geography
-
1. North America
- 1.1. United States
- 1.2. Canada
- 1.3. Mexico
-
2. South America
- 2.1. Brazil
- 2.2. Argentina
- 2.3. Rest of South America
-
3. Europe
- 3.1. United Kingdom
- 3.2. Germany
- 3.3. France
- 3.4. Italy
- 3.5. Spain
- 3.6. Russia
- 3.7. Benelux
- 3.8. Nordics
- 3.9. Rest of Europe
-
4. Middle East & Africa
- 4.1. Turkey
- 4.2. Israel
- 4.3. GCC
- 4.4. North Africa
- 4.5. South Africa
- 4.6. Rest of Middle East & Africa
-
5. Asia Pacific
- 5.1. China
- 5.2. India
- 5.3. Japan
- 5.4. South Korea
- 5.5. ASEAN
- 5.6. Oceania
- 5.7. Rest of Asia Pacific
Ceramics Artificial Joints Regional Market Share
Geographic Coverage of Ceramics Artificial Joints
Ceramics Artificial Joints REPORT HIGHLIGHTS
| Aspects | Details |
|---|---|
| Study Period | 2020-2034 |
| Base Year | 2025 |
| Estimated Year | 2026 |
| Forecast Period | 2026-2034 |
| Historical Period | 2020-2025 |
| Growth Rate | CAGR of 3.3% from 2020-2034 |
| Segmentation |
|
Table of Contents
- 1. Introduction
- 1.1. Research Scope
- 1.2. Market Segmentation
- 1.3. Research Methodology
- 1.4. Definitions and Assumptions
- 2. Executive Summary
- 2.1. Introduction
- 3. Market Dynamics
- 3.1. Introduction
- 3.2. Market Drivers
- 3.3. Market Restrains
- 3.4. Market Trends
- 4. Market Factor Analysis
- 4.1. Porters Five Forces
- 4.2. Supply/Value Chain
- 4.3. PESTEL analysis
- 4.4. Market Entropy
- 4.5. Patent/Trademark Analysis
- 5. Global Ceramics Artificial Joints Analysis, Insights and Forecast, 2020-2032
- 5.1. Market Analysis, Insights and Forecast - by Application
- 5.1.1. Artificial Joints of Knee
- 5.1.2. Artificial Joints of Hip
- 5.1.3. Artificial Joints of Shoulder
- 5.1.4. Other
- 5.2. Market Analysis, Insights and Forecast - by Type
- 5.2.1. Ceramics Composite Materials
- 5.2.2. Ceramics
- 5.3. Market Analysis, Insights and Forecast - by Region
- 5.3.1. North America
- 5.3.2. South America
- 5.3.3. Europe
- 5.3.4. Middle East & Africa
- 5.3.5. Asia Pacific
- 5.1. Market Analysis, Insights and Forecast - by Application
- 6. North America Ceramics Artificial Joints Analysis, Insights and Forecast, 2020-2032
- 6.1. Market Analysis, Insights and Forecast - by Application
- 6.1.1. Artificial Joints of Knee
- 6.1.2. Artificial Joints of Hip
- 6.1.3. Artificial Joints of Shoulder
- 6.1.4. Other
- 6.2. Market Analysis, Insights and Forecast - by Type
- 6.2.1. Ceramics Composite Materials
- 6.2.2. Ceramics
- 6.1. Market Analysis, Insights and Forecast - by Application
- 7. South America Ceramics Artificial Joints Analysis, Insights and Forecast, 2020-2032
- 7.1. Market Analysis, Insights and Forecast - by Application
- 7.1.1. Artificial Joints of Knee
- 7.1.2. Artificial Joints of Hip
- 7.1.3. Artificial Joints of Shoulder
- 7.1.4. Other
- 7.2. Market Analysis, Insights and Forecast - by Type
- 7.2.1. Ceramics Composite Materials
- 7.2.2. Ceramics
- 7.1. Market Analysis, Insights and Forecast - by Application
- 8. Europe Ceramics Artificial Joints Analysis, Insights and Forecast, 2020-2032
- 8.1. Market Analysis, Insights and Forecast - by Application
- 8.1.1. Artificial Joints of Knee
- 8.1.2. Artificial Joints of Hip
- 8.1.3. Artificial Joints of Shoulder
- 8.1.4. Other
- 8.2. Market Analysis, Insights and Forecast - by Type
- 8.2.1. Ceramics Composite Materials
- 8.2.2. Ceramics
- 8.1. Market Analysis, Insights and Forecast - by Application
- 9. Middle East & Africa Ceramics Artificial Joints Analysis, Insights and Forecast, 2020-2032
- 9.1. Market Analysis, Insights and Forecast - by Application
- 9.1.1. Artificial Joints of Knee
- 9.1.2. Artificial Joints of Hip
- 9.1.3. Artificial Joints of Shoulder
- 9.1.4. Other
- 9.2. Market Analysis, Insights and Forecast - by Type
- 9.2.1. Ceramics Composite Materials
- 9.2.2. Ceramics
- 9.1. Market Analysis, Insights and Forecast - by Application
- 10. Asia Pacific Ceramics Artificial Joints Analysis, Insights and Forecast, 2020-2032
- 10.1. Market Analysis, Insights and Forecast - by Application
- 10.1.1. Artificial Joints of Knee
- 10.1.2. Artificial Joints of Hip
- 10.1.3. Artificial Joints of Shoulder
- 10.1.4. Other
- 10.2. Market Analysis, Insights and Forecast - by Type
- 10.2.1. Ceramics Composite Materials
- 10.2.2. Ceramics
- 10.1. Market Analysis, Insights and Forecast - by Application
- 11. Competitive Analysis
- 11.1. Global Market Share Analysis 2025
- 11.2. Company Profiles
- 11.2.1 Johnson & Johnson
- 11.2.1.1. Overview
- 11.2.1.2. Products
- 11.2.1.3. SWOT Analysis
- 11.2.1.4. Recent Developments
- 11.2.1.5. Financials (Based on Availability)
- 11.2.2 Stryker
- 11.2.2.1. Overview
- 11.2.2.2. Products
- 11.2.2.3. SWOT Analysis
- 11.2.2.4. Recent Developments
- 11.2.2.5. Financials (Based on Availability)
- 11.2.3 Biomet
- 11.2.3.1. Overview
- 11.2.3.2. Products
- 11.2.3.3. SWOT Analysis
- 11.2.3.4. Recent Developments
- 11.2.3.5. Financials (Based on Availability)
- 11.2.4 Smith & Nephew
- 11.2.4.1. Overview
- 11.2.4.2. Products
- 11.2.4.3. SWOT Analysis
- 11.2.4.4. Recent Developments
- 11.2.4.5. Financials (Based on Availability)
- 11.2.5 AESCULAP
- 11.2.5.1. Overview
- 11.2.5.2. Products
- 11.2.5.3. SWOT Analysis
- 11.2.5.4. Recent Developments
- 11.2.5.5. Financials (Based on Availability)
- 11.2.6 Wright Medical Technology
- 11.2.6.1. Overview
- 11.2.6.2. Products
- 11.2.6.3. SWOT Analysis
- 11.2.6.4. Recent Developments
- 11.2.6.5. Financials (Based on Availability)
- 11.2.7 Exactech
- 11.2.7.1. Overview
- 11.2.7.2. Products
- 11.2.7.3. SWOT Analysis
- 11.2.7.4. Recent Developments
- 11.2.7.5. Financials (Based on Availability)
- 11.2.8 Limacorporate
- 11.2.8.1. Overview
- 11.2.8.2. Products
- 11.2.8.3. SWOT Analysis
- 11.2.8.4. Recent Developments
- 11.2.8.5. Financials (Based on Availability)
- 11.2.9 JRI
- 11.2.9.1. Overview
- 11.2.9.2. Products
- 11.2.9.3. SWOT Analysis
- 11.2.9.4. Recent Developments
- 11.2.9.5. Financials (Based on Availability)
- 11.2.10 Medtronic
- 11.2.10.1. Overview
- 11.2.10.2. Products
- 11.2.10.3. SWOT Analysis
- 11.2.10.4. Recent Developments
- 11.2.10.5. Financials (Based on Availability)
- 11.2.1 Johnson & Johnson
List of Figures
- Figure 1: Global Ceramics Artificial Joints Revenue Breakdown (million, %) by Region 2025 & 2033
- Figure 2: North America Ceramics Artificial Joints Revenue (million), by Application 2025 & 2033
- Figure 3: North America Ceramics Artificial Joints Revenue Share (%), by Application 2025 & 2033
- Figure 4: North America Ceramics Artificial Joints Revenue (million), by Type 2025 & 2033
- Figure 5: North America Ceramics Artificial Joints Revenue Share (%), by Type 2025 & 2033
- Figure 6: North America Ceramics Artificial Joints Revenue (million), by Country 2025 & 2033
- Figure 7: North America Ceramics Artificial Joints Revenue Share (%), by Country 2025 & 2033
- Figure 8: South America Ceramics Artificial Joints Revenue (million), by Application 2025 & 2033
- Figure 9: South America Ceramics Artificial Joints Revenue Share (%), by Application 2025 & 2033
- Figure 10: South America Ceramics Artificial Joints Revenue (million), by Type 2025 & 2033
- Figure 11: South America Ceramics Artificial Joints Revenue Share (%), by Type 2025 & 2033
- Figure 12: South America Ceramics Artificial Joints Revenue (million), by Country 2025 & 2033
- Figure 13: South America Ceramics Artificial Joints Revenue Share (%), by Country 2025 & 2033
- Figure 14: Europe Ceramics Artificial Joints Revenue (million), by Application 2025 & 2033
- Figure 15: Europe Ceramics Artificial Joints Revenue Share (%), by Application 2025 & 2033
- Figure 16: Europe Ceramics Artificial Joints Revenue (million), by Type 2025 & 2033
- Figure 17: Europe Ceramics Artificial Joints Revenue Share (%), by Type 2025 & 2033
- Figure 18: Europe Ceramics Artificial Joints Revenue (million), by Country 2025 & 2033
- Figure 19: Europe Ceramics Artificial Joints Revenue Share (%), by Country 2025 & 2033
- Figure 20: Middle East & Africa Ceramics Artificial Joints Revenue (million), by Application 2025 & 2033
- Figure 21: Middle East & Africa Ceramics Artificial Joints Revenue Share (%), by Application 2025 & 2033
- Figure 22: Middle East & Africa Ceramics Artificial Joints Revenue (million), by Type 2025 & 2033
- Figure 23: Middle East & Africa Ceramics Artificial Joints Revenue Share (%), by Type 2025 & 2033
- Figure 24: Middle East & Africa Ceramics Artificial Joints Revenue (million), by Country 2025 & 2033
- Figure 25: Middle East & Africa Ceramics Artificial Joints Revenue Share (%), by Country 2025 & 2033
- Figure 26: Asia Pacific Ceramics Artificial Joints Revenue (million), by Application 2025 & 2033
- Figure 27: Asia Pacific Ceramics Artificial Joints Revenue Share (%), by Application 2025 & 2033
- Figure 28: Asia Pacific Ceramics Artificial Joints Revenue (million), by Type 2025 & 2033
- Figure 29: Asia Pacific Ceramics Artificial Joints Revenue Share (%), by Type 2025 & 2033
- Figure 30: Asia Pacific Ceramics Artificial Joints Revenue (million), by Country 2025 & 2033
- Figure 31: Asia Pacific Ceramics Artificial Joints Revenue Share (%), by Country 2025 & 2033
List of Tables
- Table 1: Global Ceramics Artificial Joints Revenue million Forecast, by Application 2020 & 2033
- Table 2: Global Ceramics Artificial Joints Revenue million Forecast, by Type 2020 & 2033
- Table 3: Global Ceramics Artificial Joints Revenue million Forecast, by Region 2020 & 2033
- Table 4: Global Ceramics Artificial Joints Revenue million Forecast, by Application 2020 & 2033
- Table 5: Global Ceramics Artificial Joints Revenue million Forecast, by Type 2020 & 2033
- Table 6: Global Ceramics Artificial Joints Revenue million Forecast, by Country 2020 & 2033
- Table 7: United States Ceramics Artificial Joints Revenue (million) Forecast, by Application 2020 & 2033
- Table 8: Canada Ceramics Artificial Joints Revenue (million) Forecast, by Application 2020 & 2033
- Table 9: Mexico Ceramics Artificial Joints Revenue (million) Forecast, by Application 2020 & 2033
- Table 10: Global Ceramics Artificial Joints Revenue million Forecast, by Application 2020 & 2033
- Table 11: Global Ceramics Artificial Joints Revenue million Forecast, by Type 2020 & 2033
- Table 12: Global Ceramics Artificial Joints Revenue million Forecast, by Country 2020 & 2033
- Table 13: Brazil Ceramics Artificial Joints Revenue (million) Forecast, by Application 2020 & 2033
- Table 14: Argentina Ceramics Artificial Joints Revenue (million) Forecast, by Application 2020 & 2033
- Table 15: Rest of South America Ceramics Artificial Joints Revenue (million) Forecast, by Application 2020 & 2033
- Table 16: Global Ceramics Artificial Joints Revenue million Forecast, by Application 2020 & 2033
- Table 17: Global Ceramics Artificial Joints Revenue million Forecast, by Type 2020 & 2033
- Table 18: Global Ceramics Artificial Joints Revenue million Forecast, by Country 2020 & 2033
- Table 19: United Kingdom Ceramics Artificial Joints Revenue (million) Forecast, by Application 2020 & 2033
- Table 20: Germany Ceramics Artificial Joints Revenue (million) Forecast, by Application 2020 & 2033
- Table 21: France Ceramics Artificial Joints Revenue (million) Forecast, by Application 2020 & 2033
- Table 22: Italy Ceramics Artificial Joints Revenue (million) Forecast, by Application 2020 & 2033
- Table 23: Spain Ceramics Artificial Joints Revenue (million) Forecast, by Application 2020 & 2033
- Table 24: Russia Ceramics Artificial Joints Revenue (million) Forecast, by Application 2020 & 2033
- Table 25: Benelux Ceramics Artificial Joints Revenue (million) Forecast, by Application 2020 & 2033
- Table 26: Nordics Ceramics Artificial Joints Revenue (million) Forecast, by Application 2020 & 2033
- Table 27: Rest of Europe Ceramics Artificial Joints Revenue (million) Forecast, by Application 2020 & 2033
- Table 28: Global Ceramics Artificial Joints Revenue million Forecast, by Application 2020 & 2033
- Table 29: Global Ceramics Artificial Joints Revenue million Forecast, by Type 2020 & 2033
- Table 30: Global Ceramics Artificial Joints Revenue million Forecast, by Country 2020 & 2033
- Table 31: Turkey Ceramics Artificial Joints Revenue (million) Forecast, by Application 2020 & 2033
- Table 32: Israel Ceramics Artificial Joints Revenue (million) Forecast, by Application 2020 & 2033
- Table 33: GCC Ceramics Artificial Joints Revenue (million) Forecast, by Application 2020 & 2033
- Table 34: North Africa Ceramics Artificial Joints Revenue (million) Forecast, by Application 2020 & 2033
- Table 35: South Africa Ceramics Artificial Joints Revenue (million) Forecast, by Application 2020 & 2033
- Table 36: Rest of Middle East & Africa Ceramics Artificial Joints Revenue (million) Forecast, by Application 2020 & 2033
- Table 37: Global Ceramics Artificial Joints Revenue million Forecast, by Application 2020 & 2033
- Table 38: Global Ceramics Artificial Joints Revenue million Forecast, by Type 2020 & 2033
- Table 39: Global Ceramics Artificial Joints Revenue million Forecast, by Country 2020 & 2033
- Table 40: China Ceramics Artificial Joints Revenue (million) Forecast, by Application 2020 & 2033
- Table 41: India Ceramics Artificial Joints Revenue (million) Forecast, by Application 2020 & 2033
- Table 42: Japan Ceramics Artificial Joints Revenue (million) Forecast, by Application 2020 & 2033
- Table 43: South Korea Ceramics Artificial Joints Revenue (million) Forecast, by Application 2020 & 2033
- Table 44: ASEAN Ceramics Artificial Joints Revenue (million) Forecast, by Application 2020 & 2033
- Table 45: Oceania Ceramics Artificial Joints Revenue (million) Forecast, by Application 2020 & 2033
- Table 46: Rest of Asia Pacific Ceramics Artificial Joints Revenue (million) Forecast, by Application 2020 & 2033
Frequently Asked Questions
1. What is the projected Compound Annual Growth Rate (CAGR) of the Ceramics Artificial Joints?
The projected CAGR is approximately 3.3%.
2. Which companies are prominent players in the Ceramics Artificial Joints?
Key companies in the market include Johnson & Johnson, Stryker, Biomet, Smith & Nephew, AESCULAP, Wright Medical Technology, Exactech, Limacorporate, JRI, Medtronic.
3. What are the main segments of the Ceramics Artificial Joints?
The market segments include Application, Type.
4. Can you provide details about the market size?
The market size is estimated to be USD 10240 million as of 2022.
5. What are some drivers contributing to market growth?
N/A
6. What are the notable trends driving market growth?
N/A
7. Are there any restraints impacting market growth?
N/A
8. Can you provide examples of recent developments in the market?
N/A
9. What pricing options are available for accessing the report?
Pricing options include single-user, multi-user, and enterprise licenses priced at USD 4250.00, USD 6375.00, and USD 8500.00 respectively.
10. Is the market size provided in terms of value or volume?
The market size is provided in terms of value, measured in million.
11. Are there any specific market keywords associated with the report?
Yes, the market keyword associated with the report is "Ceramics Artificial Joints," which aids in identifying and referencing the specific market segment covered.
12. How do I determine which pricing option suits my needs best?
The pricing options vary based on user requirements and access needs. Individual users may opt for single-user licenses, while businesses requiring broader access may choose multi-user or enterprise licenses for cost-effective access to the report.
13. Are there any additional resources or data provided in the Ceramics Artificial Joints report?
While the report offers comprehensive insights, it's advisable to review the specific contents or supplementary materials provided to ascertain if additional resources or data are available.
14. How can I stay updated on further developments or reports in the Ceramics Artificial Joints?
To stay informed about further developments, trends, and reports in the Ceramics Artificial Joints, consider subscribing to industry newsletters, following relevant companies and organizations, or regularly checking reputable industry news sources and publications.
Methodology
Step 1 - Identification of Relevant Samples Size from Population Database


Step 2 - Approaches for Defining Global Market Size (Value, Volume* & Price*)

Note*: In applicable scenarios
Step 3 - Data Sources
Primary Research
- Web Analytics
- Survey Reports
- Research Institute
- Latest Research Reports
- Opinion Leaders
Secondary Research
- Annual Reports
- White Paper
- Latest Press Release
- Industry Association
- Paid Database
- Investor Presentations

Step 4 - Data Triangulation
Involves using different sources of information in order to increase the validity of a study
These sources are likely to be stakeholders in a program - participants, other researchers, program staff, other community members, and so on.
Then we put all data in single framework & apply various statistical tools to find out the dynamic on the market.
During the analysis stage, feedback from the stakeholder groups would be compared to determine areas of agreement as well as areas of divergence