

Key Insights
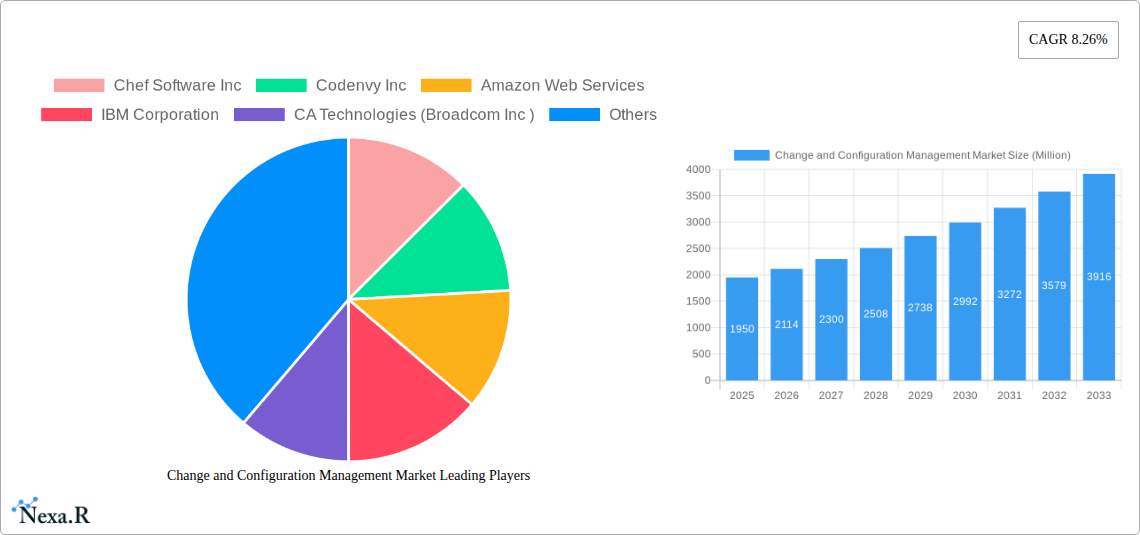
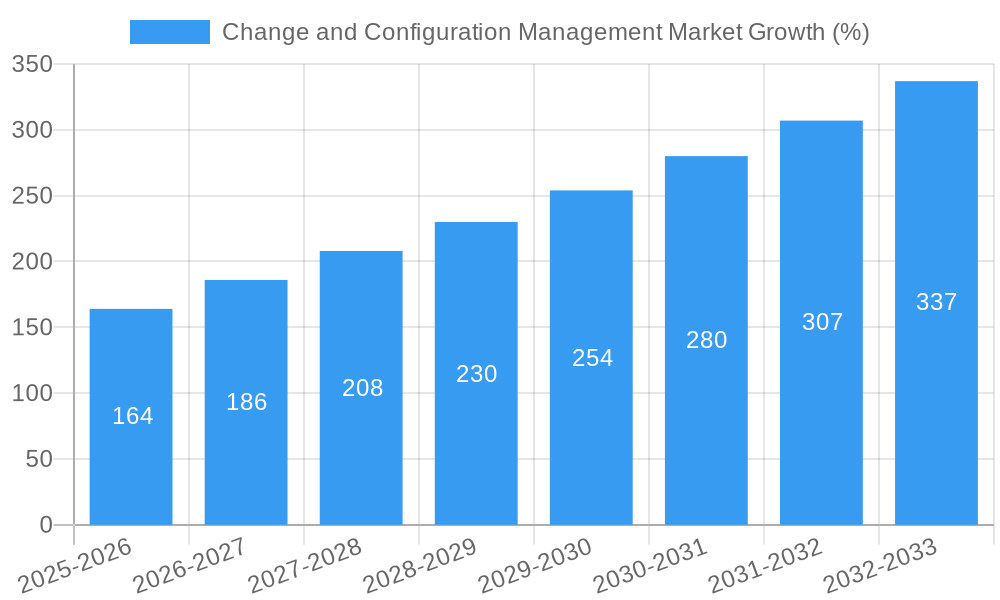
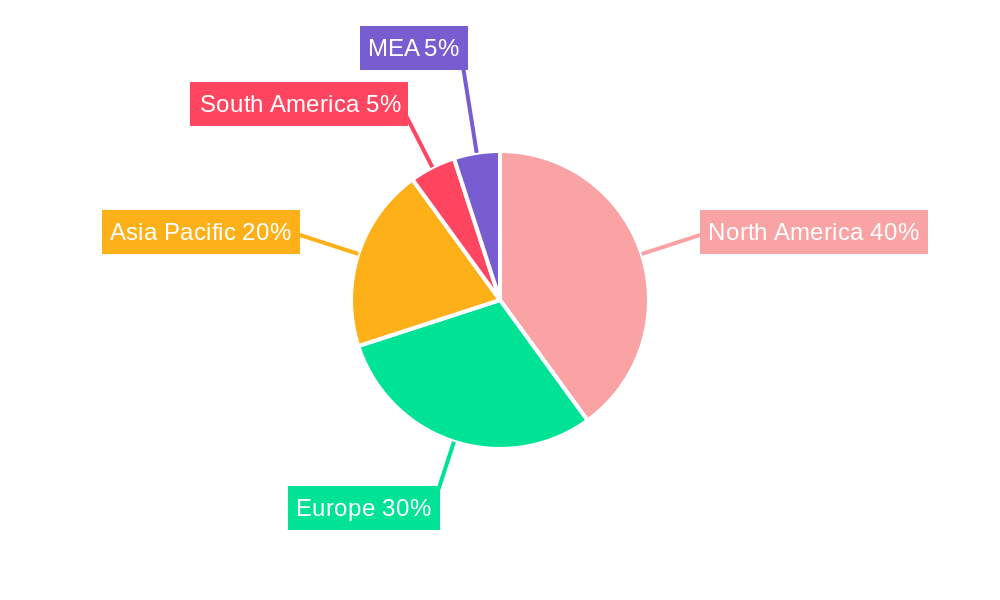
The Change and Configuration Management (CCM) market, valued at $1.95 billion in 2025, is projected to experience robust growth, driven by the increasing complexity of IT infrastructure, heightened regulatory compliance needs, and the rising adoption of DevOps methodologies. The market's Compound Annual Growth Rate (CAGR) of 8.26% from 2025 to 2033 indicates a significant expansion, fueled by the increasing demand for automation and improved IT service management. Key drivers include the need to reduce operational downtime, enhance security posture, and improve collaboration among IT teams. The software component is expected to dominate the market, given its inherent scalability and flexibility compared to service-based solutions. Large-scale organizations are the primary adopters due to their complex IT landscapes and need for sophisticated CCM solutions. The BFSI (Banking, Financial Services, and Insurance) sector, alongside the Retail and Healthcare industries, are leading end-users due to stringent regulatory requirements and the sensitivity of their data. Geographic expansion is expected across North America, Europe, and Asia-Pacific, with North America holding a significant market share initially due to early adoption of advanced technologies. However, rapid digitalization in Asia-Pacific will contribute to the region's accelerating growth in the coming years. While market restraints include the high initial investment costs associated with implementing CCM solutions and the need for skilled professionals, the long-term benefits of enhanced efficiency and reduced risk outweigh these challenges, driving continued market expansion.
The competitive landscape is highly dynamic, with established players like IBM, Microsoft, and Amazon Web Services competing with specialized CCM vendors such as Chef Software and Puppet. This competition fosters innovation, resulting in advanced features and competitive pricing that benefit consumers. The continued integration of AI and machine learning into CCM tools is expected to significantly improve automation capabilities and predictive analytics, furthering market growth. The adoption of cloud-based CCM solutions is also a notable trend, offering scalability and cost-effectiveness. Future growth will depend on addressing the skills gap through training and certifications, focusing on user-friendly interfaces, and enhancing the integration of CCM with other IT management tools. The market’s continued expansion underscores the critical role of CCM in maintaining robust and resilient IT infrastructure in an increasingly digital world.
Change and Configuration Management Market: A Comprehensive Report (2019-2033)
This comprehensive report provides an in-depth analysis of the Change and Configuration Management market, encompassing market dynamics, growth trends, regional dominance, product landscape, key players, and future outlook. The study period covers 2019-2033, with 2025 as the base and estimated year. The report meticulously examines the parent market (IT Management Software) and its child market (Change and Configuration Management), offering granular insights for informed decision-making. The market size is presented in Million units.
Change and Configuration Management Market Dynamics & Structure
The Change and Configuration Management market is experiencing robust growth, driven by the increasing adoption of cloud-based solutions and the rising need for efficient IT infrastructure management. Market concentration is moderately high, with a few major players holding significant market share. Technological innovations, particularly in automation and AI-powered tools, are reshaping the competitive landscape. Stringent regulatory frameworks, especially concerning data security and compliance, are influencing market practices. The market also faces competition from alternative solutions, such as manual processes and less sophisticated configuration management tools. The end-user demographics are diversifying, with growing adoption across various industries. M&A activity has been relatively high, with strategic partnerships and acquisitions driving consolidation within the sector.
- Market Concentration: Moderately high, with top 5 players holding approximately xx% market share (2024).
- Technological Innovation: Automation, AI, and machine learning are key drivers. Barriers include integration complexities and legacy system limitations.
- Regulatory Frameworks: Compliance standards (e.g., GDPR, HIPAA) are influencing product development and adoption.
- Competitive Substitutes: Manual processes, basic IT management tools.
- End-User Demographics: BFSI, Healthcare, Telecom & IT, and Retail are major sectors.
- M&A Trends: xx M&A deals recorded in the last 5 years, indicating a consolidation trend.
Change and Configuration Management Market Growth Trends & Insights
The Change and Configuration Management market has witnessed significant growth during the historical period (2019-2024), with a CAGR of xx%. This growth is primarily attributed to the increasing adoption of cloud computing, DevOps methodologies, and the need for improved IT infrastructure management. The market size in 2024 was estimated at xx Million units, and it's projected to reach xx Million units by 2033, exhibiting a CAGR of xx% during the forecast period (2025-2033). Market penetration is increasing across various industries, particularly in large-scale organizations. Technological disruptions, such as the rise of AIOps and serverless computing, are further fueling market expansion. Consumer behavior is shifting towards cloud-based and automated solutions, demanding enhanced scalability and ease of use.
Dominant Regions, Countries, or Segments in Change and Configuration Management Market
North America currently holds the largest market share in the Change and Configuration Management market, followed by Europe and Asia Pacific. The significant presence of major technology companies, robust IT infrastructure, and early adoption of advanced technologies are key factors driving growth in North America. Within the segment breakdown:
By Component: Software dominates the market, accounting for xx% of the total revenue in 2024, driven by increasing demand for advanced features and functionalities.
By Organization Type: Large-scale organizations are the primary adopters, owing to their complex IT infrastructure and higher budgets.
By End-user: The Telecom and IT sector exhibits the highest growth rate due to the critical need for robust change and configuration management systems to ensure operational efficiency and security.
Key Drivers (North America): Strong IT spending, advanced technological infrastructure, presence of major technology vendors.
Key Drivers (Europe): Growing adoption of cloud technologies, increasing focus on IT security and compliance.
Key Drivers (Asia Pacific): Rapid digitalization, rising IT investments in emerging economies.
Change and Configuration Management Market Product Landscape
The Change and Configuration Management market offers a range of products, including software solutions, professional services, and managed services. Software solutions offer varying levels of automation, integration capabilities, and reporting functionalities. Recent product innovations have focused on AI-driven automation, improved user experience, and enhanced security features. Unique selling propositions include seamless integration with existing IT systems, real-time monitoring, and predictive analytics. Technological advancements such as cloud-native architectures and microservices are driving product evolution.
Key Drivers, Barriers & Challenges in Change and Configuration Management Market
Key Drivers:
- Growing adoption of DevOps and Agile methodologies.
- Increased complexity of IT infrastructure.
- Rising need for improved IT security and compliance.
- Demand for enhanced automation and efficiency.
Key Challenges:
- High initial investment costs for implementing solutions.
- Difficulty in integrating with legacy systems.
- Lack of skilled professionals to manage and operate solutions.
- Competition from open-source alternatives.
Emerging Opportunities in Change and Configuration Management Market
- Expanding into untapped markets, such as the education and government sectors.
- Development of solutions tailored for specific industry verticals (e.g., healthcare, finance).
- Integration with other IT management tools and platforms.
- Leveraging AI and machine learning for predictive analytics and automated remediation.
Growth Accelerators in the Change and Configuration Management Market Industry
Strategic partnerships and collaborations among vendors are driving market expansion. Technological breakthroughs in areas like AI and automation are facilitating improved efficiency and scalability. Market expansion strategies focused on emerging economies and underserved industries further contribute to growth. The increasing focus on digital transformation across all sectors is a key catalyst for long-term growth in the Change and Configuration Management market.
Key Players Shaping the Change and Configuration Management Market Market
- Chef Software Inc
- Codenvy Inc
- Amazon Web Services
- IBM Corporation
- CA Technologies (Broadcom Inc)
- Ansible (Red Hat Inc)
- Microsoft Corporation
- Puppet
- BMC Software Inc
- Hewlett-Packard Enterprise Company
- Servicenow Inc
Notable Milestones in Change and Configuration Management Market Sector
- August 2023: BigID launched its Bucket Configuration Management capability, enhancing cloud data security.
- July 2023: de Novo Solutions partnered with Rookery Software to enhance its configuration management capabilities for Oracle applications.
In-Depth Change and Configuration Management Market Market Outlook
The Change and Configuration Management market is poised for continued growth, driven by ongoing technological advancements and the increasing demand for efficient IT management solutions. Strategic opportunities exist in developing AI-powered solutions, expanding into new market segments, and fostering strategic partnerships. The market's long-term potential is substantial, offering significant opportunities for both established players and new entrants.
Change and Configuration Management Market Segmentation
-
1. Component
- 1.1. Software
- 1.2. Services
-
2. Organization Type
- 2.1. Small and Medium Scale
- 2.2. Large Scale
-
3. End-user
- 3.1. BFSI
- 3.2. Retail
- 3.3. Healthcare
- 3.4. Telecom and IT
- 3.5. Other End-User Industry
Change and Configuration Management Market Segmentation By Geography
- 1. North America
- 2. Europe
- 3. Asia Pacific
- 4. Rest of World
Change and Configuration Management Market REPORT HIGHLIGHTS
| Aspects | Details |
|---|---|
| Study Period | 2019-2033 |
| Base Year | 2024 |
| Estimated Year | 2025 |
| Forecast Period | 2025-2033 |
| Historical Period | 2019-2024 |
| Growth Rate | CAGR of 8.26% from 2019-2033 |
| Segmentation |
|
Table of Contents
- 1. Introduction
- 1.1. Research Scope
- 1.2. Market Segmentation
- 1.3. Research Methodology
- 1.4. Definitions and Assumptions
- 2. Executive Summary
- 2.1. Introduction
- 3. Market Dynamics
- 3.1. Introduction
- 3.2. Market Drivers
- 3.2.1. Rapid Increase in Adoption of Digital Transformation by Organizations; Automated Management of IT Resources
- 3.3. Market Restrains
- 3.3.1. Diverse Requirements in an Enterprise Application
- 3.4. Market Trends
- 3.4.1. Small and Medium Scale Enterprise Segment Holds Significant Share of the Market
- 4. Market Factor Analysis
- 4.1. Porters Five Forces
- 4.2. Supply/Value Chain
- 4.3. PESTEL analysis
- 4.4. Market Entropy
- 4.5. Patent/Trademark Analysis
- 5. Global Change and Configuration Management Market Analysis, Insights and Forecast, 2019-2031
- 5.1. Market Analysis, Insights and Forecast - by Component
- 5.1.1. Software
- 5.1.2. Services
- 5.2. Market Analysis, Insights and Forecast - by Organization Type
- 5.2.1. Small and Medium Scale
- 5.2.2. Large Scale
- 5.3. Market Analysis, Insights and Forecast - by End-user
- 5.3.1. BFSI
- 5.3.2. Retail
- 5.3.3. Healthcare
- 5.3.4. Telecom and IT
- 5.3.5. Other End-User Industry
- 5.4. Market Analysis, Insights and Forecast - by Region
- 5.4.1. North America
- 5.4.2. Europe
- 5.4.3. Asia Pacific
- 5.4.4. Rest of World
- 5.1. Market Analysis, Insights and Forecast - by Component
- 6. North America Change and Configuration Management Market Analysis, Insights and Forecast, 2019-2031
- 6.1. Market Analysis, Insights and Forecast - by Component
- 6.1.1. Software
- 6.1.2. Services
- 6.2. Market Analysis, Insights and Forecast - by Organization Type
- 6.2.1. Small and Medium Scale
- 6.2.2. Large Scale
- 6.3. Market Analysis, Insights and Forecast - by End-user
- 6.3.1. BFSI
- 6.3.2. Retail
- 6.3.3. Healthcare
- 6.3.4. Telecom and IT
- 6.3.5. Other End-User Industry
- 6.1. Market Analysis, Insights and Forecast - by Component
- 7. Europe Change and Configuration Management Market Analysis, Insights and Forecast, 2019-2031
- 7.1. Market Analysis, Insights and Forecast - by Component
- 7.1.1. Software
- 7.1.2. Services
- 7.2. Market Analysis, Insights and Forecast - by Organization Type
- 7.2.1. Small and Medium Scale
- 7.2.2. Large Scale
- 7.3. Market Analysis, Insights and Forecast - by End-user
- 7.3.1. BFSI
- 7.3.2. Retail
- 7.3.3. Healthcare
- 7.3.4. Telecom and IT
- 7.3.5. Other End-User Industry
- 7.1. Market Analysis, Insights and Forecast - by Component
- 8. Asia Pacific Change and Configuration Management Market Analysis, Insights and Forecast, 2019-2031
- 8.1. Market Analysis, Insights and Forecast - by Component
- 8.1.1. Software
- 8.1.2. Services
- 8.2. Market Analysis, Insights and Forecast - by Organization Type
- 8.2.1. Small and Medium Scale
- 8.2.2. Large Scale
- 8.3. Market Analysis, Insights and Forecast - by End-user
- 8.3.1. BFSI
- 8.3.2. Retail
- 8.3.3. Healthcare
- 8.3.4. Telecom and IT
- 8.3.5. Other End-User Industry
- 8.1. Market Analysis, Insights and Forecast - by Component
- 9. Rest of World Change and Configuration Management Market Analysis, Insights and Forecast, 2019-2031
- 9.1. Market Analysis, Insights and Forecast - by Component
- 9.1.1. Software
- 9.1.2. Services
- 9.2. Market Analysis, Insights and Forecast - by Organization Type
- 9.2.1. Small and Medium Scale
- 9.2.2. Large Scale
- 9.3. Market Analysis, Insights and Forecast - by End-user
- 9.3.1. BFSI
- 9.3.2. Retail
- 9.3.3. Healthcare
- 9.3.4. Telecom and IT
- 9.3.5. Other End-User Industry
- 9.1. Market Analysis, Insights and Forecast - by Component
- 10. North America Change and Configuration Management Market Analysis, Insights and Forecast, 2019-2031
- 10.1. Market Analysis, Insights and Forecast - By Country/Sub-region
- 10.1.1 United States
- 10.1.2 Canada
- 10.1.3 Mexico
- 11. Europe Change and Configuration Management Market Analysis, Insights and Forecast, 2019-2031
- 11.1. Market Analysis, Insights and Forecast - By Country/Sub-region
- 11.1.1 Germany
- 11.1.2 United Kingdom
- 11.1.3 France
- 11.1.4 Spain
- 11.1.5 Italy
- 11.1.6 Spain
- 11.1.7 Belgium
- 11.1.8 Netherland
- 11.1.9 Nordics
- 11.1.10 Rest of Europe
- 12. Asia Pacific Change and Configuration Management Market Analysis, Insights and Forecast, 2019-2031
- 12.1. Market Analysis, Insights and Forecast - By Country/Sub-region
- 12.1.1 China
- 12.1.2 Japan
- 12.1.3 India
- 12.1.4 South Korea
- 12.1.5 Southeast Asia
- 12.1.6 Australia
- 12.1.7 Indonesia
- 12.1.8 Phillipes
- 12.1.9 Singapore
- 12.1.10 Thailandc
- 12.1.11 Rest of Asia Pacific
- 13. South America Change and Configuration Management Market Analysis, Insights and Forecast, 2019-2031
- 13.1. Market Analysis, Insights and Forecast - By Country/Sub-region
- 13.1.1 Brazil
- 13.1.2 Argentina
- 13.1.3 Peru
- 13.1.4 Chile
- 13.1.5 Colombia
- 13.1.6 Ecuador
- 13.1.7 Venezuela
- 13.1.8 Rest of South America
- 14. North America Change and Configuration Management Market Analysis, Insights and Forecast, 2019-2031
- 14.1. Market Analysis, Insights and Forecast - By Country/Sub-region
- 14.1.1 United States
- 14.1.2 Canada
- 14.1.3 Mexico
- 15. MEA Change and Configuration Management Market Analysis, Insights and Forecast, 2019-2031
- 15.1. Market Analysis, Insights and Forecast - By Country/Sub-region
- 15.1.1 United Arab Emirates
- 15.1.2 Saudi Arabia
- 15.1.3 South Africa
- 15.1.4 Rest of Middle East and Africa
- 16. Competitive Analysis
- 16.1. Global Market Share Analysis 2024
- 16.2. Company Profiles
- 16.2.1 Chef Software Inc
- 16.2.1.1. Overview
- 16.2.1.2. Products
- 16.2.1.3. SWOT Analysis
- 16.2.1.4. Recent Developments
- 16.2.1.5. Financials (Based on Availability)
- 16.2.2 Codenvy Inc
- 16.2.2.1. Overview
- 16.2.2.2. Products
- 16.2.2.3. SWOT Analysis
- 16.2.2.4. Recent Developments
- 16.2.2.5. Financials (Based on Availability)
- 16.2.3 Amazon Web Services
- 16.2.3.1. Overview
- 16.2.3.2. Products
- 16.2.3.3. SWOT Analysis
- 16.2.3.4. Recent Developments
- 16.2.3.5. Financials (Based on Availability)
- 16.2.4 IBM Corporation
- 16.2.4.1. Overview
- 16.2.4.2. Products
- 16.2.4.3. SWOT Analysis
- 16.2.4.4. Recent Developments
- 16.2.4.5. Financials (Based on Availability)
- 16.2.5 CA Technologies (Broadcom Inc )
- 16.2.5.1. Overview
- 16.2.5.2. Products
- 16.2.5.3. SWOT Analysis
- 16.2.5.4. Recent Developments
- 16.2.5.5. Financials (Based on Availability)
- 16.2.6 Ansible (Red Hat Inc )
- 16.2.6.1. Overview
- 16.2.6.2. Products
- 16.2.6.3. SWOT Analysis
- 16.2.6.4. Recent Developments
- 16.2.6.5. Financials (Based on Availability)
- 16.2.7 Microsoft Corporation
- 16.2.7.1. Overview
- 16.2.7.2. Products
- 16.2.7.3. SWOT Analysis
- 16.2.7.4. Recent Developments
- 16.2.7.5. Financials (Based on Availability)
- 16.2.8 Puppet
- 16.2.8.1. Overview
- 16.2.8.2. Products
- 16.2.8.3. SWOT Analysis
- 16.2.8.4. Recent Developments
- 16.2.8.5. Financials (Based on Availability)
- 16.2.9 BMC Software Inc
- 16.2.9.1. Overview
- 16.2.9.2. Products
- 16.2.9.3. SWOT Analysis
- 16.2.9.4. Recent Developments
- 16.2.9.5. Financials (Based on Availability)
- 16.2.10 Hewlett-Packard Enterprise Company
- 16.2.10.1. Overview
- 16.2.10.2. Products
- 16.2.10.3. SWOT Analysis
- 16.2.10.4. Recent Developments
- 16.2.10.5. Financials (Based on Availability)
- 16.2.11 Servicenow Inc
- 16.2.11.1. Overview
- 16.2.11.2. Products
- 16.2.11.3. SWOT Analysis
- 16.2.11.4. Recent Developments
- 16.2.11.5. Financials (Based on Availability)
- 16.2.1 Chef Software Inc
List of Figures
- Figure 1: Global Change and Configuration Management Market Revenue Breakdown (Million, %) by Region 2024 & 2032
- Figure 2: Global Change and Configuration Management Market Volume Breakdown (K Unit, %) by Region 2024 & 2032
- Figure 3: North America Change and Configuration Management Market Revenue (Million), by Country 2024 & 2032
- Figure 4: North America Change and Configuration Management Market Volume (K Unit), by Country 2024 & 2032
- Figure 5: North America Change and Configuration Management Market Revenue Share (%), by Country 2024 & 2032
- Figure 6: North America Change and Configuration Management Market Volume Share (%), by Country 2024 & 2032
- Figure 7: Europe Change and Configuration Management Market Revenue (Million), by Country 2024 & 2032
- Figure 8: Europe Change and Configuration Management Market Volume (K Unit), by Country 2024 & 2032
- Figure 9: Europe Change and Configuration Management Market Revenue Share (%), by Country 2024 & 2032
- Figure 10: Europe Change and Configuration Management Market Volume Share (%), by Country 2024 & 2032
- Figure 11: Asia Pacific Change and Configuration Management Market Revenue (Million), by Country 2024 & 2032
- Figure 12: Asia Pacific Change and Configuration Management Market Volume (K Unit), by Country 2024 & 2032
- Figure 13: Asia Pacific Change and Configuration Management Market Revenue Share (%), by Country 2024 & 2032
- Figure 14: Asia Pacific Change and Configuration Management Market Volume Share (%), by Country 2024 & 2032
- Figure 15: South America Change and Configuration Management Market Revenue (Million), by Country 2024 & 2032
- Figure 16: South America Change and Configuration Management Market Volume (K Unit), by Country 2024 & 2032
- Figure 17: South America Change and Configuration Management Market Revenue Share (%), by Country 2024 & 2032
- Figure 18: South America Change and Configuration Management Market Volume Share (%), by Country 2024 & 2032
- Figure 19: North America Change and Configuration Management Market Revenue (Million), by Country 2024 & 2032
- Figure 20: North America Change and Configuration Management Market Volume (K Unit), by Country 2024 & 2032
- Figure 21: North America Change and Configuration Management Market Revenue Share (%), by Country 2024 & 2032
- Figure 22: North America Change and Configuration Management Market Volume Share (%), by Country 2024 & 2032
- Figure 23: MEA Change and Configuration Management Market Revenue (Million), by Country 2024 & 2032
- Figure 24: MEA Change and Configuration Management Market Volume (K Unit), by Country 2024 & 2032
- Figure 25: MEA Change and Configuration Management Market Revenue Share (%), by Country 2024 & 2032
- Figure 26: MEA Change and Configuration Management Market Volume Share (%), by Country 2024 & 2032
- Figure 27: North America Change and Configuration Management Market Revenue (Million), by Component 2024 & 2032
- Figure 28: North America Change and Configuration Management Market Volume (K Unit), by Component 2024 & 2032
- Figure 29: North America Change and Configuration Management Market Revenue Share (%), by Component 2024 & 2032
- Figure 30: North America Change and Configuration Management Market Volume Share (%), by Component 2024 & 2032
- Figure 31: North America Change and Configuration Management Market Revenue (Million), by Organization Type 2024 & 2032
- Figure 32: North America Change and Configuration Management Market Volume (K Unit), by Organization Type 2024 & 2032
- Figure 33: North America Change and Configuration Management Market Revenue Share (%), by Organization Type 2024 & 2032
- Figure 34: North America Change and Configuration Management Market Volume Share (%), by Organization Type 2024 & 2032
- Figure 35: North America Change and Configuration Management Market Revenue (Million), by End-user 2024 & 2032
- Figure 36: North America Change and Configuration Management Market Volume (K Unit), by End-user 2024 & 2032
- Figure 37: North America Change and Configuration Management Market Revenue Share (%), by End-user 2024 & 2032
- Figure 38: North America Change and Configuration Management Market Volume Share (%), by End-user 2024 & 2032
- Figure 39: North America Change and Configuration Management Market Revenue (Million), by Country 2024 & 2032
- Figure 40: North America Change and Configuration Management Market Volume (K Unit), by Country 2024 & 2032
- Figure 41: North America Change and Configuration Management Market Revenue Share (%), by Country 2024 & 2032
- Figure 42: North America Change and Configuration Management Market Volume Share (%), by Country 2024 & 2032
- Figure 43: Europe Change and Configuration Management Market Revenue (Million), by Component 2024 & 2032
- Figure 44: Europe Change and Configuration Management Market Volume (K Unit), by Component 2024 & 2032
- Figure 45: Europe Change and Configuration Management Market Revenue Share (%), by Component 2024 & 2032
- Figure 46: Europe Change and Configuration Management Market Volume Share (%), by Component 2024 & 2032
- Figure 47: Europe Change and Configuration Management Market Revenue (Million), by Organization Type 2024 & 2032
- Figure 48: Europe Change and Configuration Management Market Volume (K Unit), by Organization Type 2024 & 2032
- Figure 49: Europe Change and Configuration Management Market Revenue Share (%), by Organization Type 2024 & 2032
- Figure 50: Europe Change and Configuration Management Market Volume Share (%), by Organization Type 2024 & 2032
- Figure 51: Europe Change and Configuration Management Market Revenue (Million), by End-user 2024 & 2032
- Figure 52: Europe Change and Configuration Management Market Volume (K Unit), by End-user 2024 & 2032
- Figure 53: Europe Change and Configuration Management Market Revenue Share (%), by End-user 2024 & 2032
- Figure 54: Europe Change and Configuration Management Market Volume Share (%), by End-user 2024 & 2032
- Figure 55: Europe Change and Configuration Management Market Revenue (Million), by Country 2024 & 2032
- Figure 56: Europe Change and Configuration Management Market Volume (K Unit), by Country 2024 & 2032
- Figure 57: Europe Change and Configuration Management Market Revenue Share (%), by Country 2024 & 2032
- Figure 58: Europe Change and Configuration Management Market Volume Share (%), by Country 2024 & 2032
- Figure 59: Asia Pacific Change and Configuration Management Market Revenue (Million), by Component 2024 & 2032
- Figure 60: Asia Pacific Change and Configuration Management Market Volume (K Unit), by Component 2024 & 2032
- Figure 61: Asia Pacific Change and Configuration Management Market Revenue Share (%), by Component 2024 & 2032
- Figure 62: Asia Pacific Change and Configuration Management Market Volume Share (%), by Component 2024 & 2032
- Figure 63: Asia Pacific Change and Configuration Management Market Revenue (Million), by Organization Type 2024 & 2032
- Figure 64: Asia Pacific Change and Configuration Management Market Volume (K Unit), by Organization Type 2024 & 2032
- Figure 65: Asia Pacific Change and Configuration Management Market Revenue Share (%), by Organization Type 2024 & 2032
- Figure 66: Asia Pacific Change and Configuration Management Market Volume Share (%), by Organization Type 2024 & 2032
- Figure 67: Asia Pacific Change and Configuration Management Market Revenue (Million), by End-user 2024 & 2032
- Figure 68: Asia Pacific Change and Configuration Management Market Volume (K Unit), by End-user 2024 & 2032
- Figure 69: Asia Pacific Change and Configuration Management Market Revenue Share (%), by End-user 2024 & 2032
- Figure 70: Asia Pacific Change and Configuration Management Market Volume Share (%), by End-user 2024 & 2032
- Figure 71: Asia Pacific Change and Configuration Management Market Revenue (Million), by Country 2024 & 2032
- Figure 72: Asia Pacific Change and Configuration Management Market Volume (K Unit), by Country 2024 & 2032
- Figure 73: Asia Pacific Change and Configuration Management Market Revenue Share (%), by Country 2024 & 2032
- Figure 74: Asia Pacific Change and Configuration Management Market Volume Share (%), by Country 2024 & 2032
- Figure 75: Rest of World Change and Configuration Management Market Revenue (Million), by Component 2024 & 2032
- Figure 76: Rest of World Change and Configuration Management Market Volume (K Unit), by Component 2024 & 2032
- Figure 77: Rest of World Change and Configuration Management Market Revenue Share (%), by Component 2024 & 2032
- Figure 78: Rest of World Change and Configuration Management Market Volume Share (%), by Component 2024 & 2032
- Figure 79: Rest of World Change and Configuration Management Market Revenue (Million), by Organization Type 2024 & 2032
- Figure 80: Rest of World Change and Configuration Management Market Volume (K Unit), by Organization Type 2024 & 2032
- Figure 81: Rest of World Change and Configuration Management Market Revenue Share (%), by Organization Type 2024 & 2032
- Figure 82: Rest of World Change and Configuration Management Market Volume Share (%), by Organization Type 2024 & 2032
- Figure 83: Rest of World Change and Configuration Management Market Revenue (Million), by End-user 2024 & 2032
- Figure 84: Rest of World Change and Configuration Management Market Volume (K Unit), by End-user 2024 & 2032
- Figure 85: Rest of World Change and Configuration Management Market Revenue Share (%), by End-user 2024 & 2032
- Figure 86: Rest of World Change and Configuration Management Market Volume Share (%), by End-user 2024 & 2032
- Figure 87: Rest of World Change and Configuration Management Market Revenue (Million), by Country 2024 & 2032
- Figure 88: Rest of World Change and Configuration Management Market Volume (K Unit), by Country 2024 & 2032
- Figure 89: Rest of World Change and Configuration Management Market Revenue Share (%), by Country 2024 & 2032
- Figure 90: Rest of World Change and Configuration Management Market Volume Share (%), by Country 2024 & 2032
List of Tables
- Table 1: Global Change and Configuration Management Market Revenue Million Forecast, by Region 2019 & 2032
- Table 2: Global Change and Configuration Management Market Volume K Unit Forecast, by Region 2019 & 2032
- Table 3: Global Change and Configuration Management Market Revenue Million Forecast, by Component 2019 & 2032
- Table 4: Global Change and Configuration Management Market Volume K Unit Forecast, by Component 2019 & 2032
- Table 5: Global Change and Configuration Management Market Revenue Million Forecast, by Organization Type 2019 & 2032
- Table 6: Global Change and Configuration Management Market Volume K Unit Forecast, by Organization Type 2019 & 2032
- Table 7: Global Change and Configuration Management Market Revenue Million Forecast, by End-user 2019 & 2032
- Table 8: Global Change and Configuration Management Market Volume K Unit Forecast, by End-user 2019 & 2032
- Table 9: Global Change and Configuration Management Market Revenue Million Forecast, by Region 2019 & 2032
- Table 10: Global Change and Configuration Management Market Volume K Unit Forecast, by Region 2019 & 2032
- Table 11: Global Change and Configuration Management Market Revenue Million Forecast, by Country 2019 & 2032
- Table 12: Global Change and Configuration Management Market Volume K Unit Forecast, by Country 2019 & 2032
- Table 13: United States Change and Configuration Management Market Revenue (Million) Forecast, by Application 2019 & 2032
- Table 14: United States Change and Configuration Management Market Volume (K Unit) Forecast, by Application 2019 & 2032
- Table 15: Canada Change and Configuration Management Market Revenue (Million) Forecast, by Application 2019 & 2032
- Table 16: Canada Change and Configuration Management Market Volume (K Unit) Forecast, by Application 2019 & 2032
- Table 17: Mexico Change and Configuration Management Market Revenue (Million) Forecast, by Application 2019 & 2032
- Table 18: Mexico Change and Configuration Management Market Volume (K Unit) Forecast, by Application 2019 & 2032
- Table 19: Global Change and Configuration Management Market Revenue Million Forecast, by Country 2019 & 2032
- Table 20: Global Change and Configuration Management Market Volume K Unit Forecast, by Country 2019 & 2032
- Table 21: Germany Change and Configuration Management Market Revenue (Million) Forecast, by Application 2019 & 2032
- Table 22: Germany Change and Configuration Management Market Volume (K Unit) Forecast, by Application 2019 & 2032
- Table 23: United Kingdom Change and Configuration Management Market Revenue (Million) Forecast, by Application 2019 & 2032
- Table 24: United Kingdom Change and Configuration Management Market Volume (K Unit) Forecast, by Application 2019 & 2032
- Table 25: France Change and Configuration Management Market Revenue (Million) Forecast, by Application 2019 & 2032
- Table 26: France Change and Configuration Management Market Volume (K Unit) Forecast, by Application 2019 & 2032
- Table 27: Spain Change and Configuration Management Market Revenue (Million) Forecast, by Application 2019 & 2032
- Table 28: Spain Change and Configuration Management Market Volume (K Unit) Forecast, by Application 2019 & 2032
- Table 29: Italy Change and Configuration Management Market Revenue (Million) Forecast, by Application 2019 & 2032
- Table 30: Italy Change and Configuration Management Market Volume (K Unit) Forecast, by Application 2019 & 2032
- Table 31: Spain Change and Configuration Management Market Revenue (Million) Forecast, by Application 2019 & 2032
- Table 32: Spain Change and Configuration Management Market Volume (K Unit) Forecast, by Application 2019 & 2032
- Table 33: Belgium Change and Configuration Management Market Revenue (Million) Forecast, by Application 2019 & 2032
- Table 34: Belgium Change and Configuration Management Market Volume (K Unit) Forecast, by Application 2019 & 2032
- Table 35: Netherland Change and Configuration Management Market Revenue (Million) Forecast, by Application 2019 & 2032
- Table 36: Netherland Change and Configuration Management Market Volume (K Unit) Forecast, by Application 2019 & 2032
- Table 37: Nordics Change and Configuration Management Market Revenue (Million) Forecast, by Application 2019 & 2032
- Table 38: Nordics Change and Configuration Management Market Volume (K Unit) Forecast, by Application 2019 & 2032
- Table 39: Rest of Europe Change and Configuration Management Market Revenue (Million) Forecast, by Application 2019 & 2032
- Table 40: Rest of Europe Change and Configuration Management Market Volume (K Unit) Forecast, by Application 2019 & 2032
- Table 41: Global Change and Configuration Management Market Revenue Million Forecast, by Country 2019 & 2032
- Table 42: Global Change and Configuration Management Market Volume K Unit Forecast, by Country 2019 & 2032
- Table 43: China Change and Configuration Management Market Revenue (Million) Forecast, by Application 2019 & 2032
- Table 44: China Change and Configuration Management Market Volume (K Unit) Forecast, by Application 2019 & 2032
- Table 45: Japan Change and Configuration Management Market Revenue (Million) Forecast, by Application 2019 & 2032
- Table 46: Japan Change and Configuration Management Market Volume (K Unit) Forecast, by Application 2019 & 2032
- Table 47: India Change and Configuration Management Market Revenue (Million) Forecast, by Application 2019 & 2032
- Table 48: India Change and Configuration Management Market Volume (K Unit) Forecast, by Application 2019 & 2032
- Table 49: South Korea Change and Configuration Management Market Revenue (Million) Forecast, by Application 2019 & 2032
- Table 50: South Korea Change and Configuration Management Market Volume (K Unit) Forecast, by Application 2019 & 2032
- Table 51: Southeast Asia Change and Configuration Management Market Revenue (Million) Forecast, by Application 2019 & 2032
- Table 52: Southeast Asia Change and Configuration Management Market Volume (K Unit) Forecast, by Application 2019 & 2032
- Table 53: Australia Change and Configuration Management Market Revenue (Million) Forecast, by Application 2019 & 2032
- Table 54: Australia Change and Configuration Management Market Volume (K Unit) Forecast, by Application 2019 & 2032
- Table 55: Indonesia Change and Configuration Management Market Revenue (Million) Forecast, by Application 2019 & 2032
- Table 56: Indonesia Change and Configuration Management Market Volume (K Unit) Forecast, by Application 2019 & 2032
- Table 57: Phillipes Change and Configuration Management Market Revenue (Million) Forecast, by Application 2019 & 2032
- Table 58: Phillipes Change and Configuration Management Market Volume (K Unit) Forecast, by Application 2019 & 2032
- Table 59: Singapore Change and Configuration Management Market Revenue (Million) Forecast, by Application 2019 & 2032
- Table 60: Singapore Change and Configuration Management Market Volume (K Unit) Forecast, by Application 2019 & 2032
- Table 61: Thailandc Change and Configuration Management Market Revenue (Million) Forecast, by Application 2019 & 2032
- Table 62: Thailandc Change and Configuration Management Market Volume (K Unit) Forecast, by Application 2019 & 2032
- Table 63: Rest of Asia Pacific Change and Configuration Management Market Revenue (Million) Forecast, by Application 2019 & 2032
- Table 64: Rest of Asia Pacific Change and Configuration Management Market Volume (K Unit) Forecast, by Application 2019 & 2032
- Table 65: Global Change and Configuration Management Market Revenue Million Forecast, by Country 2019 & 2032
- Table 66: Global Change and Configuration Management Market Volume K Unit Forecast, by Country 2019 & 2032
- Table 67: Brazil Change and Configuration Management Market Revenue (Million) Forecast, by Application 2019 & 2032
- Table 68: Brazil Change and Configuration Management Market Volume (K Unit) Forecast, by Application 2019 & 2032
- Table 69: Argentina Change and Configuration Management Market Revenue (Million) Forecast, by Application 2019 & 2032
- Table 70: Argentina Change and Configuration Management Market Volume (K Unit) Forecast, by Application 2019 & 2032
- Table 71: Peru Change and Configuration Management Market Revenue (Million) Forecast, by Application 2019 & 2032
- Table 72: Peru Change and Configuration Management Market Volume (K Unit) Forecast, by Application 2019 & 2032
- Table 73: Chile Change and Configuration Management Market Revenue (Million) Forecast, by Application 2019 & 2032
- Table 74: Chile Change and Configuration Management Market Volume (K Unit) Forecast, by Application 2019 & 2032
- Table 75: Colombia Change and Configuration Management Market Revenue (Million) Forecast, by Application 2019 & 2032
- Table 76: Colombia Change and Configuration Management Market Volume (K Unit) Forecast, by Application 2019 & 2032
- Table 77: Ecuador Change and Configuration Management Market Revenue (Million) Forecast, by Application 2019 & 2032
- Table 78: Ecuador Change and Configuration Management Market Volume (K Unit) Forecast, by Application 2019 & 2032
- Table 79: Venezuela Change and Configuration Management Market Revenue (Million) Forecast, by Application 2019 & 2032
- Table 80: Venezuela Change and Configuration Management Market Volume (K Unit) Forecast, by Application 2019 & 2032
- Table 81: Rest of South America Change and Configuration Management Market Revenue (Million) Forecast, by Application 2019 & 2032
- Table 82: Rest of South America Change and Configuration Management Market Volume (K Unit) Forecast, by Application 2019 & 2032
- Table 83: Global Change and Configuration Management Market Revenue Million Forecast, by Country 2019 & 2032
- Table 84: Global Change and Configuration Management Market Volume K Unit Forecast, by Country 2019 & 2032
- Table 85: United States Change and Configuration Management Market Revenue (Million) Forecast, by Application 2019 & 2032
- Table 86: United States Change and Configuration Management Market Volume (K Unit) Forecast, by Application 2019 & 2032
- Table 87: Canada Change and Configuration Management Market Revenue (Million) Forecast, by Application 2019 & 2032
- Table 88: Canada Change and Configuration Management Market Volume (K Unit) Forecast, by Application 2019 & 2032
- Table 89: Mexico Change and Configuration Management Market Revenue (Million) Forecast, by Application 2019 & 2032
- Table 90: Mexico Change and Configuration Management Market Volume (K Unit) Forecast, by Application 2019 & 2032
- Table 91: Global Change and Configuration Management Market Revenue Million Forecast, by Country 2019 & 2032
- Table 92: Global Change and Configuration Management Market Volume K Unit Forecast, by Country 2019 & 2032
- Table 93: United Arab Emirates Change and Configuration Management Market Revenue (Million) Forecast, by Application 2019 & 2032
- Table 94: United Arab Emirates Change and Configuration Management Market Volume (K Unit) Forecast, by Application 2019 & 2032
- Table 95: Saudi Arabia Change and Configuration Management Market Revenue (Million) Forecast, by Application 2019 & 2032
- Table 96: Saudi Arabia Change and Configuration Management Market Volume (K Unit) Forecast, by Application 2019 & 2032
- Table 97: South Africa Change and Configuration Management Market Revenue (Million) Forecast, by Application 2019 & 2032
- Table 98: South Africa Change and Configuration Management Market Volume (K Unit) Forecast, by Application 2019 & 2032
- Table 99: Rest of Middle East and Africa Change and Configuration Management Market Revenue (Million) Forecast, by Application 2019 & 2032
- Table 100: Rest of Middle East and Africa Change and Configuration Management Market Volume (K Unit) Forecast, by Application 2019 & 2032
- Table 101: Global Change and Configuration Management Market Revenue Million Forecast, by Component 2019 & 2032
- Table 102: Global Change and Configuration Management Market Volume K Unit Forecast, by Component 2019 & 2032
- Table 103: Global Change and Configuration Management Market Revenue Million Forecast, by Organization Type 2019 & 2032
- Table 104: Global Change and Configuration Management Market Volume K Unit Forecast, by Organization Type 2019 & 2032
- Table 105: Global Change and Configuration Management Market Revenue Million Forecast, by End-user 2019 & 2032
- Table 106: Global Change and Configuration Management Market Volume K Unit Forecast, by End-user 2019 & 2032
- Table 107: Global Change and Configuration Management Market Revenue Million Forecast, by Country 2019 & 2032
- Table 108: Global Change and Configuration Management Market Volume K Unit Forecast, by Country 2019 & 2032
- Table 109: Global Change and Configuration Management Market Revenue Million Forecast, by Component 2019 & 2032
- Table 110: Global Change and Configuration Management Market Volume K Unit Forecast, by Component 2019 & 2032
- Table 111: Global Change and Configuration Management Market Revenue Million Forecast, by Organization Type 2019 & 2032
- Table 112: Global Change and Configuration Management Market Volume K Unit Forecast, by Organization Type 2019 & 2032
- Table 113: Global Change and Configuration Management Market Revenue Million Forecast, by End-user 2019 & 2032
- Table 114: Global Change and Configuration Management Market Volume K Unit Forecast, by End-user 2019 & 2032
- Table 115: Global Change and Configuration Management Market Revenue Million Forecast, by Country 2019 & 2032
- Table 116: Global Change and Configuration Management Market Volume K Unit Forecast, by Country 2019 & 2032
- Table 117: Global Change and Configuration Management Market Revenue Million Forecast, by Component 2019 & 2032
- Table 118: Global Change and Configuration Management Market Volume K Unit Forecast, by Component 2019 & 2032
- Table 119: Global Change and Configuration Management Market Revenue Million Forecast, by Organization Type 2019 & 2032
- Table 120: Global Change and Configuration Management Market Volume K Unit Forecast, by Organization Type 2019 & 2032
- Table 121: Global Change and Configuration Management Market Revenue Million Forecast, by End-user 2019 & 2032
- Table 122: Global Change and Configuration Management Market Volume K Unit Forecast, by End-user 2019 & 2032
- Table 123: Global Change and Configuration Management Market Revenue Million Forecast, by Country 2019 & 2032
- Table 124: Global Change and Configuration Management Market Volume K Unit Forecast, by Country 2019 & 2032
- Table 125: Global Change and Configuration Management Market Revenue Million Forecast, by Component 2019 & 2032
- Table 126: Global Change and Configuration Management Market Volume K Unit Forecast, by Component 2019 & 2032
- Table 127: Global Change and Configuration Management Market Revenue Million Forecast, by Organization Type 2019 & 2032
- Table 128: Global Change and Configuration Management Market Volume K Unit Forecast, by Organization Type 2019 & 2032
- Table 129: Global Change and Configuration Management Market Revenue Million Forecast, by End-user 2019 & 2032
- Table 130: Global Change and Configuration Management Market Volume K Unit Forecast, by End-user 2019 & 2032
- Table 131: Global Change and Configuration Management Market Revenue Million Forecast, by Country 2019 & 2032
- Table 132: Global Change and Configuration Management Market Volume K Unit Forecast, by Country 2019 & 2032
Frequently Asked Questions
1. What is the projected Compound Annual Growth Rate (CAGR) of the Change and Configuration Management Market?
The projected CAGR is approximately 8.26%.
2. Which companies are prominent players in the Change and Configuration Management Market?
Key companies in the market include Chef Software Inc, Codenvy Inc, Amazon Web Services, IBM Corporation, CA Technologies (Broadcom Inc ), Ansible (Red Hat Inc ), Microsoft Corporation, Puppet, BMC Software Inc, Hewlett-Packard Enterprise Company, Servicenow Inc .
3. What are the main segments of the Change and Configuration Management Market?
The market segments include Component, Organization Type, End-user.
4. Can you provide details about the market size?
The market size is estimated to be USD 1.95 Million as of 2022.
5. What are some drivers contributing to market growth?
Rapid Increase in Adoption of Digital Transformation by Organizations; Automated Management of IT Resources.
6. What are the notable trends driving market growth?
Small and Medium Scale Enterprise Segment Holds Significant Share of the Market.
7. Are there any restraints impacting market growth?
Diverse Requirements in an Enterprise Application.
8. Can you provide examples of recent developments in the market?
August 2023: BigID, the leading platform for data security, privacy, compliance, and governance, launched its Bucket Configuration Management capability. By enhancing BigID's industry-leading Data Security Posture Management (DSPM) with essential Cloud Security Posture Management (CSPM) capabilities, Bucket Configuration Management redefines cloud data security by proactively identifying and resolving misconfigured Amazon S3 buckets, at the cloud scale.
9. What pricing options are available for accessing the report?
Pricing options include single-user, multi-user, and enterprise licenses priced at USD 4750, USD 5250, and USD 8750 respectively.
10. Is the market size provided in terms of value or volume?
The market size is provided in terms of value, measured in Million and volume, measured in K Unit.
11. Are there any specific market keywords associated with the report?
Yes, the market keyword associated with the report is "Change and Configuration Management Market," which aids in identifying and referencing the specific market segment covered.
12. How do I determine which pricing option suits my needs best?
The pricing options vary based on user requirements and access needs. Individual users may opt for single-user licenses, while businesses requiring broader access may choose multi-user or enterprise licenses for cost-effective access to the report.
13. Are there any additional resources or data provided in the Change and Configuration Management Market report?
While the report offers comprehensive insights, it's advisable to review the specific contents or supplementary materials provided to ascertain if additional resources or data are available.
14. How can I stay updated on further developments or reports in the Change and Configuration Management Market?
To stay informed about further developments, trends, and reports in the Change and Configuration Management Market, consider subscribing to industry newsletters, following relevant companies and organizations, or regularly checking reputable industry news sources and publications.
Methodology
Step 1 - Identification of Relevant Samples Size from Population Database


Step 2 - Approaches for Defining Global Market Size (Value, Volume* & Price*)

Note*: In applicable scenarios
Step 3 - Data Sources
Primary Research
- Web Analytics
- Survey Reports
- Research Institute
- Latest Research Reports
- Opinion Leaders
Secondary Research
- Annual Reports
- White Paper
- Latest Press Release
- Industry Association
- Paid Database
- Investor Presentations

Step 4 - Data Triangulation
Involves using different sources of information in order to increase the validity of a study
These sources are likely to be stakeholders in a program - participants, other researchers, program staff, other community members, and so on.
Then we put all data in single framework & apply various statistical tools to find out the dynamic on the market.
During the analysis stage, feedback from the stakeholder groups would be compared to determine areas of agreement as well as areas of divergence
