

Key Insights
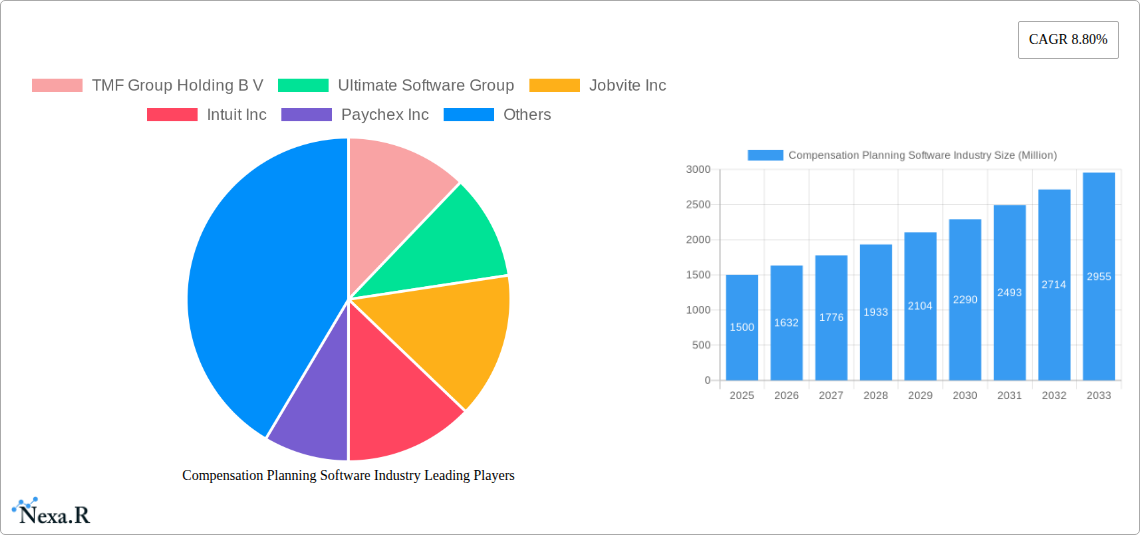
The global Compensation Planning Software market is experiencing robust growth, projected to reach a substantial size by 2033. A compound annual growth rate (CAGR) of 8.80% from 2019 to 2024 indicates a consistently expanding market driven by several key factors. The increasing need for efficient and automated compensation management within organizations of all sizes is a primary driver. Businesses are increasingly adopting software solutions to streamline payroll processes, manage employee benefits, handle tax filings, and conduct performance reviews more effectively. The shift towards cloud-based deployments further fuels market expansion, offering scalability, accessibility, and reduced IT infrastructure costs. The diverse application areas, including time and attendance tracking, leave management, and reimbursement/loan processing, contribute to the market's breadth and appeal. Furthermore, the increasing adoption of advanced analytics within compensation planning software is creating new opportunities for vendors and attracting a wider range of industries, including BFSI, retail, manufacturing, and healthcare.
While the market enjoys significant growth momentum, certain restraints need consideration. High initial investment costs for software implementation and ongoing maintenance can pose a barrier to entry for smaller businesses. Integration complexities with existing HR systems and the need for ongoing employee training can also present challenges. However, the long-term benefits of increased efficiency, reduced errors, improved compliance, and enhanced data-driven decision-making are outweighing these obstacles. The market segmentation by region (North America, Europe, Asia-Pacific, and Rest of the World), deployment (on-premises and cloud), and application showcases the diverse opportunities within this dynamic landscape. Key players like ADP, Oracle, and Workday are actively shaping the market with their innovative solutions and strategic acquisitions. The ongoing evolution of technology and increasing demand for integrated HR solutions will continue to drive significant growth in the coming years.
Compensation Planning Software Market Report: 2019-2033
This comprehensive report provides a detailed analysis of the Compensation Planning Software industry, encompassing market dynamics, growth trends, regional dominance, product landscape, key players, and future outlook. The study period covers 2019-2033, with 2025 as the base and estimated year. The forecast period spans 2025-2033, and the historical period encompasses 2019-2024. The total market size in 2025 is estimated at xx Million.
Compensation Planning Software Industry Market Dynamics & Structure
This section analyzes the competitive landscape, technological advancements, regulatory impacts, and market consolidation within the compensation planning software market. The global market is characterized by a moderate level of concentration, with key players holding significant market share. However, the presence of numerous niche players and continuous technological innovation fosters a dynamic competitive environment. The market's growth is driven by factors such as increasing demand for automated payroll processing, the rising adoption of cloud-based solutions, and stringent regulatory compliance requirements.
- Market Concentration: The top 10 players account for approximately xx% of the global market share in 2025.
- Technological Innovation: The shift towards AI-powered compensation planning, integration with HRIS systems, and advanced analytics are major drivers of innovation. Barriers to innovation include high development costs and the need for specialized talent.
- Regulatory Frameworks: Compliance with data privacy regulations (GDPR, CCPA) and labor laws significantly impacts software development and adoption strategies.
- Competitive Product Substitutes: Spreadsheets and legacy systems pose competition, but the need for efficiency and integration increasingly favors specialized software.
- End-User Demographics: The market caters to businesses of all sizes, with a significant focus on large enterprises and mid-sized companies looking to optimize compensation management processes.
- M&A Trends: The industry witnessed xx M&A deals in the period 2019-2024, driven by the need for technological expansion and market consolidation. This indicates a consolidation trend within the industry with larger players actively acquiring smaller companies to expand their product portfolios and market reach.
Compensation Planning Software Industry Growth Trends & Insights
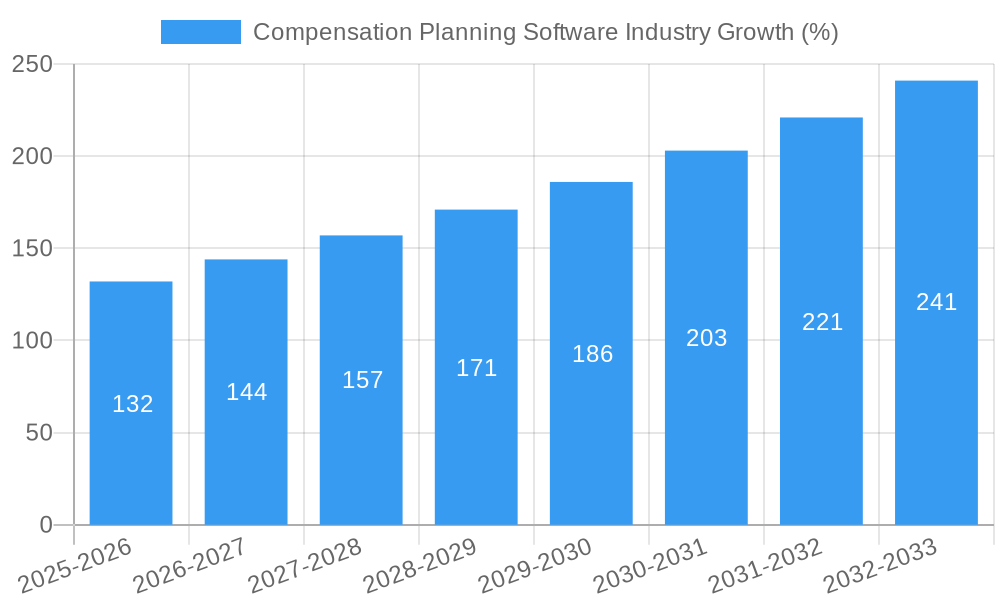
The compensation planning software market has witnessed substantial growth during the historical period (2019-2024), with a Compound Annual Growth Rate (CAGR) of xx%. This growth is attributed to the increasing adoption of cloud-based solutions, the growing need for efficient payroll management, and the demand for advanced analytics in compensation decision-making. Market penetration is expected to increase significantly over the forecast period (2025-2033) driven by increasing digitalization, especially among SMEs. Technological disruptions, such as the integration of artificial intelligence and machine learning, are expected to further accelerate market growth. Consumer behavior shifts towards increased self-service portals and mobile accessibility contribute to the market's expansion. The market size is projected to reach xx Million by 2033, showing a robust CAGR of xx% during the forecast period.
Dominant Regions, Countries, or Segments in Compensation Planning Software Industry
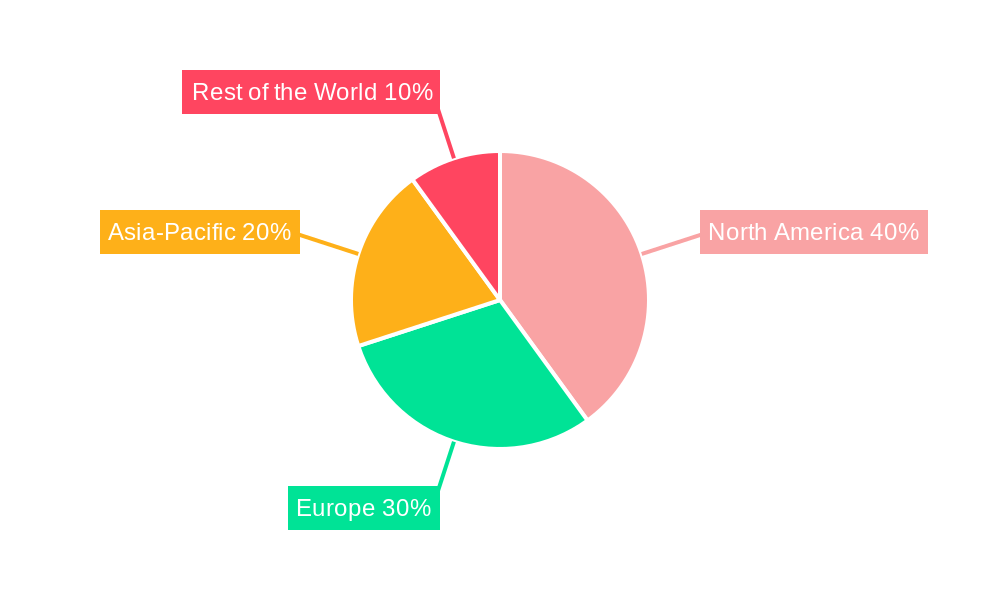
North America currently holds the largest market share, followed by Europe and Asia-Pacific. The dominance of North America is driven by high technological adoption rates, strong regulatory frameworks, and the presence of numerous established players. However, Asia-Pacific is projected to witness significant growth due to increasing digitalization, a large workforce, and rising investments in IT infrastructure.
- By Region: North America (xx Million), Europe (xx Million), Asia-Pacific (xx Million), Rest of the World (xx Million) in 2025.
- By Type: Software (xx Million) is the dominant segment, followed by Services (xx Million).
- By Application: Payroll (xx Million), Employee Benefits (xx Million) and Performance Review (xx Million) are the major application segments driving market growth.
- By Deployment: Cloud Hosted Deployment (xx Million) is gaining rapid traction compared to On-Premises Deployment (xx Million).
- By End-User Industry: BFSI (xx Million), Retail (xx Million), and Manufacturing (xx Million) segments are major consumers of compensation planning software.
Compensation Planning Software Industry Product Landscape
Compensation planning software solutions are increasingly incorporating advanced features such as AI-powered analytics, automated workflows, and robust reporting capabilities. These advancements aim to streamline compensation processes, reduce manual errors, and enhance compliance. Unique selling propositions include integrated HR systems, customizable dashboards, and real-time data visualization. Technological advancements in areas like machine learning enable improved forecasting and compensation recommendations.
Key Drivers, Barriers & Challenges in Compensation Planning Software Industry
Key Drivers:
- Increasing adoption of cloud-based solutions.
- Growing demand for efficient payroll and benefits management.
- Stringent regulatory compliance requirements.
- Need for data-driven decision-making in compensation.
Key Challenges:
- High implementation costs and integration complexities.
- Data security and privacy concerns.
- Resistance to change among employees and managers.
- Competition from established and emerging players.
Emerging Opportunities in Compensation Planning Software Industry
Emerging opportunities lie in the development of specialized solutions for niche industries, integration with emerging technologies like blockchain for secure data management, and expansion into untapped geographical markets. The focus on personalization and AI-driven compensation recommendations offers significant potential. The growth of the gig economy necessitates specialized compensation management solutions for independent contractors.
Growth Accelerators in the Compensation Planning Software Industry
Strategic partnerships between compensation planning software providers and HR consulting firms, coupled with investments in R&D to develop AI-driven capabilities, are major catalysts driving long-term growth. Expansion into emerging markets and the development of user-friendly mobile applications are crucial factors in accelerating market expansion.
Key Players Shaping the Compensation Planning Software Market
- TMF Group Holding B V
- Ultimate Software Group
- Jobvite Inc
- Intuit Inc
- Paychex Inc
- Paycom Software Inc
- Kronos Incorporated
- Paylocity Corporation
- Automatic Data Processing Inc (ADP)
- Ramco Systems Limited
- Oracle Corporation
- Paycor Inc
- TriNet Group Inc
- Sage Group plc
- SAP SE
Notable Milestones in Compensation Planning Software Industry Sector
- January 2022: Paylocity acquired Cloudsnap Inc., enhancing its cloud-based HR and payroll solutions with automated data integration capabilities. This acquisition significantly improved the efficiency and user experience of Paylocity's platform, strengthening its competitive position in the market.
In-Depth Compensation Planning Software Industry Market Outlook
The compensation planning software market is poised for continued growth, driven by technological innovation, increasing demand for automation, and the growing need for data-driven decision-making in compensation management. Strategic partnerships, expansion into new markets, and the development of AI-powered features will further accelerate market expansion. The market offers significant opportunities for both established players and emerging companies to capitalize on the increasing demand for efficient and compliant compensation solutions.
Compensation Planning Software Industry Segmentation
-
1. Type
- 1.1. Software
- 1.2. Services
- 1.3. Applications
-
2. Application
- 2.1. Payroll
- 2.2. Employee Benefits
- 2.3. Tax Filings
- 2.4. Performance Review
- 2.5. Time And Attendance
- 2.6. Leave Management
- 2.7. Reimbursement And Loans
-
3. Deployment
- 3.1. On-Premises Deployment
- 3.2. Cloud Hosted Deployment
-
4. End-User Industry
- 4.1. BFSI
- 4.2. Retail
- 4.3. Manufacturing
- 4.4. Transportation & Logistics
- 4.5. IT & Telecom
- 4.6. Healthcare
- 4.7. Others
Compensation Planning Software Industry Segmentation By Geography
-
1. North America
- 1.1. United States
- 1.2. Canada
- 1.3. Mexico
-
2. South America
- 2.1. Brazil
- 2.2. Argentina
- 2.3. Rest of South America
-
3. Europe
- 3.1. United Kingdom
- 3.2. Germany
- 3.3. France
- 3.4. Italy
- 3.5. Spain
- 3.6. Russia
- 3.7. Benelux
- 3.8. Nordics
- 3.9. Rest of Europe
-
4. Middle East & Africa
- 4.1. Turkey
- 4.2. Israel
- 4.3. GCC
- 4.4. North Africa
- 4.5. South Africa
- 4.6. Rest of Middle East & Africa
-
5. Asia Pacific
- 5.1. China
- 5.2. India
- 5.3. Japan
- 5.4. South Korea
- 5.5. ASEAN
- 5.6. Oceania
- 5.7. Rest of Asia Pacific
Compensation Planning Software Industry REPORT HIGHLIGHTS
| Aspects | Details |
|---|---|
| Study Period | 2019-2033 |
| Base Year | 2024 |
| Estimated Year | 2025 |
| Forecast Period | 2025-2033 |
| Historical Period | 2019-2024 |
| Growth Rate | CAGR of 8.80% from 2019-2033 |
| Segmentation |
|
Table of Contents
- 1. Introduction
- 1.1. Research Scope
- 1.2. Market Segmentation
- 1.3. Research Methodology
- 1.4. Definitions and Assumptions
- 2. Executive Summary
- 2.1. Introduction
- 3. Market Dynamics
- 3.1. Introduction
- 3.2. Market Drivers
- 3.2.1. Growing needs for Payroll Cost Visibility
- 3.3. Market Restrains
- 3.3.1. Lack of Awareness About Workforce Analytics
- 3.4. Market Trends
- 3.4.1. Cloud based systems to drive the Market
- 4. Market Factor Analysis
- 4.1. Porters Five Forces
- 4.2. Supply/Value Chain
- 4.3. PESTEL analysis
- 4.4. Market Entropy
- 4.5. Patent/Trademark Analysis
- 5. Global Compensation Planning Software Industry Analysis, Insights and Forecast, 2019-2031
- 5.1. Market Analysis, Insights and Forecast - by Type
- 5.1.1. Software
- 5.1.2. Services
- 5.1.3. Applications
- 5.2. Market Analysis, Insights and Forecast - by Application
- 5.2.1. Payroll
- 5.2.2. Employee Benefits
- 5.2.3. Tax Filings
- 5.2.4. Performance Review
- 5.2.5. Time And Attendance
- 5.2.6. Leave Management
- 5.2.7. Reimbursement And Loans
- 5.3. Market Analysis, Insights and Forecast - by Deployment
- 5.3.1. On-Premises Deployment
- 5.3.2. Cloud Hosted Deployment
- 5.4. Market Analysis, Insights and Forecast - by End-User Industry
- 5.4.1. BFSI
- 5.4.2. Retail
- 5.4.3. Manufacturing
- 5.4.4. Transportation & Logistics
- 5.4.5. IT & Telecom
- 5.4.6. Healthcare
- 5.4.7. Others
- 5.5. Market Analysis, Insights and Forecast - by Region
- 5.5.1. North America
- 5.5.2. South America
- 5.5.3. Europe
- 5.5.4. Middle East & Africa
- 5.5.5. Asia Pacific
- 5.1. Market Analysis, Insights and Forecast - by Type
- 6. North America Compensation Planning Software Industry Analysis, Insights and Forecast, 2019-2031
- 6.1. Market Analysis, Insights and Forecast - by Type
- 6.1.1. Software
- 6.1.2. Services
- 6.1.3. Applications
- 6.2. Market Analysis, Insights and Forecast - by Application
- 6.2.1. Payroll
- 6.2.2. Employee Benefits
- 6.2.3. Tax Filings
- 6.2.4. Performance Review
- 6.2.5. Time And Attendance
- 6.2.6. Leave Management
- 6.2.7. Reimbursement And Loans
- 6.3. Market Analysis, Insights and Forecast - by Deployment
- 6.3.1. On-Premises Deployment
- 6.3.2. Cloud Hosted Deployment
- 6.4. Market Analysis, Insights and Forecast - by End-User Industry
- 6.4.1. BFSI
- 6.4.2. Retail
- 6.4.3. Manufacturing
- 6.4.4. Transportation & Logistics
- 6.4.5. IT & Telecom
- 6.4.6. Healthcare
- 6.4.7. Others
- 6.1. Market Analysis, Insights and Forecast - by Type
- 7. South America Compensation Planning Software Industry Analysis, Insights and Forecast, 2019-2031
- 7.1. Market Analysis, Insights and Forecast - by Type
- 7.1.1. Software
- 7.1.2. Services
- 7.1.3. Applications
- 7.2. Market Analysis, Insights and Forecast - by Application
- 7.2.1. Payroll
- 7.2.2. Employee Benefits
- 7.2.3. Tax Filings
- 7.2.4. Performance Review
- 7.2.5. Time And Attendance
- 7.2.6. Leave Management
- 7.2.7. Reimbursement And Loans
- 7.3. Market Analysis, Insights and Forecast - by Deployment
- 7.3.1. On-Premises Deployment
- 7.3.2. Cloud Hosted Deployment
- 7.4. Market Analysis, Insights and Forecast - by End-User Industry
- 7.4.1. BFSI
- 7.4.2. Retail
- 7.4.3. Manufacturing
- 7.4.4. Transportation & Logistics
- 7.4.5. IT & Telecom
- 7.4.6. Healthcare
- 7.4.7. Others
- 7.1. Market Analysis, Insights and Forecast - by Type
- 8. Europe Compensation Planning Software Industry Analysis, Insights and Forecast, 2019-2031
- 8.1. Market Analysis, Insights and Forecast - by Type
- 8.1.1. Software
- 8.1.2. Services
- 8.1.3. Applications
- 8.2. Market Analysis, Insights and Forecast - by Application
- 8.2.1. Payroll
- 8.2.2. Employee Benefits
- 8.2.3. Tax Filings
- 8.2.4. Performance Review
- 8.2.5. Time And Attendance
- 8.2.6. Leave Management
- 8.2.7. Reimbursement And Loans
- 8.3. Market Analysis, Insights and Forecast - by Deployment
- 8.3.1. On-Premises Deployment
- 8.3.2. Cloud Hosted Deployment
- 8.4. Market Analysis, Insights and Forecast - by End-User Industry
- 8.4.1. BFSI
- 8.4.2. Retail
- 8.4.3. Manufacturing
- 8.4.4. Transportation & Logistics
- 8.4.5. IT & Telecom
- 8.4.6. Healthcare
- 8.4.7. Others
- 8.1. Market Analysis, Insights and Forecast - by Type
- 9. Middle East & Africa Compensation Planning Software Industry Analysis, Insights and Forecast, 2019-2031
- 9.1. Market Analysis, Insights and Forecast - by Type
- 9.1.1. Software
- 9.1.2. Services
- 9.1.3. Applications
- 9.2. Market Analysis, Insights and Forecast - by Application
- 9.2.1. Payroll
- 9.2.2. Employee Benefits
- 9.2.3. Tax Filings
- 9.2.4. Performance Review
- 9.2.5. Time And Attendance
- 9.2.6. Leave Management
- 9.2.7. Reimbursement And Loans
- 9.3. Market Analysis, Insights and Forecast - by Deployment
- 9.3.1. On-Premises Deployment
- 9.3.2. Cloud Hosted Deployment
- 9.4. Market Analysis, Insights and Forecast - by End-User Industry
- 9.4.1. BFSI
- 9.4.2. Retail
- 9.4.3. Manufacturing
- 9.4.4. Transportation & Logistics
- 9.4.5. IT & Telecom
- 9.4.6. Healthcare
- 9.4.7. Others
- 9.1. Market Analysis, Insights and Forecast - by Type
- 10. Asia Pacific Compensation Planning Software Industry Analysis, Insights and Forecast, 2019-2031
- 10.1. Market Analysis, Insights and Forecast - by Type
- 10.1.1. Software
- 10.1.2. Services
- 10.1.3. Applications
- 10.2. Market Analysis, Insights and Forecast - by Application
- 10.2.1. Payroll
- 10.2.2. Employee Benefits
- 10.2.3. Tax Filings
- 10.2.4. Performance Review
- 10.2.5. Time And Attendance
- 10.2.6. Leave Management
- 10.2.7. Reimbursement And Loans
- 10.3. Market Analysis, Insights and Forecast - by Deployment
- 10.3.1. On-Premises Deployment
- 10.3.2. Cloud Hosted Deployment
- 10.4. Market Analysis, Insights and Forecast - by End-User Industry
- 10.4.1. BFSI
- 10.4.2. Retail
- 10.4.3. Manufacturing
- 10.4.4. Transportation & Logistics
- 10.4.5. IT & Telecom
- 10.4.6. Healthcare
- 10.4.7. Others
- 10.1. Market Analysis, Insights and Forecast - by Type
- 11. North America Compensation Planning Software Industry Analysis, Insights and Forecast, 2019-2031
- 11.1. Market Analysis, Insights and Forecast - By Country/Sub-region
- 11.1.1 United States
- 11.1.2 Canada
- 11.1.3 Mexico
- 12. Europe Compensation Planning Software Industry Analysis, Insights and Forecast, 2019-2031
- 12.1. Market Analysis, Insights and Forecast - By Country/Sub-region
- 12.1.1 Germany
- 12.1.2 United Kingdom
- 12.1.3 France
- 12.1.4 Spain
- 12.1.5 Italy
- 12.1.6 Spain
- 12.1.7 Belgium
- 12.1.8 Netherland
- 12.1.9 Nordics
- 12.1.10 Rest of Europe
- 13. Asia Pacific Compensation Planning Software Industry Analysis, Insights and Forecast, 2019-2031
- 13.1. Market Analysis, Insights and Forecast - By Country/Sub-region
- 13.1.1 China
- 13.1.2 Japan
- 13.1.3 India
- 13.1.4 South Korea
- 13.1.5 Southeast Asia
- 13.1.6 Australia
- 13.1.7 Indonesia
- 13.1.8 Phillipes
- 13.1.9 Singapore
- 13.1.10 Thailandc
- 13.1.11 Rest of Asia Pacific
- 14. South America Compensation Planning Software Industry Analysis, Insights and Forecast, 2019-2031
- 14.1. Market Analysis, Insights and Forecast - By Country/Sub-region
- 14.1.1 Brazil
- 14.1.2 Argentina
- 14.1.3 Peru
- 14.1.4 Chile
- 14.1.5 Colombia
- 14.1.6 Ecuador
- 14.1.7 Venezuela
- 14.1.8 Rest of South America
- 15. North America Compensation Planning Software Industry Analysis, Insights and Forecast, 2019-2031
- 15.1. Market Analysis, Insights and Forecast - By Country/Sub-region
- 15.1.1 United States
- 15.1.2 Canada
- 15.1.3 Mexico
- 16. MEA Compensation Planning Software Industry Analysis, Insights and Forecast, 2019-2031
- 16.1. Market Analysis, Insights and Forecast - By Country/Sub-region
- 16.1.1 United Arab Emirates
- 16.1.2 Saudi Arabia
- 16.1.3 South Africa
- 16.1.4 Rest of Middle East and Africa
- 17. Competitive Analysis
- 17.1. Global Market Share Analysis 2024
- 17.2. Company Profiles
- 17.2.1 TMF Group Holding B V
- 17.2.1.1. Overview
- 17.2.1.2. Products
- 17.2.1.3. SWOT Analysis
- 17.2.1.4. Recent Developments
- 17.2.1.5. Financials (Based on Availability)
- 17.2.2 Ultimate Software Group
- 17.2.2.1. Overview
- 17.2.2.2. Products
- 17.2.2.3. SWOT Analysis
- 17.2.2.4. Recent Developments
- 17.2.2.5. Financials (Based on Availability)
- 17.2.3 Jobvite Inc
- 17.2.3.1. Overview
- 17.2.3.2. Products
- 17.2.3.3. SWOT Analysis
- 17.2.3.4. Recent Developments
- 17.2.3.5. Financials (Based on Availability)
- 17.2.4 Intuit Inc
- 17.2.4.1. Overview
- 17.2.4.2. Products
- 17.2.4.3. SWOT Analysis
- 17.2.4.4. Recent Developments
- 17.2.4.5. Financials (Based on Availability)
- 17.2.5 Paychex Inc
- 17.2.5.1. Overview
- 17.2.5.2. Products
- 17.2.5.3. SWOT Analysis
- 17.2.5.4. Recent Developments
- 17.2.5.5. Financials (Based on Availability)
- 17.2.6 Paycom Software Inc
- 17.2.6.1. Overview
- 17.2.6.2. Products
- 17.2.6.3. SWOT Analysis
- 17.2.6.4. Recent Developments
- 17.2.6.5. Financials (Based on Availability)
- 17.2.7 Kronos Incorporated
- 17.2.7.1. Overview
- 17.2.7.2. Products
- 17.2.7.3. SWOT Analysis
- 17.2.7.4. Recent Developments
- 17.2.7.5. Financials (Based on Availability)
- 17.2.8 Paylocity Corporation
- 17.2.8.1. Overview
- 17.2.8.2. Products
- 17.2.8.3. SWOT Analysis
- 17.2.8.4. Recent Developments
- 17.2.8.5. Financials (Based on Availability)
- 17.2.9 Automatic Data Processing Inc (ADP)
- 17.2.9.1. Overview
- 17.2.9.2. Products
- 17.2.9.3. SWOT Analysis
- 17.2.9.4. Recent Developments
- 17.2.9.5. Financials (Based on Availability)
- 17.2.10 Ramco Systems Limited
- 17.2.10.1. Overview
- 17.2.10.2. Products
- 17.2.10.3. SWOT Analysis
- 17.2.10.4. Recent Developments
- 17.2.10.5. Financials (Based on Availability)
- 17.2.11 Oracle Corporation
- 17.2.11.1. Overview
- 17.2.11.2. Products
- 17.2.11.3. SWOT Analysis
- 17.2.11.4. Recent Developments
- 17.2.11.5. Financials (Based on Availability)
- 17.2.12 Paycor Inc
- 17.2.12.1. Overview
- 17.2.12.2. Products
- 17.2.12.3. SWOT Analysis
- 17.2.12.4. Recent Developments
- 17.2.12.5. Financials (Based on Availability)
- 17.2.13 TriNet Group Inc
- 17.2.13.1. Overview
- 17.2.13.2. Products
- 17.2.13.3. SWOT Analysis
- 17.2.13.4. Recent Developments
- 17.2.13.5. Financials (Based on Availability)
- 17.2.14 Sage Group plc
- 17.2.14.1. Overview
- 17.2.14.2. Products
- 17.2.14.3. SWOT Analysis
- 17.2.14.4. Recent Developments
- 17.2.14.5. Financials (Based on Availability)
- 17.2.15 SAP SE
- 17.2.15.1. Overview
- 17.2.15.2. Products
- 17.2.15.3. SWOT Analysis
- 17.2.15.4. Recent Developments
- 17.2.15.5. Financials (Based on Availability)
- 17.2.1 TMF Group Holding B V
List of Figures
- Figure 1: Global Compensation Planning Software Industry Revenue Breakdown (Million, %) by Region 2024 & 2032
- Figure 2: Global Compensation Planning Software Industry Volume Breakdown (K Unit, %) by Region 2024 & 2032
- Figure 3: North America Compensation Planning Software Industry Revenue (Million), by Country 2024 & 2032
- Figure 4: North America Compensation Planning Software Industry Volume (K Unit), by Country 2024 & 2032
- Figure 5: North America Compensation Planning Software Industry Revenue Share (%), by Country 2024 & 2032
- Figure 6: North America Compensation Planning Software Industry Volume Share (%), by Country 2024 & 2032
- Figure 7: Europe Compensation Planning Software Industry Revenue (Million), by Country 2024 & 2032
- Figure 8: Europe Compensation Planning Software Industry Volume (K Unit), by Country 2024 & 2032
- Figure 9: Europe Compensation Planning Software Industry Revenue Share (%), by Country 2024 & 2032
- Figure 10: Europe Compensation Planning Software Industry Volume Share (%), by Country 2024 & 2032
- Figure 11: Asia Pacific Compensation Planning Software Industry Revenue (Million), by Country 2024 & 2032
- Figure 12: Asia Pacific Compensation Planning Software Industry Volume (K Unit), by Country 2024 & 2032
- Figure 13: Asia Pacific Compensation Planning Software Industry Revenue Share (%), by Country 2024 & 2032
- Figure 14: Asia Pacific Compensation Planning Software Industry Volume Share (%), by Country 2024 & 2032
- Figure 15: South America Compensation Planning Software Industry Revenue (Million), by Country 2024 & 2032
- Figure 16: South America Compensation Planning Software Industry Volume (K Unit), by Country 2024 & 2032
- Figure 17: South America Compensation Planning Software Industry Revenue Share (%), by Country 2024 & 2032
- Figure 18: South America Compensation Planning Software Industry Volume Share (%), by Country 2024 & 2032
- Figure 19: North America Compensation Planning Software Industry Revenue (Million), by Country 2024 & 2032
- Figure 20: North America Compensation Planning Software Industry Volume (K Unit), by Country 2024 & 2032
- Figure 21: North America Compensation Planning Software Industry Revenue Share (%), by Country 2024 & 2032
- Figure 22: North America Compensation Planning Software Industry Volume Share (%), by Country 2024 & 2032
- Figure 23: MEA Compensation Planning Software Industry Revenue (Million), by Country 2024 & 2032
- Figure 24: MEA Compensation Planning Software Industry Volume (K Unit), by Country 2024 & 2032
- Figure 25: MEA Compensation Planning Software Industry Revenue Share (%), by Country 2024 & 2032
- Figure 26: MEA Compensation Planning Software Industry Volume Share (%), by Country 2024 & 2032
- Figure 27: North America Compensation Planning Software Industry Revenue (Million), by Type 2024 & 2032
- Figure 28: North America Compensation Planning Software Industry Volume (K Unit), by Type 2024 & 2032
- Figure 29: North America Compensation Planning Software Industry Revenue Share (%), by Type 2024 & 2032
- Figure 30: North America Compensation Planning Software Industry Volume Share (%), by Type 2024 & 2032
- Figure 31: North America Compensation Planning Software Industry Revenue (Million), by Application 2024 & 2032
- Figure 32: North America Compensation Planning Software Industry Volume (K Unit), by Application 2024 & 2032
- Figure 33: North America Compensation Planning Software Industry Revenue Share (%), by Application 2024 & 2032
- Figure 34: North America Compensation Planning Software Industry Volume Share (%), by Application 2024 & 2032
- Figure 35: North America Compensation Planning Software Industry Revenue (Million), by Deployment 2024 & 2032
- Figure 36: North America Compensation Planning Software Industry Volume (K Unit), by Deployment 2024 & 2032
- Figure 37: North America Compensation Planning Software Industry Revenue Share (%), by Deployment 2024 & 2032
- Figure 38: North America Compensation Planning Software Industry Volume Share (%), by Deployment 2024 & 2032
- Figure 39: North America Compensation Planning Software Industry Revenue (Million), by End-User Industry 2024 & 2032
- Figure 40: North America Compensation Planning Software Industry Volume (K Unit), by End-User Industry 2024 & 2032
- Figure 41: North America Compensation Planning Software Industry Revenue Share (%), by End-User Industry 2024 & 2032
- Figure 42: North America Compensation Planning Software Industry Volume Share (%), by End-User Industry 2024 & 2032
- Figure 43: North America Compensation Planning Software Industry Revenue (Million), by Country 2024 & 2032
- Figure 44: North America Compensation Planning Software Industry Volume (K Unit), by Country 2024 & 2032
- Figure 45: North America Compensation Planning Software Industry Revenue Share (%), by Country 2024 & 2032
- Figure 46: North America Compensation Planning Software Industry Volume Share (%), by Country 2024 & 2032
- Figure 47: South America Compensation Planning Software Industry Revenue (Million), by Type 2024 & 2032
- Figure 48: South America Compensation Planning Software Industry Volume (K Unit), by Type 2024 & 2032
- Figure 49: South America Compensation Planning Software Industry Revenue Share (%), by Type 2024 & 2032
- Figure 50: South America Compensation Planning Software Industry Volume Share (%), by Type 2024 & 2032
- Figure 51: South America Compensation Planning Software Industry Revenue (Million), by Application 2024 & 2032
- Figure 52: South America Compensation Planning Software Industry Volume (K Unit), by Application 2024 & 2032
- Figure 53: South America Compensation Planning Software Industry Revenue Share (%), by Application 2024 & 2032
- Figure 54: South America Compensation Planning Software Industry Volume Share (%), by Application 2024 & 2032
- Figure 55: South America Compensation Planning Software Industry Revenue (Million), by Deployment 2024 & 2032
- Figure 56: South America Compensation Planning Software Industry Volume (K Unit), by Deployment 2024 & 2032
- Figure 57: South America Compensation Planning Software Industry Revenue Share (%), by Deployment 2024 & 2032
- Figure 58: South America Compensation Planning Software Industry Volume Share (%), by Deployment 2024 & 2032
- Figure 59: South America Compensation Planning Software Industry Revenue (Million), by End-User Industry 2024 & 2032
- Figure 60: South America Compensation Planning Software Industry Volume (K Unit), by End-User Industry 2024 & 2032
- Figure 61: South America Compensation Planning Software Industry Revenue Share (%), by End-User Industry 2024 & 2032
- Figure 62: South America Compensation Planning Software Industry Volume Share (%), by End-User Industry 2024 & 2032
- Figure 63: South America Compensation Planning Software Industry Revenue (Million), by Country 2024 & 2032
- Figure 64: South America Compensation Planning Software Industry Volume (K Unit), by Country 2024 & 2032
- Figure 65: South America Compensation Planning Software Industry Revenue Share (%), by Country 2024 & 2032
- Figure 66: South America Compensation Planning Software Industry Volume Share (%), by Country 2024 & 2032
- Figure 67: Europe Compensation Planning Software Industry Revenue (Million), by Type 2024 & 2032
- Figure 68: Europe Compensation Planning Software Industry Volume (K Unit), by Type 2024 & 2032
- Figure 69: Europe Compensation Planning Software Industry Revenue Share (%), by Type 2024 & 2032
- Figure 70: Europe Compensation Planning Software Industry Volume Share (%), by Type 2024 & 2032
- Figure 71: Europe Compensation Planning Software Industry Revenue (Million), by Application 2024 & 2032
- Figure 72: Europe Compensation Planning Software Industry Volume (K Unit), by Application 2024 & 2032
- Figure 73: Europe Compensation Planning Software Industry Revenue Share (%), by Application 2024 & 2032
- Figure 74: Europe Compensation Planning Software Industry Volume Share (%), by Application 2024 & 2032
- Figure 75: Europe Compensation Planning Software Industry Revenue (Million), by Deployment 2024 & 2032
- Figure 76: Europe Compensation Planning Software Industry Volume (K Unit), by Deployment 2024 & 2032
- Figure 77: Europe Compensation Planning Software Industry Revenue Share (%), by Deployment 2024 & 2032
- Figure 78: Europe Compensation Planning Software Industry Volume Share (%), by Deployment 2024 & 2032
- Figure 79: Europe Compensation Planning Software Industry Revenue (Million), by End-User Industry 2024 & 2032
- Figure 80: Europe Compensation Planning Software Industry Volume (K Unit), by End-User Industry 2024 & 2032
- Figure 81: Europe Compensation Planning Software Industry Revenue Share (%), by End-User Industry 2024 & 2032
- Figure 82: Europe Compensation Planning Software Industry Volume Share (%), by End-User Industry 2024 & 2032
- Figure 83: Europe Compensation Planning Software Industry Revenue (Million), by Country 2024 & 2032
- Figure 84: Europe Compensation Planning Software Industry Volume (K Unit), by Country 2024 & 2032
- Figure 85: Europe Compensation Planning Software Industry Revenue Share (%), by Country 2024 & 2032
- Figure 86: Europe Compensation Planning Software Industry Volume Share (%), by Country 2024 & 2032
- Figure 87: Middle East & Africa Compensation Planning Software Industry Revenue (Million), by Type 2024 & 2032
- Figure 88: Middle East & Africa Compensation Planning Software Industry Volume (K Unit), by Type 2024 & 2032
- Figure 89: Middle East & Africa Compensation Planning Software Industry Revenue Share (%), by Type 2024 & 2032
- Figure 90: Middle East & Africa Compensation Planning Software Industry Volume Share (%), by Type 2024 & 2032
- Figure 91: Middle East & Africa Compensation Planning Software Industry Revenue (Million), by Application 2024 & 2032
- Figure 92: Middle East & Africa Compensation Planning Software Industry Volume (K Unit), by Application 2024 & 2032
- Figure 93: Middle East & Africa Compensation Planning Software Industry Revenue Share (%), by Application 2024 & 2032
- Figure 94: Middle East & Africa Compensation Planning Software Industry Volume Share (%), by Application 2024 & 2032
- Figure 95: Middle East & Africa Compensation Planning Software Industry Revenue (Million), by Deployment 2024 & 2032
- Figure 96: Middle East & Africa Compensation Planning Software Industry Volume (K Unit), by Deployment 2024 & 2032
- Figure 97: Middle East & Africa Compensation Planning Software Industry Revenue Share (%), by Deployment 2024 & 2032
- Figure 98: Middle East & Africa Compensation Planning Software Industry Volume Share (%), by Deployment 2024 & 2032
- Figure 99: Middle East & Africa Compensation Planning Software Industry Revenue (Million), by End-User Industry 2024 & 2032
- Figure 100: Middle East & Africa Compensation Planning Software Industry Volume (K Unit), by End-User Industry 2024 & 2032
- Figure 101: Middle East & Africa Compensation Planning Software Industry Revenue Share (%), by End-User Industry 2024 & 2032
- Figure 102: Middle East & Africa Compensation Planning Software Industry Volume Share (%), by End-User Industry 2024 & 2032
- Figure 103: Middle East & Africa Compensation Planning Software Industry Revenue (Million), by Country 2024 & 2032
- Figure 104: Middle East & Africa Compensation Planning Software Industry Volume (K Unit), by Country 2024 & 2032
- Figure 105: Middle East & Africa Compensation Planning Software Industry Revenue Share (%), by Country 2024 & 2032
- Figure 106: Middle East & Africa Compensation Planning Software Industry Volume Share (%), by Country 2024 & 2032
- Figure 107: Asia Pacific Compensation Planning Software Industry Revenue (Million), by Type 2024 & 2032
- Figure 108: Asia Pacific Compensation Planning Software Industry Volume (K Unit), by Type 2024 & 2032
- Figure 109: Asia Pacific Compensation Planning Software Industry Revenue Share (%), by Type 2024 & 2032
- Figure 110: Asia Pacific Compensation Planning Software Industry Volume Share (%), by Type 2024 & 2032
- Figure 111: Asia Pacific Compensation Planning Software Industry Revenue (Million), by Application 2024 & 2032
- Figure 112: Asia Pacific Compensation Planning Software Industry Volume (K Unit), by Application 2024 & 2032
- Figure 113: Asia Pacific Compensation Planning Software Industry Revenue Share (%), by Application 2024 & 2032
- Figure 114: Asia Pacific Compensation Planning Software Industry Volume Share (%), by Application 2024 & 2032
- Figure 115: Asia Pacific Compensation Planning Software Industry Revenue (Million), by Deployment 2024 & 2032
- Figure 116: Asia Pacific Compensation Planning Software Industry Volume (K Unit), by Deployment 2024 & 2032
- Figure 117: Asia Pacific Compensation Planning Software Industry Revenue Share (%), by Deployment 2024 & 2032
- Figure 118: Asia Pacific Compensation Planning Software Industry Volume Share (%), by Deployment 2024 & 2032
- Figure 119: Asia Pacific Compensation Planning Software Industry Revenue (Million), by End-User Industry 2024 & 2032
- Figure 120: Asia Pacific Compensation Planning Software Industry Volume (K Unit), by End-User Industry 2024 & 2032
- Figure 121: Asia Pacific Compensation Planning Software Industry Revenue Share (%), by End-User Industry 2024 & 2032
- Figure 122: Asia Pacific Compensation Planning Software Industry Volume Share (%), by End-User Industry 2024 & 2032
- Figure 123: Asia Pacific Compensation Planning Software Industry Revenue (Million), by Country 2024 & 2032
- Figure 124: Asia Pacific Compensation Planning Software Industry Volume (K Unit), by Country 2024 & 2032
- Figure 125: Asia Pacific Compensation Planning Software Industry Revenue Share (%), by Country 2024 & 2032
- Figure 126: Asia Pacific Compensation Planning Software Industry Volume Share (%), by Country 2024 & 2032
List of Tables
- Table 1: Global Compensation Planning Software Industry Revenue Million Forecast, by Region 2019 & 2032
- Table 2: Global Compensation Planning Software Industry Volume K Unit Forecast, by Region 2019 & 2032
- Table 3: Global Compensation Planning Software Industry Revenue Million Forecast, by Type 2019 & 2032
- Table 4: Global Compensation Planning Software Industry Volume K Unit Forecast, by Type 2019 & 2032
- Table 5: Global Compensation Planning Software Industry Revenue Million Forecast, by Application 2019 & 2032
- Table 6: Global Compensation Planning Software Industry Volume K Unit Forecast, by Application 2019 & 2032
- Table 7: Global Compensation Planning Software Industry Revenue Million Forecast, by Deployment 2019 & 2032
- Table 8: Global Compensation Planning Software Industry Volume K Unit Forecast, by Deployment 2019 & 2032
- Table 9: Global Compensation Planning Software Industry Revenue Million Forecast, by End-User Industry 2019 & 2032
- Table 10: Global Compensation Planning Software Industry Volume K Unit Forecast, by End-User Industry 2019 & 2032
- Table 11: Global Compensation Planning Software Industry Revenue Million Forecast, by Region 2019 & 2032
- Table 12: Global Compensation Planning Software Industry Volume K Unit Forecast, by Region 2019 & 2032
- Table 13: Global Compensation Planning Software Industry Revenue Million Forecast, by Country 2019 & 2032
- Table 14: Global Compensation Planning Software Industry Volume K Unit Forecast, by Country 2019 & 2032
- Table 15: United States Compensation Planning Software Industry Revenue (Million) Forecast, by Application 2019 & 2032
- Table 16: United States Compensation Planning Software Industry Volume (K Unit) Forecast, by Application 2019 & 2032
- Table 17: Canada Compensation Planning Software Industry Revenue (Million) Forecast, by Application 2019 & 2032
- Table 18: Canada Compensation Planning Software Industry Volume (K Unit) Forecast, by Application 2019 & 2032
- Table 19: Mexico Compensation Planning Software Industry Revenue (Million) Forecast, by Application 2019 & 2032
- Table 20: Mexico Compensation Planning Software Industry Volume (K Unit) Forecast, by Application 2019 & 2032
- Table 21: Global Compensation Planning Software Industry Revenue Million Forecast, by Country 2019 & 2032
- Table 22: Global Compensation Planning Software Industry Volume K Unit Forecast, by Country 2019 & 2032
- Table 23: Germany Compensation Planning Software Industry Revenue (Million) Forecast, by Application 2019 & 2032
- Table 24: Germany Compensation Planning Software Industry Volume (K Unit) Forecast, by Application 2019 & 2032
- Table 25: United Kingdom Compensation Planning Software Industry Revenue (Million) Forecast, by Application 2019 & 2032
- Table 26: United Kingdom Compensation Planning Software Industry Volume (K Unit) Forecast, by Application 2019 & 2032
- Table 27: France Compensation Planning Software Industry Revenue (Million) Forecast, by Application 2019 & 2032
- Table 28: France Compensation Planning Software Industry Volume (K Unit) Forecast, by Application 2019 & 2032
- Table 29: Spain Compensation Planning Software Industry Revenue (Million) Forecast, by Application 2019 & 2032
- Table 30: Spain Compensation Planning Software Industry Volume (K Unit) Forecast, by Application 2019 & 2032
- Table 31: Italy Compensation Planning Software Industry Revenue (Million) Forecast, by Application 2019 & 2032
- Table 32: Italy Compensation Planning Software Industry Volume (K Unit) Forecast, by Application 2019 & 2032
- Table 33: Spain Compensation Planning Software Industry Revenue (Million) Forecast, by Application 2019 & 2032
- Table 34: Spain Compensation Planning Software Industry Volume (K Unit) Forecast, by Application 2019 & 2032
- Table 35: Belgium Compensation Planning Software Industry Revenue (Million) Forecast, by Application 2019 & 2032
- Table 36: Belgium Compensation Planning Software Industry Volume (K Unit) Forecast, by Application 2019 & 2032
- Table 37: Netherland Compensation Planning Software Industry Revenue (Million) Forecast, by Application 2019 & 2032
- Table 38: Netherland Compensation Planning Software Industry Volume (K Unit) Forecast, by Application 2019 & 2032
- Table 39: Nordics Compensation Planning Software Industry Revenue (Million) Forecast, by Application 2019 & 2032
- Table 40: Nordics Compensation Planning Software Industry Volume (K Unit) Forecast, by Application 2019 & 2032
- Table 41: Rest of Europe Compensation Planning Software Industry Revenue (Million) Forecast, by Application 2019 & 2032
- Table 42: Rest of Europe Compensation Planning Software Industry Volume (K Unit) Forecast, by Application 2019 & 2032
- Table 43: Global Compensation Planning Software Industry Revenue Million Forecast, by Country 2019 & 2032
- Table 44: Global Compensation Planning Software Industry Volume K Unit Forecast, by Country 2019 & 2032
- Table 45: China Compensation Planning Software Industry Revenue (Million) Forecast, by Application 2019 & 2032
- Table 46: China Compensation Planning Software Industry Volume (K Unit) Forecast, by Application 2019 & 2032
- Table 47: Japan Compensation Planning Software Industry Revenue (Million) Forecast, by Application 2019 & 2032
- Table 48: Japan Compensation Planning Software Industry Volume (K Unit) Forecast, by Application 2019 & 2032
- Table 49: India Compensation Planning Software Industry Revenue (Million) Forecast, by Application 2019 & 2032
- Table 50: India Compensation Planning Software Industry Volume (K Unit) Forecast, by Application 2019 & 2032
- Table 51: South Korea Compensation Planning Software Industry Revenue (Million) Forecast, by Application 2019 & 2032
- Table 52: South Korea Compensation Planning Software Industry Volume (K Unit) Forecast, by Application 2019 & 2032
- Table 53: Southeast Asia Compensation Planning Software Industry Revenue (Million) Forecast, by Application 2019 & 2032
- Table 54: Southeast Asia Compensation Planning Software Industry Volume (K Unit) Forecast, by Application 2019 & 2032
- Table 55: Australia Compensation Planning Software Industry Revenue (Million) Forecast, by Application 2019 & 2032
- Table 56: Australia Compensation Planning Software Industry Volume (K Unit) Forecast, by Application 2019 & 2032
- Table 57: Indonesia Compensation Planning Software Industry Revenue (Million) Forecast, by Application 2019 & 2032
- Table 58: Indonesia Compensation Planning Software Industry Volume (K Unit) Forecast, by Application 2019 & 2032
- Table 59: Phillipes Compensation Planning Software Industry Revenue (Million) Forecast, by Application 2019 & 2032
- Table 60: Phillipes Compensation Planning Software Industry Volume (K Unit) Forecast, by Application 2019 & 2032
- Table 61: Singapore Compensation Planning Software Industry Revenue (Million) Forecast, by Application 2019 & 2032
- Table 62: Singapore Compensation Planning Software Industry Volume (K Unit) Forecast, by Application 2019 & 2032
- Table 63: Thailandc Compensation Planning Software Industry Revenue (Million) Forecast, by Application 2019 & 2032
- Table 64: Thailandc Compensation Planning Software Industry Volume (K Unit) Forecast, by Application 2019 & 2032
- Table 65: Rest of Asia Pacific Compensation Planning Software Industry Revenue (Million) Forecast, by Application 2019 & 2032
- Table 66: Rest of Asia Pacific Compensation Planning Software Industry Volume (K Unit) Forecast, by Application 2019 & 2032
- Table 67: Global Compensation Planning Software Industry Revenue Million Forecast, by Country 2019 & 2032
- Table 68: Global Compensation Planning Software Industry Volume K Unit Forecast, by Country 2019 & 2032
- Table 69: Brazil Compensation Planning Software Industry Revenue (Million) Forecast, by Application 2019 & 2032
- Table 70: Brazil Compensation Planning Software Industry Volume (K Unit) Forecast, by Application 2019 & 2032
- Table 71: Argentina Compensation Planning Software Industry Revenue (Million) Forecast, by Application 2019 & 2032
- Table 72: Argentina Compensation Planning Software Industry Volume (K Unit) Forecast, by Application 2019 & 2032
- Table 73: Peru Compensation Planning Software Industry Revenue (Million) Forecast, by Application 2019 & 2032
- Table 74: Peru Compensation Planning Software Industry Volume (K Unit) Forecast, by Application 2019 & 2032
- Table 75: Chile Compensation Planning Software Industry Revenue (Million) Forecast, by Application 2019 & 2032
- Table 76: Chile Compensation Planning Software Industry Volume (K Unit) Forecast, by Application 2019 & 2032
- Table 77: Colombia Compensation Planning Software Industry Revenue (Million) Forecast, by Application 2019 & 2032
- Table 78: Colombia Compensation Planning Software Industry Volume (K Unit) Forecast, by Application 2019 & 2032
- Table 79: Ecuador Compensation Planning Software Industry Revenue (Million) Forecast, by Application 2019 & 2032
- Table 80: Ecuador Compensation Planning Software Industry Volume (K Unit) Forecast, by Application 2019 & 2032
- Table 81: Venezuela Compensation Planning Software Industry Revenue (Million) Forecast, by Application 2019 & 2032
- Table 82: Venezuela Compensation Planning Software Industry Volume (K Unit) Forecast, by Application 2019 & 2032
- Table 83: Rest of South America Compensation Planning Software Industry Revenue (Million) Forecast, by Application 2019 & 2032
- Table 84: Rest of South America Compensation Planning Software Industry Volume (K Unit) Forecast, by Application 2019 & 2032
- Table 85: Global Compensation Planning Software Industry Revenue Million Forecast, by Country 2019 & 2032
- Table 86: Global Compensation Planning Software Industry Volume K Unit Forecast, by Country 2019 & 2032
- Table 87: United States Compensation Planning Software Industry Revenue (Million) Forecast, by Application 2019 & 2032
- Table 88: United States Compensation Planning Software Industry Volume (K Unit) Forecast, by Application 2019 & 2032
- Table 89: Canada Compensation Planning Software Industry Revenue (Million) Forecast, by Application 2019 & 2032
- Table 90: Canada Compensation Planning Software Industry Volume (K Unit) Forecast, by Application 2019 & 2032
- Table 91: Mexico Compensation Planning Software Industry Revenue (Million) Forecast, by Application 2019 & 2032
- Table 92: Mexico Compensation Planning Software Industry Volume (K Unit) Forecast, by Application 2019 & 2032
- Table 93: Global Compensation Planning Software Industry Revenue Million Forecast, by Country 2019 & 2032
- Table 94: Global Compensation Planning Software Industry Volume K Unit Forecast, by Country 2019 & 2032
- Table 95: United Arab Emirates Compensation Planning Software Industry Revenue (Million) Forecast, by Application 2019 & 2032
- Table 96: United Arab Emirates Compensation Planning Software Industry Volume (K Unit) Forecast, by Application 2019 & 2032
- Table 97: Saudi Arabia Compensation Planning Software Industry Revenue (Million) Forecast, by Application 2019 & 2032
- Table 98: Saudi Arabia Compensation Planning Software Industry Volume (K Unit) Forecast, by Application 2019 & 2032
- Table 99: South Africa Compensation Planning Software Industry Revenue (Million) Forecast, by Application 2019 & 2032
- Table 100: South Africa Compensation Planning Software Industry Volume (K Unit) Forecast, by Application 2019 & 2032
- Table 101: Rest of Middle East and Africa Compensation Planning Software Industry Revenue (Million) Forecast, by Application 2019 & 2032
- Table 102: Rest of Middle East and Africa Compensation Planning Software Industry Volume (K Unit) Forecast, by Application 2019 & 2032
- Table 103: Global Compensation Planning Software Industry Revenue Million Forecast, by Type 2019 & 2032
- Table 104: Global Compensation Planning Software Industry Volume K Unit Forecast, by Type 2019 & 2032
- Table 105: Global Compensation Planning Software Industry Revenue Million Forecast, by Application 2019 & 2032
- Table 106: Global Compensation Planning Software Industry Volume K Unit Forecast, by Application 2019 & 2032
- Table 107: Global Compensation Planning Software Industry Revenue Million Forecast, by Deployment 2019 & 2032
- Table 108: Global Compensation Planning Software Industry Volume K Unit Forecast, by Deployment 2019 & 2032
- Table 109: Global Compensation Planning Software Industry Revenue Million Forecast, by End-User Industry 2019 & 2032
- Table 110: Global Compensation Planning Software Industry Volume K Unit Forecast, by End-User Industry 2019 & 2032
- Table 111: Global Compensation Planning Software Industry Revenue Million Forecast, by Country 2019 & 2032
- Table 112: Global Compensation Planning Software Industry Volume K Unit Forecast, by Country 2019 & 2032
- Table 113: United States Compensation Planning Software Industry Revenue (Million) Forecast, by Application 2019 & 2032
- Table 114: United States Compensation Planning Software Industry Volume (K Unit) Forecast, by Application 2019 & 2032
- Table 115: Canada Compensation Planning Software Industry Revenue (Million) Forecast, by Application 2019 & 2032
- Table 116: Canada Compensation Planning Software Industry Volume (K Unit) Forecast, by Application 2019 & 2032
- Table 117: Mexico Compensation Planning Software Industry Revenue (Million) Forecast, by Application 2019 & 2032
- Table 118: Mexico Compensation Planning Software Industry Volume (K Unit) Forecast, by Application 2019 & 2032
- Table 119: Global Compensation Planning Software Industry Revenue Million Forecast, by Type 2019 & 2032
- Table 120: Global Compensation Planning Software Industry Volume K Unit Forecast, by Type 2019 & 2032
- Table 121: Global Compensation Planning Software Industry Revenue Million Forecast, by Application 2019 & 2032
- Table 122: Global Compensation Planning Software Industry Volume K Unit Forecast, by Application 2019 & 2032
- Table 123: Global Compensation Planning Software Industry Revenue Million Forecast, by Deployment 2019 & 2032
- Table 124: Global Compensation Planning Software Industry Volume K Unit Forecast, by Deployment 2019 & 2032
- Table 125: Global Compensation Planning Software Industry Revenue Million Forecast, by End-User Industry 2019 & 2032
- Table 126: Global Compensation Planning Software Industry Volume K Unit Forecast, by End-User Industry 2019 & 2032
- Table 127: Global Compensation Planning Software Industry Revenue Million Forecast, by Country 2019 & 2032
- Table 128: Global Compensation Planning Software Industry Volume K Unit Forecast, by Country 2019 & 2032
- Table 129: Brazil Compensation Planning Software Industry Revenue (Million) Forecast, by Application 2019 & 2032
- Table 130: Brazil Compensation Planning Software Industry Volume (K Unit) Forecast, by Application 2019 & 2032
- Table 131: Argentina Compensation Planning Software Industry Revenue (Million) Forecast, by Application 2019 & 2032
- Table 132: Argentina Compensation Planning Software Industry Volume (K Unit) Forecast, by Application 2019 & 2032
- Table 133: Rest of South America Compensation Planning Software Industry Revenue (Million) Forecast, by Application 2019 & 2032
- Table 134: Rest of South America Compensation Planning Software Industry Volume (K Unit) Forecast, by Application 2019 & 2032
- Table 135: Global Compensation Planning Software Industry Revenue Million Forecast, by Type 2019 & 2032
- Table 136: Global Compensation Planning Software Industry Volume K Unit Forecast, by Type 2019 & 2032
- Table 137: Global Compensation Planning Software Industry Revenue Million Forecast, by Application 2019 & 2032
- Table 138: Global Compensation Planning Software Industry Volume K Unit Forecast, by Application 2019 & 2032
- Table 139: Global Compensation Planning Software Industry Revenue Million Forecast, by Deployment 2019 & 2032
- Table 140: Global Compensation Planning Software Industry Volume K Unit Forecast, by Deployment 2019 & 2032
- Table 141: Global Compensation Planning Software Industry Revenue Million Forecast, by End-User Industry 2019 & 2032
- Table 142: Global Compensation Planning Software Industry Volume K Unit Forecast, by End-User Industry 2019 & 2032
- Table 143: Global Compensation Planning Software Industry Revenue Million Forecast, by Country 2019 & 2032
- Table 144: Global Compensation Planning Software Industry Volume K Unit Forecast, by Country 2019 & 2032
- Table 145: United Kingdom Compensation Planning Software Industry Revenue (Million) Forecast, by Application 2019 & 2032
- Table 146: United Kingdom Compensation Planning Software Industry Volume (K Unit) Forecast, by Application 2019 & 2032
- Table 147: Germany Compensation Planning Software Industry Revenue (Million) Forecast, by Application 2019 & 2032
- Table 148: Germany Compensation Planning Software Industry Volume (K Unit) Forecast, by Application 2019 & 2032
- Table 149: France Compensation Planning Software Industry Revenue (Million) Forecast, by Application 2019 & 2032
- Table 150: France Compensation Planning Software Industry Volume (K Unit) Forecast, by Application 2019 & 2032
- Table 151: Italy Compensation Planning Software Industry Revenue (Million) Forecast, by Application 2019 & 2032
- Table 152: Italy Compensation Planning Software Industry Volume (K Unit) Forecast, by Application 2019 & 2032
- Table 153: Spain Compensation Planning Software Industry Revenue (Million) Forecast, by Application 2019 & 2032
- Table 154: Spain Compensation Planning Software Industry Volume (K Unit) Forecast, by Application 2019 & 2032
- Table 155: Russia Compensation Planning Software Industry Revenue (Million) Forecast, by Application 2019 & 2032
- Table 156: Russia Compensation Planning Software Industry Volume (K Unit) Forecast, by Application 2019 & 2032
- Table 157: Benelux Compensation Planning Software Industry Revenue (Million) Forecast, by Application 2019 & 2032
- Table 158: Benelux Compensation Planning Software Industry Volume (K Unit) Forecast, by Application 2019 & 2032
- Table 159: Nordics Compensation Planning Software Industry Revenue (Million) Forecast, by Application 2019 & 2032
- Table 160: Nordics Compensation Planning Software Industry Volume (K Unit) Forecast, by Application 2019 & 2032
- Table 161: Rest of Europe Compensation Planning Software Industry Revenue (Million) Forecast, by Application 2019 & 2032
- Table 162: Rest of Europe Compensation Planning Software Industry Volume (K Unit) Forecast, by Application 2019 & 2032
- Table 163: Global Compensation Planning Software Industry Revenue Million Forecast, by Type 2019 & 2032
- Table 164: Global Compensation Planning Software Industry Volume K Unit Forecast, by Type 2019 & 2032
- Table 165: Global Compensation Planning Software Industry Revenue Million Forecast, by Application 2019 & 2032
- Table 166: Global Compensation Planning Software Industry Volume K Unit Forecast, by Application 2019 & 2032
- Table 167: Global Compensation Planning Software Industry Revenue Million Forecast, by Deployment 2019 & 2032
- Table 168: Global Compensation Planning Software Industry Volume K Unit Forecast, by Deployment 2019 & 2032
- Table 169: Global Compensation Planning Software Industry Revenue Million Forecast, by End-User Industry 2019 & 2032
- Table 170: Global Compensation Planning Software Industry Volume K Unit Forecast, by End-User Industry 2019 & 2032
- Table 171: Global Compensation Planning Software Industry Revenue Million Forecast, by Country 2019 & 2032
- Table 172: Global Compensation Planning Software Industry Volume K Unit Forecast, by Country 2019 & 2032
- Table 173: Turkey Compensation Planning Software Industry Revenue (Million) Forecast, by Application 2019 & 2032
- Table 174: Turkey Compensation Planning Software Industry Volume (K Unit) Forecast, by Application 2019 & 2032
- Table 175: Israel Compensation Planning Software Industry Revenue (Million) Forecast, by Application 2019 & 2032
- Table 176: Israel Compensation Planning Software Industry Volume (K Unit) Forecast, by Application 2019 & 2032
- Table 177: GCC Compensation Planning Software Industry Revenue (Million) Forecast, by Application 2019 & 2032
- Table 178: GCC Compensation Planning Software Industry Volume (K Unit) Forecast, by Application 2019 & 2032
- Table 179: North Africa Compensation Planning Software Industry Revenue (Million) Forecast, by Application 2019 & 2032
- Table 180: North Africa Compensation Planning Software Industry Volume (K Unit) Forecast, by Application 2019 & 2032
- Table 181: South Africa Compensation Planning Software Industry Revenue (Million) Forecast, by Application 2019 & 2032
- Table 182: South Africa Compensation Planning Software Industry Volume (K Unit) Forecast, by Application 2019 & 2032
- Table 183: Rest of Middle East & Africa Compensation Planning Software Industry Revenue (Million) Forecast, by Application 2019 & 2032
- Table 184: Rest of Middle East & Africa Compensation Planning Software Industry Volume (K Unit) Forecast, by Application 2019 & 2032
- Table 185: Global Compensation Planning Software Industry Revenue Million Forecast, by Type 2019 & 2032
- Table 186: Global Compensation Planning Software Industry Volume K Unit Forecast, by Type 2019 & 2032
- Table 187: Global Compensation Planning Software Industry Revenue Million Forecast, by Application 2019 & 2032
- Table 188: Global Compensation Planning Software Industry Volume K Unit Forecast, by Application 2019 & 2032
- Table 189: Global Compensation Planning Software Industry Revenue Million Forecast, by Deployment 2019 & 2032
- Table 190: Global Compensation Planning Software Industry Volume K Unit Forecast, by Deployment 2019 & 2032
- Table 191: Global Compensation Planning Software Industry Revenue Million Forecast, by End-User Industry 2019 & 2032
- Table 192: Global Compensation Planning Software Industry Volume K Unit Forecast, by End-User Industry 2019 & 2032
- Table 193: Global Compensation Planning Software Industry Revenue Million Forecast, by Country 2019 & 2032
- Table 194: Global Compensation Planning Software Industry Volume K Unit Forecast, by Country 2019 & 2032
- Table 195: China Compensation Planning Software Industry Revenue (Million) Forecast, by Application 2019 & 2032
- Table 196: China Compensation Planning Software Industry Volume (K Unit) Forecast, by Application 2019 & 2032
- Table 197: India Compensation Planning Software Industry Revenue (Million) Forecast, by Application 2019 & 2032
- Table 198: India Compensation Planning Software Industry Volume (K Unit) Forecast, by Application 2019 & 2032
- Table 199: Japan Compensation Planning Software Industry Revenue (Million) Forecast, by Application 2019 & 2032
- Table 200: Japan Compensation Planning Software Industry Volume (K Unit) Forecast, by Application 2019 & 2032
- Table 201: South Korea Compensation Planning Software Industry Revenue (Million) Forecast, by Application 2019 & 2032
- Table 202: South Korea Compensation Planning Software Industry Volume (K Unit) Forecast, by Application 2019 & 2032
- Table 203: ASEAN Compensation Planning Software Industry Revenue (Million) Forecast, by Application 2019 & 2032
- Table 204: ASEAN Compensation Planning Software Industry Volume (K Unit) Forecast, by Application 2019 & 2032
- Table 205: Oceania Compensation Planning Software Industry Revenue (Million) Forecast, by Application 2019 & 2032
- Table 206: Oceania Compensation Planning Software Industry Volume (K Unit) Forecast, by Application 2019 & 2032
- Table 207: Rest of Asia Pacific Compensation Planning Software Industry Revenue (Million) Forecast, by Application 2019 & 2032
- Table 208: Rest of Asia Pacific Compensation Planning Software Industry Volume (K Unit) Forecast, by Application 2019 & 2032
Frequently Asked Questions
1. What is the projected Compound Annual Growth Rate (CAGR) of the Compensation Planning Software Industry?
The projected CAGR is approximately 8.80%.
2. Which companies are prominent players in the Compensation Planning Software Industry?
Key companies in the market include TMF Group Holding B V, Ultimate Software Group, Jobvite Inc, Intuit Inc, Paychex Inc, Paycom Software Inc, Kronos Incorporated, Paylocity Corporation, Automatic Data Processing Inc (ADP), Ramco Systems Limited, Oracle Corporation, Paycor Inc, TriNet Group Inc, Sage Group plc, SAP SE.
3. What are the main segments of the Compensation Planning Software Industry?
The market segments include Type, Application, Deployment, End-User Industry.
4. Can you provide details about the market size?
The market size is estimated to be USD XX Million as of 2022.
5. What are some drivers contributing to market growth?
Growing needs for Payroll Cost Visibility.
6. What are the notable trends driving market growth?
Cloud based systems to drive the Market.
7. Are there any restraints impacting market growth?
Lack of Awareness About Workforce Analytics.
8. Can you provide examples of recent developments in the market?
In January 2022 - Cloudsnap Inc., a versatile, low-code solution for integrating various corporate applications, was acquired by Paylocity, a major provider of cloud-based HR and payroll software solutions. With the help of Cloudsnap's technology, manual data exchange procedures may be automated while providing users with a cutting-edge user experience. Clients may automate data flow between systems, such as financial and HR applications, thanks to the company's integration automation platform, which makes it easier to create and execute API interfaces.
9. What pricing options are available for accessing the report?
Pricing options include single-user, multi-user, and enterprise licenses priced at USD 4750, USD 5250, and USD 8750 respectively.
10. Is the market size provided in terms of value or volume?
The market size is provided in terms of value, measured in Million and volume, measured in K Unit.
11. Are there any specific market keywords associated with the report?
Yes, the market keyword associated with the report is "Compensation Planning Software Industry," which aids in identifying and referencing the specific market segment covered.
12. How do I determine which pricing option suits my needs best?
The pricing options vary based on user requirements and access needs. Individual users may opt for single-user licenses, while businesses requiring broader access may choose multi-user or enterprise licenses for cost-effective access to the report.
13. Are there any additional resources or data provided in the Compensation Planning Software Industry report?
While the report offers comprehensive insights, it's advisable to review the specific contents or supplementary materials provided to ascertain if additional resources or data are available.
14. How can I stay updated on further developments or reports in the Compensation Planning Software Industry?
To stay informed about further developments, trends, and reports in the Compensation Planning Software Industry, consider subscribing to industry newsletters, following relevant companies and organizations, or regularly checking reputable industry news sources and publications.
Methodology
Step 1 - Identification of Relevant Samples Size from Population Database


Step 2 - Approaches for Defining Global Market Size (Value, Volume* & Price*)

Note*: In applicable scenarios
Step 3 - Data Sources
Primary Research
- Web Analytics
- Survey Reports
- Research Institute
- Latest Research Reports
- Opinion Leaders
Secondary Research
- Annual Reports
- White Paper
- Latest Press Release
- Industry Association
- Paid Database
- Investor Presentations

Step 4 - Data Triangulation
Involves using different sources of information in order to increase the validity of a study
These sources are likely to be stakeholders in a program - participants, other researchers, program staff, other community members, and so on.
Then we put all data in single framework & apply various statistical tools to find out the dynamic on the market.
During the analysis stage, feedback from the stakeholder groups would be compared to determine areas of agreement as well as areas of divergence
