

Key Insights
The global Compound Management market is projected for substantial expansion, estimated to reach $9.94 billion by 2025, exhibiting a robust Compound Annual Growth Rate (CAGR) of 7.08%. This growth is driven by increasing demand for precision in drug discovery and development, the growing complexity of biological research, and the critical need for efficient biobanking solutions. Advancements in automation for compound storage and liquid handling systems are key enablers of this market's evolution.
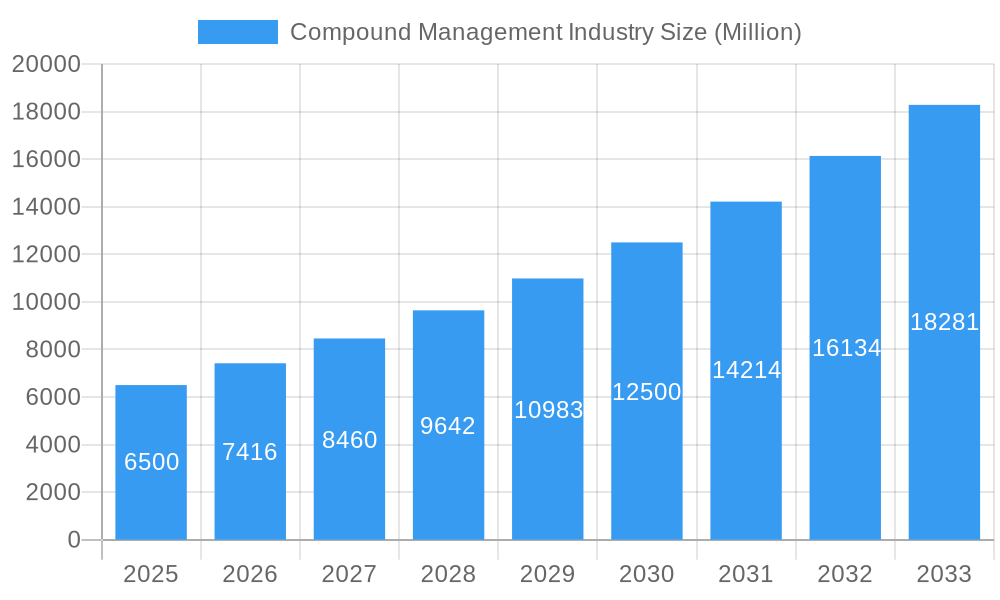
Compound Management Industry Market Size (In Billion)
The market is segmented by product type, including Automated Compound/Sample Storage Systems, Automated Liquid Handling Systems, and Other Storage Systems, all experiencing significant adoption for enhanced efficiency and sample integrity. The Services segment is also expanding due to outsourcing trends. Key sample types managed include Chemical Compounds and Bio Samples, with applications spanning Drug Discovery, Gene Synthesis, and Biobanking. Geographically, North America is expected to lead market growth, followed by Europe and the Asia Pacific region, reflecting concentrated research activities and investment in life sciences.
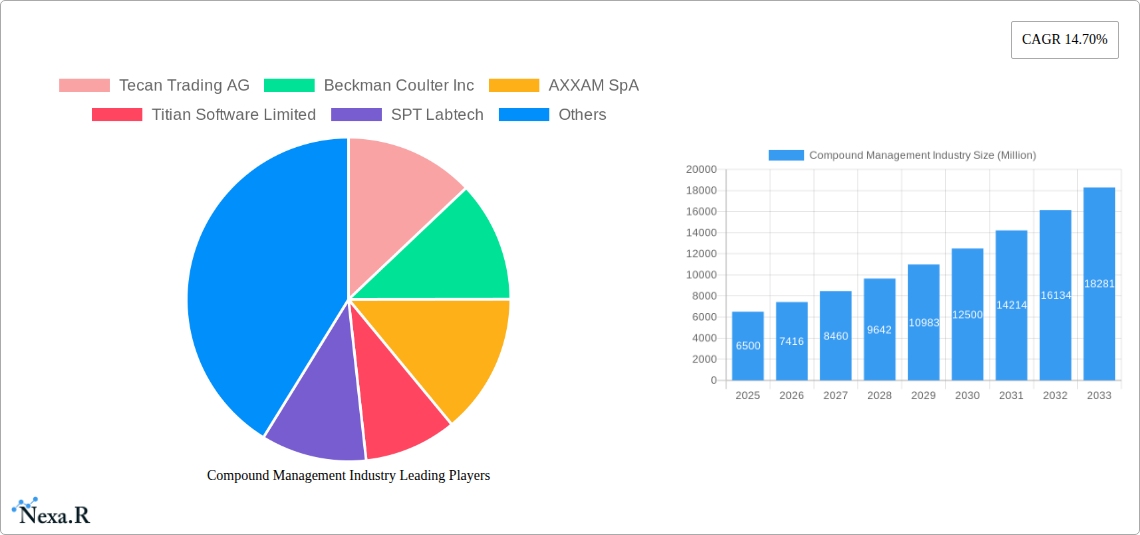
Compound Management Industry Company Market Share
This comprehensive report offers a detailed analysis of the global Compound Management market, covering the period from 2019-2024, with a base year of 2025 and a forecast period extending to 2033. It provides critical insights for stakeholders in this dynamic sector.
We analyze the broader Life Science Research Tools and Services market and its sub-segment, Automated Sample Management, to provide a granular understanding of market dynamics, competitive landscapes, and innovation drivers. This report is an essential resource for pharmaceutical companies, biotechnology firms, academic institutions, contract research organizations (CROs), and technology providers involved in drug discovery, biobanking, and gene synthesis.
Compound Management Industry Market Dynamics & Structure
The Compound Management Industry is characterized by a moderate market concentration, with a few dominant players influencing technological advancements and market direction. Key drivers of innovation stem from the incessant demand for higher throughput, increased accuracy, and miniaturization in research and development processes. The regulatory landscape, particularly within pharmaceutical and biotechnology sectors, plays a crucial role in shaping industry standards for sample integrity, traceability, and security. Competitive product substitutes, while present in rudimentary forms, are rapidly being outpaced by integrated, automated solutions. End-user demographics are shifting towards a greater reliance on outsourced compound management services and sophisticated automated systems, driven by the need for specialized expertise and cost-efficiency. Mergers and Acquisitions (M&A) trends are robust, as larger entities seek to acquire innovative technologies and expand their service portfolios. For instance, the acquisition of BioMicroLab by SPT Labtech in February 2021 exemplifies this trend, aiming to bolster capabilities in automatic sample management.
- Market Concentration: Moderate, with key players dominating specific niches.
- Technological Innovation Drivers: High-throughput screening needs, automation advancements, AI integration in sample tracking, and miniaturization.
- Regulatory Frameworks: Stringent GMP/GLP compliance, data integrity requirements, and evolving biobanking regulations.
- Competitive Product Substitutes: Manual processes, less sophisticated storage solutions, and point solutions that lack integrated workflow capabilities.
- End-User Demographics: Increasing reliance on outsourced services, demand for cloud-based solutions, and growth in academic and smaller biotech research initiatives.
- M&A Trends: Strategic acquisitions to enhance product portfolios, expand geographical reach, and integrate complementary technologies.
Compound Management Industry Growth Trends & Insights
The global Compound Management Industry is poised for significant expansion, driven by an escalating need for efficient and secure management of vast chemical and biological sample libraries. The market size evolution is projected to witness a consistent upward trajectory, fueled by increasing investments in drug discovery and development, particularly in oncology and rare diseases. Adoption rates for automated compound storage and retrieval systems are accelerating as research institutions and pharmaceutical giants recognize their ability to reduce human error, enhance sample integrity, and optimize laboratory workflows. Technological disruptions are continuously emerging, with advancements in artificial intelligence (AI) for predictive sample utilization, robotics for automated liquid handling, and integrated software platforms for seamless data management playing pivotal roles. Consumer behavior shifts are evident, with a growing preference for integrated solutions that offer end-to-end sample lifecycle management, from acquisition and storage to retrieval and assay utilization.
The Compound Management Industry is expected to experience a Compound Annual Growth Rate (CAGR) of approximately XX% during the forecast period of 2025–2033. This growth is underpinned by the increasing complexity of drug discovery pipelines and the expanding volume of biological samples generated by genomics, proteomics, and metabolomics research. Market penetration of automated systems is forecast to rise from XX% in the base year 2025 to an estimated XX% by 2033, indicating a significant shift from manual processes. The demand for specialized compound libraries, curated for specific therapeutic areas, is also a key growth driver. Furthermore, the expanding field of personalized medicine necessitates sophisticated sample management solutions to handle patient-derived biospecimens. The increasing outsourcing of compound management by smaller biotech firms and academic institutions to specialized CROs further contributes to the market’s robust growth.
Dominant Regions, Countries, or Segments in Compound Management Industry
The North America region is currently dominating the Compound Management Industry, largely driven by its robust pharmaceutical and biotechnology sectors, significant R&D investments, and a strong presence of leading research institutions and contract research organizations. The United States, in particular, accounts for a substantial market share due to its advanced healthcare infrastructure, favorable regulatory environment for drug development, and early adoption of cutting-edge technologies. The dominance of North America is further bolstered by government initiatives supporting life sciences research and innovation.
Within the Type segment, Automated Compounds/Sample Storage Systems are emerging as a highly influential category, projecting substantial market growth. This is attributed to their ability to ensure optimal storage conditions, prevent sample degradation, and facilitate rapid, error-free retrieval, which are critical for high-throughput drug discovery and biobanking operations. The increasing complexity and volume of sample libraries necessitate these advanced automated solutions.
In terms of Sample Type, Chemical Compounds represent a significant segment, primarily due to their central role in small molecule drug discovery. However, Bio Samples are exhibiting remarkable growth, fueled by advancements in genomics, proteomics, and the expanding field of personalized medicine, leading to an increased need for efficient management of diverse biological specimens.
The Application segment of Drug Discovery is the largest contributor to the Compound Management Industry's revenue. This is a direct consequence of the substantial global investment in identifying and developing new therapeutic agents. Bio Banking is also a critical and growing application, driven by the increasing establishment of large-scale biobanks for research purposes and disease management.
Leading Region: North America (USA, Canada)
- Key Drivers: High R&D expenditure, presence of major pharmaceutical and biotech companies, robust academic research ecosystem, government funding for life sciences.
- Market Share: Estimated XX% of the global market in 2025.
- Growth Potential: Continued innovation in drug discovery and personalized medicine will sustain strong growth.
Dominant Type Segment: Automated Compounds/Sample Storage Systems
- Key Drivers: Need for high-density storage, sample integrity assurance, automation of retrieval processes, reduction of manual errors.
- Market Share: Estimated XX% of the product segment in 2025.
- Growth Potential: Driven by the increasing volume and complexity of compound libraries and biological samples.
Key Sample Type Segment: Chemical Compounds (leading) and Bio Samples (fastest growing)
- Chemical Compounds Drivers: Foundation of small molecule drug discovery, large existing libraries.
- Bio Samples Drivers: Advancements in omics technologies, personalized medicine, clinical trial sample management.
Dominant Application Segment: Drug Discovery
- Key Drivers: Extensive investment in new drug development, need for efficient screening and lead optimization.
- Market Share: Estimated XX% of the application segment in 2025.
- Growth Potential: Continuous pipeline of new drug candidates and evolving therapeutic targets.
Compound Management Industry Product Landscape
The Compound Management Industry's product landscape is defined by sophisticated advancements in automated storage and retrieval systems, high-precision liquid handling platforms, and integrated inventory management software. Innovations focus on enhancing sample traceability, ensuring optimal storage conditions (temperature, humidity), and enabling rapid, accurate access for research activities. Key product developments include ultra-low temperature storage units for biological samples, modular automated storage systems adaptable to various laboratory footprints, and intelligent software solutions that offer real-time inventory tracking and predictive maintenance. The performance metrics of these products are measured by throughput, accuracy, reliability, and the ability to handle diverse sample formats. Unique selling propositions often lie in the seamless integration of hardware and software, providing a comprehensive workflow solution.
Key Drivers, Barriers & Challenges in Compound Management Industry
The Compound Management Industry is propelled by several key drivers. The escalating global investment in pharmaceutical R&D, particularly in novel therapeutics and personalized medicine, is a primary catalyst. Technological advancements in automation and robotics are enabling higher efficiency and reduced operational costs. Furthermore, the growing demand for high-throughput screening and the increasing complexity of research data necessitate robust sample management solutions.
However, significant barriers and challenges exist. The substantial initial capital investment required for advanced automated systems can be a deterrent for smaller research entities. Stringent regulatory compliance and the need for validated systems add complexity and cost. Supply chain disruptions for critical components and the need for specialized technical expertise for maintenance and operation also pose challenges. Competitive pressures from established players and emerging technologies require continuous innovation and adaptation.
Emerging Opportunities in Compound Management Industry
Emerging opportunities within the Compound Management Industry are abundant and diverse. The rapid growth of the cell and gene therapy sector presents a significant avenue, requiring specialized cold-chain management and ultra-low temperature storage solutions for patient-derived samples and therapeutic agents. The expansion of biobanking initiatives globally, driven by advancements in precision medicine and population health studies, offers substantial potential for sample storage and management services. Furthermore, the increasing adoption of cloud-based inventory management software and AI-driven predictive analytics for sample utilization patterns represents a significant technological frontier, enhancing efficiency and reducing waste. The untapped markets in emerging economies, with growing R&D investments, also offer considerable growth prospects.
Growth Accelerators in the Compound Management Industry Industry
Several factors are acting as significant growth accelerators for the Compound Management Industry. Technological breakthroughs in robotics and automation are continuously improving the speed, accuracy, and reliability of compound handling and storage processes. Strategic partnerships between equipment manufacturers, software providers, and CROs are fostering integrated solutions that address the end-to-end needs of researchers. Market expansion strategies, including the development of localized service centers and partnerships with regional research hubs, are opening up new geographical markets. The increasing trend of outsourcing compound management by pharmaceutical and biotech companies, driven by the need for specialized expertise and cost optimization, is also a major accelerator.
Key Players Shaping the Compound Management Industry Market
- Tecan Trading AG
- Beckman Coulter Inc
- AXXAM SpA
- Titian Software Limited
- SPT Labtech
- Evotec
- LiCONiC AG
- Brooks Life Sciences
- Hamilton Company
- BioAscent
Notable Milestones in Compound Management Industry Sector
- February 2021: SPT Labtech announced the acquisition of BioMicroLab, a robotics automation provider, to strengthen its capabilities in automatic sample management.
- December 2020: Ziath, a leading sample/compound management solutions provider, introduced a new software called Datapaq 3.18 that runs the Acoustix module on a Cube, Mirage, or Express tube, reader. The product is compatible with Labcyte Echo, the latest generation of acoustic dispensers. It offers higher speed and efficiency than many other tube readers available.
In-Depth Compound Management Industry Market Outlook
The future outlook for the Compound Management Industry is exceptionally promising, characterized by sustained growth driven by innovation and expanding application areas. The increasing demand for efficient management of vast and complex sample libraries in drug discovery, biobanking, and personalized medicine will continue to fuel market expansion. Growth accelerators such as advanced automation, AI-driven insights, and strategic collaborations will shape the market landscape. Emerging opportunities in cell and gene therapy, alongside the expansion of biobanking initiatives, will present significant avenues for market penetration. Stakeholders can anticipate a dynamic market characterized by continuous technological advancements and evolving customer needs, offering substantial strategic opportunities for those who can adapt and innovate.
Compound Management Industry Segmentation
-
1. Type
-
1.1. Product
- 1.1.1. Automated Compounds/Sample Storage Systems
- 1.1.2. Automated Liquid Handling Systems
- 1.1.3. Other Compounds/Sample Storage Systems
- 1.2. Service
-
1.1. Product
-
2. Sample Type
- 2.1. Chemical Compounds
- 2.2. Bio Samples
-
3. Application
- 3.1. Drug Discovery
- 3.2. Gene Synthesis
- 3.3. Bio Banking
- 3.4. Other Applications
Compound Management Industry Segmentation By Geography
-
1. North America
- 1.1. United States
- 1.2. Canada
- 1.3. Mexico
-
2. Europe
- 2.1. Germany
- 2.2. United Kingdom
- 2.3. France
- 2.4. Italy
- 2.5. Spain
- 2.6. Rest of Europe
-
3. Asia Pacific
- 3.1. China
- 3.2. Japan
- 3.3. India
- 3.4. Australia
- 3.5. South Korea
- 3.6. Rest of Asia Pacific
-
4. Middle East and Africa
- 4.1. GCC
- 4.2. South Africa
- 4.3. Rest of Middle East and Africa
-
5. South America
- 5.1. Brazil
- 5.2. Argentina
- 5.3. Rest of South America
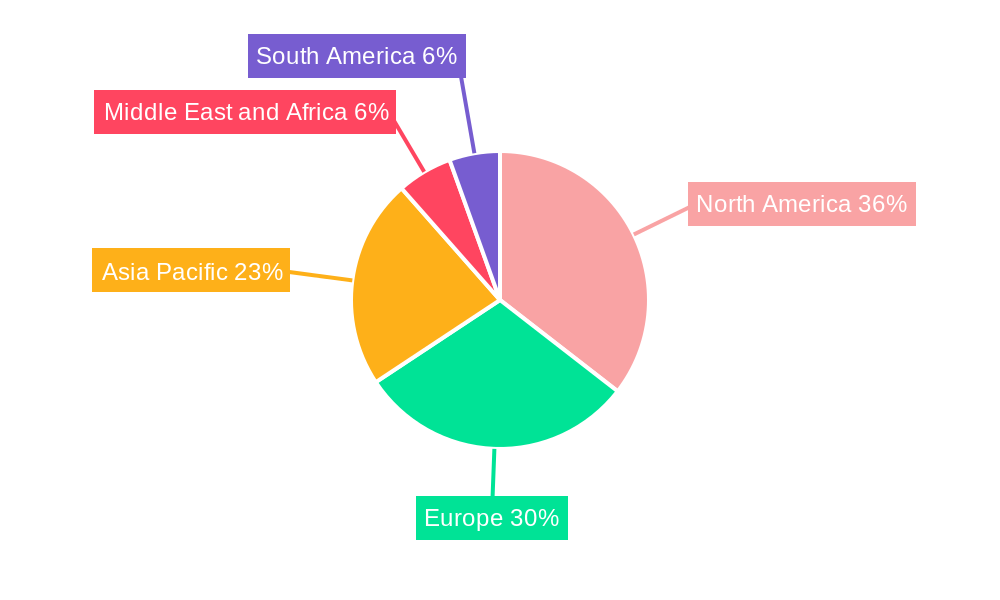
Compound Management Industry Regional Market Share
Geographic Coverage of Compound Management Industry
Compound Management Industry REPORT HIGHLIGHTS
| Aspects | Details |
|---|---|
| Study Period | 2020-2034 |
| Base Year | 2025 |
| Estimated Year | 2026 |
| Forecast Period | 2026-2034 |
| Historical Period | 2020-2025 |
| Growth Rate | CAGR of 7.08% from 2020-2034 |
| Segmentation |
|
Table of Contents
- 1. Introduction
- 1.1. Research Scope
- 1.2. Market Segmentation
- 1.3. Research Objective
- 1.4. Definitions and Assumptions
- 2. Executive Summary
- 2.1. Market Snapshot
- 3. Market Dynamics
- 3.1. Market Drivers
- 3.2. Market Restrains
- 3.3. Market Trends
- 3.4. Market Opportunities
- 4. Market Factor Analysis
- 4.1. Porters Five Forces
- 4.1.1. Bargaining Power of Suppliers
- 4.1.2. Bargaining Power of Buyers
- 4.1.3. Threat of New Entrants
- 4.1.4. Threat of Substitutes
- 4.1.5. Competitive Rivalry
- 4.2. PESTEL analysis
- 4.3. BCG Analysis
- 4.3.1. Stars (High Growth, High Market Share)
- 4.3.2. Cash Cows (Low Growth, High Market Share)
- 4.3.3. Question Mark (High Growth, Low Market Share)
- 4.3.4. Dogs (Low Growth, Low Market Share)
- 4.4. Ansoff Matrix Analysis
- 4.5. Supply Chain Analysis
- 4.6. Regulatory Landscape
- 4.7. Current Market Potential and Opportunity Assessment (TAM–SAM–SOM Framework)
- 4.8. NRP Analyst Note
- 4.1. Porters Five Forces
- 5. Market Analysis, Insights and Forecast 2021-2033
- 5.1. Market Analysis, Insights and Forecast - by Type
- 5.1.1. Product
- 5.1.1.1. Automated Compounds/Sample Storage Systems
- 5.1.1.2. Automated Liquid Handling Systems
- 5.1.1.3. Other Compounds/Sample Storage Systems
- 5.1.2. Service
- 5.1.1. Product
- 5.2. Market Analysis, Insights and Forecast - by Sample Type
- 5.2.1. Chemical Compounds
- 5.2.2. Bio Samples
- 5.3. Market Analysis, Insights and Forecast - by Application
- 5.3.1. Drug Discovery
- 5.3.2. Gene Synthesis
- 5.3.3. Bio Banking
- 5.3.4. Other Applications
- 5.4. Market Analysis, Insights and Forecast - by Region
- 5.4.1. North America
- 5.4.2. Europe
- 5.4.3. Asia Pacific
- 5.4.4. Middle East and Africa
- 5.4.5. South America
- 5.1. Market Analysis, Insights and Forecast - by Type
- 6. Global Compound Management Industry Analysis, Insights and Forecast, 2021-2033
- 6.1. Market Analysis, Insights and Forecast - by Type
- 6.1.1. Product
- 6.1.1.1. Automated Compounds/Sample Storage Systems
- 6.1.1.2. Automated Liquid Handling Systems
- 6.1.1.3. Other Compounds/Sample Storage Systems
- 6.1.2. Service
- 6.1.1. Product
- 6.2. Market Analysis, Insights and Forecast - by Sample Type
- 6.2.1. Chemical Compounds
- 6.2.2. Bio Samples
- 6.3. Market Analysis, Insights and Forecast - by Application
- 6.3.1. Drug Discovery
- 6.3.2. Gene Synthesis
- 6.3.3. Bio Banking
- 6.3.4. Other Applications
- 6.1. Market Analysis, Insights and Forecast - by Type
- 7. North America Compound Management Industry Analysis, Insights and Forecast, 2020-2032
- 7.1. Market Analysis, Insights and Forecast - by Type
- 7.1.1. Product
- 7.1.1.1. Automated Compounds/Sample Storage Systems
- 7.1.1.2. Automated Liquid Handling Systems
- 7.1.1.3. Other Compounds/Sample Storage Systems
- 7.1.2. Service
- 7.1.1. Product
- 7.2. Market Analysis, Insights and Forecast - by Sample Type
- 7.2.1. Chemical Compounds
- 7.2.2. Bio Samples
- 7.3. Market Analysis, Insights and Forecast - by Application
- 7.3.1. Drug Discovery
- 7.3.2. Gene Synthesis
- 7.3.3. Bio Banking
- 7.3.4. Other Applications
- 7.1. Market Analysis, Insights and Forecast - by Type
- 8. Europe Compound Management Industry Analysis, Insights and Forecast, 2020-2032
- 8.1. Market Analysis, Insights and Forecast - by Type
- 8.1.1. Product
- 8.1.1.1. Automated Compounds/Sample Storage Systems
- 8.1.1.2. Automated Liquid Handling Systems
- 8.1.1.3. Other Compounds/Sample Storage Systems
- 8.1.2. Service
- 8.1.1. Product
- 8.2. Market Analysis, Insights and Forecast - by Sample Type
- 8.2.1. Chemical Compounds
- 8.2.2. Bio Samples
- 8.3. Market Analysis, Insights and Forecast - by Application
- 8.3.1. Drug Discovery
- 8.3.2. Gene Synthesis
- 8.3.3. Bio Banking
- 8.3.4. Other Applications
- 8.1. Market Analysis, Insights and Forecast - by Type
- 9. Asia Pacific Compound Management Industry Analysis, Insights and Forecast, 2020-2032
- 9.1. Market Analysis, Insights and Forecast - by Type
- 9.1.1. Product
- 9.1.1.1. Automated Compounds/Sample Storage Systems
- 9.1.1.2. Automated Liquid Handling Systems
- 9.1.1.3. Other Compounds/Sample Storage Systems
- 9.1.2. Service
- 9.1.1. Product
- 9.2. Market Analysis, Insights and Forecast - by Sample Type
- 9.2.1. Chemical Compounds
- 9.2.2. Bio Samples
- 9.3. Market Analysis, Insights and Forecast - by Application
- 9.3.1. Drug Discovery
- 9.3.2. Gene Synthesis
- 9.3.3. Bio Banking
- 9.3.4. Other Applications
- 9.1. Market Analysis, Insights and Forecast - by Type
- 10. Middle East and Africa Compound Management Industry Analysis, Insights and Forecast, 2020-2032
- 10.1. Market Analysis, Insights and Forecast - by Type
- 10.1.1. Product
- 10.1.1.1. Automated Compounds/Sample Storage Systems
- 10.1.1.2. Automated Liquid Handling Systems
- 10.1.1.3. Other Compounds/Sample Storage Systems
- 10.1.2. Service
- 10.1.1. Product
- 10.2. Market Analysis, Insights and Forecast - by Sample Type
- 10.2.1. Chemical Compounds
- 10.2.2. Bio Samples
- 10.3. Market Analysis, Insights and Forecast - by Application
- 10.3.1. Drug Discovery
- 10.3.2. Gene Synthesis
- 10.3.3. Bio Banking
- 10.3.4. Other Applications
- 10.1. Market Analysis, Insights and Forecast - by Type
- 11. South America Compound Management Industry Analysis, Insights and Forecast, 2020-2032
- 11.1. Market Analysis, Insights and Forecast - by Type
- 11.1.1. Product
- 11.1.1.1. Automated Compounds/Sample Storage Systems
- 11.1.1.2. Automated Liquid Handling Systems
- 11.1.1.3. Other Compounds/Sample Storage Systems
- 11.1.2. Service
- 11.1.1. Product
- 11.2. Market Analysis, Insights and Forecast - by Sample Type
- 11.2.1. Chemical Compounds
- 11.2.2. Bio Samples
- 11.3. Market Analysis, Insights and Forecast - by Application
- 11.3.1. Drug Discovery
- 11.3.2. Gene Synthesis
- 11.3.3. Bio Banking
- 11.3.4. Other Applications
- 11.1. Market Analysis, Insights and Forecast - by Type
- 12. Competitive Analysis
- 12.1. Company Profiles
- 12.1.1 Tecan Trading AG
- 12.1.1.1. Company Overview
- 12.1.1.2. Products
- 12.1.1.3. Company Financials
- 12.1.1.4. SWOT Analysis
- 12.1.2 Beckman Coulter Inc
- 12.1.2.1. Company Overview
- 12.1.2.2. Products
- 12.1.2.3. Company Financials
- 12.1.2.4. SWOT Analysis
- 12.1.3 AXXAM SpA
- 12.1.3.1. Company Overview
- 12.1.3.2. Products
- 12.1.3.3. Company Financials
- 12.1.3.4. SWOT Analysis
- 12.1.4 Titian Software Limited
- 12.1.4.1. Company Overview
- 12.1.4.2. Products
- 12.1.4.3. Company Financials
- 12.1.4.4. SWOT Analysis
- 12.1.5 SPT Labtech
- 12.1.5.1. Company Overview
- 12.1.5.2. Products
- 12.1.5.3. Company Financials
- 12.1.5.4. SWOT Analysis
- 12.1.6 Evotec
- 12.1.6.1. Company Overview
- 12.1.6.2. Products
- 12.1.6.3. Company Financials
- 12.1.6.4. SWOT Analysis
- 12.1.7 LiCONiC AG
- 12.1.7.1. Company Overview
- 12.1.7.2. Products
- 12.1.7.3. Company Financials
- 12.1.7.4. SWOT Analysis
- 12.1.8 Brooks Life Sciences
- 12.1.8.1. Company Overview
- 12.1.8.2. Products
- 12.1.8.3. Company Financials
- 12.1.8.4. SWOT Analysis
- 12.1.9 Hamilton Company
- 12.1.9.1. Company Overview
- 12.1.9.2. Products
- 12.1.9.3. Company Financials
- 12.1.9.4. SWOT Analysis
- 12.1.10 BioAscent
- 12.1.10.1. Company Overview
- 12.1.10.2. Products
- 12.1.10.3. Company Financials
- 12.1.10.4. SWOT Analysis
- 12.1.1 Tecan Trading AG
- 12.2. Market Entropy
- 12.2.1 Company's Key Areas Served
- 12.2.2 Recent Developments
- 12.3. Company Market Share Analysis 2025
- 12.3.1 Top 5 Companies Market Share Analysis
- 12.3.2 Top 3 Companies Market Share Analysis
- 12.4. List of Potential Customers
- 13. Research Methodology
List of Figures
- Figure 1: Global Compound Management Industry Revenue Breakdown (billion, %) by Region 2025 & 2033
- Figure 2: Global Compound Management Industry Volume Breakdown (K unit, %) by Region 2025 & 2033
- Figure 3: North America Compound Management Industry Revenue (billion), by Type 2025 & 2033
- Figure 4: North America Compound Management Industry Volume (K unit), by Type 2025 & 2033
- Figure 5: North America Compound Management Industry Revenue Share (%), by Type 2025 & 2033
- Figure 6: North America Compound Management Industry Volume Share (%), by Type 2025 & 2033
- Figure 7: North America Compound Management Industry Revenue (billion), by Sample Type 2025 & 2033
- Figure 8: North America Compound Management Industry Volume (K unit), by Sample Type 2025 & 2033
- Figure 9: North America Compound Management Industry Revenue Share (%), by Sample Type 2025 & 2033
- Figure 10: North America Compound Management Industry Volume Share (%), by Sample Type 2025 & 2033
- Figure 11: North America Compound Management Industry Revenue (billion), by Application 2025 & 2033
- Figure 12: North America Compound Management Industry Volume (K unit), by Application 2025 & 2033
- Figure 13: North America Compound Management Industry Revenue Share (%), by Application 2025 & 2033
- Figure 14: North America Compound Management Industry Volume Share (%), by Application 2025 & 2033
- Figure 15: North America Compound Management Industry Revenue (billion), by Country 2025 & 2033
- Figure 16: North America Compound Management Industry Volume (K unit), by Country 2025 & 2033
- Figure 17: North America Compound Management Industry Revenue Share (%), by Country 2025 & 2033
- Figure 18: North America Compound Management Industry Volume Share (%), by Country 2025 & 2033
- Figure 19: Europe Compound Management Industry Revenue (billion), by Type 2025 & 2033
- Figure 20: Europe Compound Management Industry Volume (K unit), by Type 2025 & 2033
- Figure 21: Europe Compound Management Industry Revenue Share (%), by Type 2025 & 2033
- Figure 22: Europe Compound Management Industry Volume Share (%), by Type 2025 & 2033
- Figure 23: Europe Compound Management Industry Revenue (billion), by Sample Type 2025 & 2033
- Figure 24: Europe Compound Management Industry Volume (K unit), by Sample Type 2025 & 2033
- Figure 25: Europe Compound Management Industry Revenue Share (%), by Sample Type 2025 & 2033
- Figure 26: Europe Compound Management Industry Volume Share (%), by Sample Type 2025 & 2033
- Figure 27: Europe Compound Management Industry Revenue (billion), by Application 2025 & 2033
- Figure 28: Europe Compound Management Industry Volume (K unit), by Application 2025 & 2033
- Figure 29: Europe Compound Management Industry Revenue Share (%), by Application 2025 & 2033
- Figure 30: Europe Compound Management Industry Volume Share (%), by Application 2025 & 2033
- Figure 31: Europe Compound Management Industry Revenue (billion), by Country 2025 & 2033
- Figure 32: Europe Compound Management Industry Volume (K unit), by Country 2025 & 2033
- Figure 33: Europe Compound Management Industry Revenue Share (%), by Country 2025 & 2033
- Figure 34: Europe Compound Management Industry Volume Share (%), by Country 2025 & 2033
- Figure 35: Asia Pacific Compound Management Industry Revenue (billion), by Type 2025 & 2033
- Figure 36: Asia Pacific Compound Management Industry Volume (K unit), by Type 2025 & 2033
- Figure 37: Asia Pacific Compound Management Industry Revenue Share (%), by Type 2025 & 2033
- Figure 38: Asia Pacific Compound Management Industry Volume Share (%), by Type 2025 & 2033
- Figure 39: Asia Pacific Compound Management Industry Revenue (billion), by Sample Type 2025 & 2033
- Figure 40: Asia Pacific Compound Management Industry Volume (K unit), by Sample Type 2025 & 2033
- Figure 41: Asia Pacific Compound Management Industry Revenue Share (%), by Sample Type 2025 & 2033
- Figure 42: Asia Pacific Compound Management Industry Volume Share (%), by Sample Type 2025 & 2033
- Figure 43: Asia Pacific Compound Management Industry Revenue (billion), by Application 2025 & 2033
- Figure 44: Asia Pacific Compound Management Industry Volume (K unit), by Application 2025 & 2033
- Figure 45: Asia Pacific Compound Management Industry Revenue Share (%), by Application 2025 & 2033
- Figure 46: Asia Pacific Compound Management Industry Volume Share (%), by Application 2025 & 2033
- Figure 47: Asia Pacific Compound Management Industry Revenue (billion), by Country 2025 & 2033
- Figure 48: Asia Pacific Compound Management Industry Volume (K unit), by Country 2025 & 2033
- Figure 49: Asia Pacific Compound Management Industry Revenue Share (%), by Country 2025 & 2033
- Figure 50: Asia Pacific Compound Management Industry Volume Share (%), by Country 2025 & 2033
- Figure 51: Middle East and Africa Compound Management Industry Revenue (billion), by Type 2025 & 2033
- Figure 52: Middle East and Africa Compound Management Industry Volume (K unit), by Type 2025 & 2033
- Figure 53: Middle East and Africa Compound Management Industry Revenue Share (%), by Type 2025 & 2033
- Figure 54: Middle East and Africa Compound Management Industry Volume Share (%), by Type 2025 & 2033
- Figure 55: Middle East and Africa Compound Management Industry Revenue (billion), by Sample Type 2025 & 2033
- Figure 56: Middle East and Africa Compound Management Industry Volume (K unit), by Sample Type 2025 & 2033
- Figure 57: Middle East and Africa Compound Management Industry Revenue Share (%), by Sample Type 2025 & 2033
- Figure 58: Middle East and Africa Compound Management Industry Volume Share (%), by Sample Type 2025 & 2033
- Figure 59: Middle East and Africa Compound Management Industry Revenue (billion), by Application 2025 & 2033
- Figure 60: Middle East and Africa Compound Management Industry Volume (K unit), by Application 2025 & 2033
- Figure 61: Middle East and Africa Compound Management Industry Revenue Share (%), by Application 2025 & 2033
- Figure 62: Middle East and Africa Compound Management Industry Volume Share (%), by Application 2025 & 2033
- Figure 63: Middle East and Africa Compound Management Industry Revenue (billion), by Country 2025 & 2033
- Figure 64: Middle East and Africa Compound Management Industry Volume (K unit), by Country 2025 & 2033
- Figure 65: Middle East and Africa Compound Management Industry Revenue Share (%), by Country 2025 & 2033
- Figure 66: Middle East and Africa Compound Management Industry Volume Share (%), by Country 2025 & 2033
- Figure 67: South America Compound Management Industry Revenue (billion), by Type 2025 & 2033
- Figure 68: South America Compound Management Industry Volume (K unit), by Type 2025 & 2033
- Figure 69: South America Compound Management Industry Revenue Share (%), by Type 2025 & 2033
- Figure 70: South America Compound Management Industry Volume Share (%), by Type 2025 & 2033
- Figure 71: South America Compound Management Industry Revenue (billion), by Sample Type 2025 & 2033
- Figure 72: South America Compound Management Industry Volume (K unit), by Sample Type 2025 & 2033
- Figure 73: South America Compound Management Industry Revenue Share (%), by Sample Type 2025 & 2033
- Figure 74: South America Compound Management Industry Volume Share (%), by Sample Type 2025 & 2033
- Figure 75: South America Compound Management Industry Revenue (billion), by Application 2025 & 2033
- Figure 76: South America Compound Management Industry Volume (K unit), by Application 2025 & 2033
- Figure 77: South America Compound Management Industry Revenue Share (%), by Application 2025 & 2033
- Figure 78: South America Compound Management Industry Volume Share (%), by Application 2025 & 2033
- Figure 79: South America Compound Management Industry Revenue (billion), by Country 2025 & 2033
- Figure 80: South America Compound Management Industry Volume (K unit), by Country 2025 & 2033
- Figure 81: South America Compound Management Industry Revenue Share (%), by Country 2025 & 2033
- Figure 82: South America Compound Management Industry Volume Share (%), by Country 2025 & 2033
List of Tables
- Table 1: Global Compound Management Industry Revenue billion Forecast, by Type 2020 & 2033
- Table 2: Global Compound Management Industry Volume K unit Forecast, by Type 2020 & 2033
- Table 3: Global Compound Management Industry Revenue billion Forecast, by Sample Type 2020 & 2033
- Table 4: Global Compound Management Industry Volume K unit Forecast, by Sample Type 2020 & 2033
- Table 5: Global Compound Management Industry Revenue billion Forecast, by Application 2020 & 2033
- Table 6: Global Compound Management Industry Volume K unit Forecast, by Application 2020 & 2033
- Table 7: Global Compound Management Industry Revenue billion Forecast, by Region 2020 & 2033
- Table 8: Global Compound Management Industry Volume K unit Forecast, by Region 2020 & 2033
- Table 9: Global Compound Management Industry Revenue billion Forecast, by Type 2020 & 2033
- Table 10: Global Compound Management Industry Volume K unit Forecast, by Type 2020 & 2033
- Table 11: Global Compound Management Industry Revenue billion Forecast, by Sample Type 2020 & 2033
- Table 12: Global Compound Management Industry Volume K unit Forecast, by Sample Type 2020 & 2033
- Table 13: Global Compound Management Industry Revenue billion Forecast, by Application 2020 & 2033
- Table 14: Global Compound Management Industry Volume K unit Forecast, by Application 2020 & 2033
- Table 15: Global Compound Management Industry Revenue billion Forecast, by Country 2020 & 2033
- Table 16: Global Compound Management Industry Volume K unit Forecast, by Country 2020 & 2033
- Table 17: United States Compound Management Industry Revenue (billion) Forecast, by Application 2020 & 2033
- Table 18: United States Compound Management Industry Volume (K unit) Forecast, by Application 2020 & 2033
- Table 19: Canada Compound Management Industry Revenue (billion) Forecast, by Application 2020 & 2033
- Table 20: Canada Compound Management Industry Volume (K unit) Forecast, by Application 2020 & 2033
- Table 21: Mexico Compound Management Industry Revenue (billion) Forecast, by Application 2020 & 2033
- Table 22: Mexico Compound Management Industry Volume (K unit) Forecast, by Application 2020 & 2033
- Table 23: Global Compound Management Industry Revenue billion Forecast, by Type 2020 & 2033
- Table 24: Global Compound Management Industry Volume K unit Forecast, by Type 2020 & 2033
- Table 25: Global Compound Management Industry Revenue billion Forecast, by Sample Type 2020 & 2033
- Table 26: Global Compound Management Industry Volume K unit Forecast, by Sample Type 2020 & 2033
- Table 27: Global Compound Management Industry Revenue billion Forecast, by Application 2020 & 2033
- Table 28: Global Compound Management Industry Volume K unit Forecast, by Application 2020 & 2033
- Table 29: Global Compound Management Industry Revenue billion Forecast, by Country 2020 & 2033
- Table 30: Global Compound Management Industry Volume K unit Forecast, by Country 2020 & 2033
- Table 31: Germany Compound Management Industry Revenue (billion) Forecast, by Application 2020 & 2033
- Table 32: Germany Compound Management Industry Volume (K unit) Forecast, by Application 2020 & 2033
- Table 33: United Kingdom Compound Management Industry Revenue (billion) Forecast, by Application 2020 & 2033
- Table 34: United Kingdom Compound Management Industry Volume (K unit) Forecast, by Application 2020 & 2033
- Table 35: France Compound Management Industry Revenue (billion) Forecast, by Application 2020 & 2033
- Table 36: France Compound Management Industry Volume (K unit) Forecast, by Application 2020 & 2033
- Table 37: Italy Compound Management Industry Revenue (billion) Forecast, by Application 2020 & 2033
- Table 38: Italy Compound Management Industry Volume (K unit) Forecast, by Application 2020 & 2033
- Table 39: Spain Compound Management Industry Revenue (billion) Forecast, by Application 2020 & 2033
- Table 40: Spain Compound Management Industry Volume (K unit) Forecast, by Application 2020 & 2033
- Table 41: Rest of Europe Compound Management Industry Revenue (billion) Forecast, by Application 2020 & 2033
- Table 42: Rest of Europe Compound Management Industry Volume (K unit) Forecast, by Application 2020 & 2033
- Table 43: Global Compound Management Industry Revenue billion Forecast, by Type 2020 & 2033
- Table 44: Global Compound Management Industry Volume K unit Forecast, by Type 2020 & 2033
- Table 45: Global Compound Management Industry Revenue billion Forecast, by Sample Type 2020 & 2033
- Table 46: Global Compound Management Industry Volume K unit Forecast, by Sample Type 2020 & 2033
- Table 47: Global Compound Management Industry Revenue billion Forecast, by Application 2020 & 2033
- Table 48: Global Compound Management Industry Volume K unit Forecast, by Application 2020 & 2033
- Table 49: Global Compound Management Industry Revenue billion Forecast, by Country 2020 & 2033
- Table 50: Global Compound Management Industry Volume K unit Forecast, by Country 2020 & 2033
- Table 51: China Compound Management Industry Revenue (billion) Forecast, by Application 2020 & 2033
- Table 52: China Compound Management Industry Volume (K unit) Forecast, by Application 2020 & 2033
- Table 53: Japan Compound Management Industry Revenue (billion) Forecast, by Application 2020 & 2033
- Table 54: Japan Compound Management Industry Volume (K unit) Forecast, by Application 2020 & 2033
- Table 55: India Compound Management Industry Revenue (billion) Forecast, by Application 2020 & 2033
- Table 56: India Compound Management Industry Volume (K unit) Forecast, by Application 2020 & 2033
- Table 57: Australia Compound Management Industry Revenue (billion) Forecast, by Application 2020 & 2033
- Table 58: Australia Compound Management Industry Volume (K unit) Forecast, by Application 2020 & 2033
- Table 59: South Korea Compound Management Industry Revenue (billion) Forecast, by Application 2020 & 2033
- Table 60: South Korea Compound Management Industry Volume (K unit) Forecast, by Application 2020 & 2033
- Table 61: Rest of Asia Pacific Compound Management Industry Revenue (billion) Forecast, by Application 2020 & 2033
- Table 62: Rest of Asia Pacific Compound Management Industry Volume (K unit) Forecast, by Application 2020 & 2033
- Table 63: Global Compound Management Industry Revenue billion Forecast, by Type 2020 & 2033
- Table 64: Global Compound Management Industry Volume K unit Forecast, by Type 2020 & 2033
- Table 65: Global Compound Management Industry Revenue billion Forecast, by Sample Type 2020 & 2033
- Table 66: Global Compound Management Industry Volume K unit Forecast, by Sample Type 2020 & 2033
- Table 67: Global Compound Management Industry Revenue billion Forecast, by Application 2020 & 2033
- Table 68: Global Compound Management Industry Volume K unit Forecast, by Application 2020 & 2033
- Table 69: Global Compound Management Industry Revenue billion Forecast, by Country 2020 & 2033
- Table 70: Global Compound Management Industry Volume K unit Forecast, by Country 2020 & 2033
- Table 71: GCC Compound Management Industry Revenue (billion) Forecast, by Application 2020 & 2033
- Table 72: GCC Compound Management Industry Volume (K unit) Forecast, by Application 2020 & 2033
- Table 73: South Africa Compound Management Industry Revenue (billion) Forecast, by Application 2020 & 2033
- Table 74: South Africa Compound Management Industry Volume (K unit) Forecast, by Application 2020 & 2033
- Table 75: Rest of Middle East and Africa Compound Management Industry Revenue (billion) Forecast, by Application 2020 & 2033
- Table 76: Rest of Middle East and Africa Compound Management Industry Volume (K unit) Forecast, by Application 2020 & 2033
- Table 77: Global Compound Management Industry Revenue billion Forecast, by Type 2020 & 2033
- Table 78: Global Compound Management Industry Volume K unit Forecast, by Type 2020 & 2033
- Table 79: Global Compound Management Industry Revenue billion Forecast, by Sample Type 2020 & 2033
- Table 80: Global Compound Management Industry Volume K unit Forecast, by Sample Type 2020 & 2033
- Table 81: Global Compound Management Industry Revenue billion Forecast, by Application 2020 & 2033
- Table 82: Global Compound Management Industry Volume K unit Forecast, by Application 2020 & 2033
- Table 83: Global Compound Management Industry Revenue billion Forecast, by Country 2020 & 2033
- Table 84: Global Compound Management Industry Volume K unit Forecast, by Country 2020 & 2033
- Table 85: Brazil Compound Management Industry Revenue (billion) Forecast, by Application 2020 & 2033
- Table 86: Brazil Compound Management Industry Volume (K unit) Forecast, by Application 2020 & 2033
- Table 87: Argentina Compound Management Industry Revenue (billion) Forecast, by Application 2020 & 2033
- Table 88: Argentina Compound Management Industry Volume (K unit) Forecast, by Application 2020 & 2033
- Table 89: Rest of South America Compound Management Industry Revenue (billion) Forecast, by Application 2020 & 2033
- Table 90: Rest of South America Compound Management Industry Volume (K unit) Forecast, by Application 2020 & 2033
Frequently Asked Questions
1. What is the projected Compound Annual Growth Rate (CAGR) of the Compound Management Industry?
The projected CAGR is approximately 7.08%.
2. Which companies are prominent players in the Compound Management Industry?
Key companies in the market include Tecan Trading AG, Beckman Coulter Inc, AXXAM SpA, Titian Software Limited, SPT Labtech, Evotec, LiCONiC AG, Brooks Life Sciences, Hamilton Company, BioAscent.
3. What are the main segments of the Compound Management Industry?
The market segments include Type, Sample Type, Application.
4. Can you provide details about the market size?
The market size is estimated to be USD 9.94 billion as of 2022.
5. What are some drivers contributing to market growth?
Increasing Drug Discovery Activities; Growth in the Bio-pharmaceutical Industry; Technological Advancement and Favorable Reimbursement.
6. What are the notable trends driving market growth?
The Automated Storage Systems Segment is Expected to Dominate the Market Over the Forecast Period..
7. Are there any restraints impacting market growth?
High Cost Associated with Compound Management.
8. Can you provide examples of recent developments in the market?
February 2021: SPT Labtech announced the acquisition of BioMicroLab, a robotics automation provider, to strengthen its capabilities in automatic sample management.
9. What pricing options are available for accessing the report?
Pricing options include single-user, multi-user, and enterprise licenses priced at USD 4750, USD 5250, and USD 8750 respectively.
10. Is the market size provided in terms of value or volume?
The market size is provided in terms of value, measured in billion and volume, measured in K unit.
11. Are there any specific market keywords associated with the report?
Yes, the market keyword associated with the report is "Compound Management Industry," which aids in identifying and referencing the specific market segment covered.
12. How do I determine which pricing option suits my needs best?
The pricing options vary based on user requirements and access needs. Individual users may opt for single-user licenses, while businesses requiring broader access may choose multi-user or enterprise licenses for cost-effective access to the report.
13. Are there any additional resources or data provided in the Compound Management Industry report?
While the report offers comprehensive insights, it's advisable to review the specific contents or supplementary materials provided to ascertain if additional resources or data are available.
14. How can I stay updated on further developments or reports in the Compound Management Industry?
To stay informed about further developments, trends, and reports in the Compound Management Industry, consider subscribing to industry newsletters, following relevant companies and organizations, or regularly checking reputable industry news sources and publications.
Methodology
Step 1 - Identification of Relevant Samples Size from Population Database


Step 2 - Approaches for Defining Global Market Size (Value, Volume* & Price*)

Note*: In applicable scenarios
Step 3 - Data Sources
Primary Research
- Web Analytics
- Survey Reports
- Research Institute
- Latest Research Reports
- Opinion Leaders
Secondary Research
- Annual Reports
- White Paper
- Latest Press Release
- Industry Association
- Paid Database
- Investor Presentations

Step 4 - Data Triangulation
Involves using different sources of information in order to increase the validity of a study
These sources are likely to be stakeholders in a program - participants, other researchers, program staff, other community members, and so on.
Then we put all data in single framework & apply various statistical tools to find out the dynamic on the market.
During the analysis stage, feedback from the stakeholder groups would be compared to determine areas of agreement as well as areas of divergence