

Key Insights
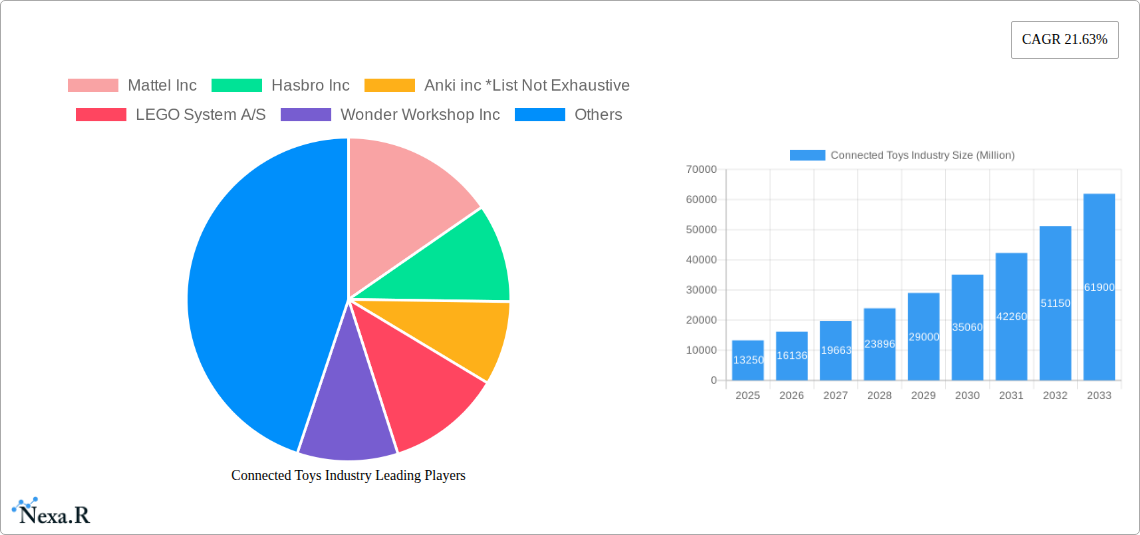
The connected toys market, valued at $13.25 billion in 2025, is experiencing robust growth, projected to expand at a compound annual growth rate (CAGR) of 21.63% from 2025 to 2033. This surge is driven by several key factors. Increasing smartphone penetration, particularly amongst children, fuels demand for smartphone-connected toys. Parents are increasingly seeking educational and interactive play experiences, leading to higher adoption of toys integrating technology. Advancements in artificial intelligence (AI) and augmented reality (AR) technologies are also contributing significantly, enabling more sophisticated and engaging gameplay. The market is segmented by connection type, with smartphone-connected toys currently holding the largest market share, followed by console and tablet-connected toys. This segmentation reflects the diverse technological access among children and their families. Furthermore, the rise in popularity of STEM (Science, Technology, Engineering, and Mathematics) learning initiatives boosts the demand for educational connected toys. However, concerns regarding data privacy and security, as well as the potential for excessive screen time, pose challenges to market growth.
Major players like Mattel, Hasbro, LEGO, and Sphero are driving innovation and competition, constantly introducing new products with enhanced features and functionalities. Geographic distribution shows significant market penetration in North America and Europe, driven by higher disposable incomes and technological advancements. However, Asia-Pacific is poised for substantial growth due to its expanding middle class and increasing adoption of smart devices. The forecast period (2025-2033) anticipates a significant market expansion, with particular growth in areas incorporating advanced technologies like AI and AR, as well as those focused on educational and developmental benefits for children. The continuous integration of innovative features and the focus on creating interactive and educational experiences will be crucial for maintaining this growth trajectory.
Connected Toys Industry Market Report: 2019-2033
This comprehensive report provides a detailed analysis of the Connected Toys industry, encompassing market dynamics, growth trends, regional performance, product landscape, key players, and future outlook. With a study period spanning 2019-2033, a base year of 2025, and an estimated year of 2025, this report offers invaluable insights for industry professionals, investors, and strategic decision-makers. The report analyzes both parent and child markets to provide a complete understanding of this dynamic sector. Projected market values are presented in million units.
Connected Toys Industry Market Dynamics & Structure
The Connected Toys market, encompassing smartphone, console, and tablet-connected toys, exhibits a moderately concentrated structure. Key players like Mattel Inc, Hasbro Inc, LEGO System A/S, and others hold significant market share, but smaller innovative companies also contribute to market dynamism. Technological innovation, particularly in areas like AI, AR/VR integration, and improved connectivity, is a primary growth driver. Regulatory frameworks concerning data privacy and children's safety pose significant challenges and influence product development. Competitive substitutes, including traditional toys and digital entertainment platforms, exert pressure on market penetration. The end-user demographic primarily includes children aged 3-12, with parents acting as primary purchasers. M&A activity has been moderate, with strategic acquisitions aimed at expanding product portfolios and technological capabilities.
- Market Concentration: Moderately concentrated, with top 5 players holding xx% market share (2024).
- Technological Innovation: AI integration, enhanced connectivity, AR/VR features drive innovation.
- Regulatory Landscape: Data privacy regulations impact product design and marketing.
- Competitive Substitutes: Traditional toys and digital entertainment pose a competitive threat.
- End-User Demographics: Primarily children aged 3-12, influencing design and functionality.
- M&A Activity: Moderate activity focusing on technology acquisition and product diversification. xx M&A deals in the historical period (2019-2024).
Connected Toys Industry Growth Trends & Insights
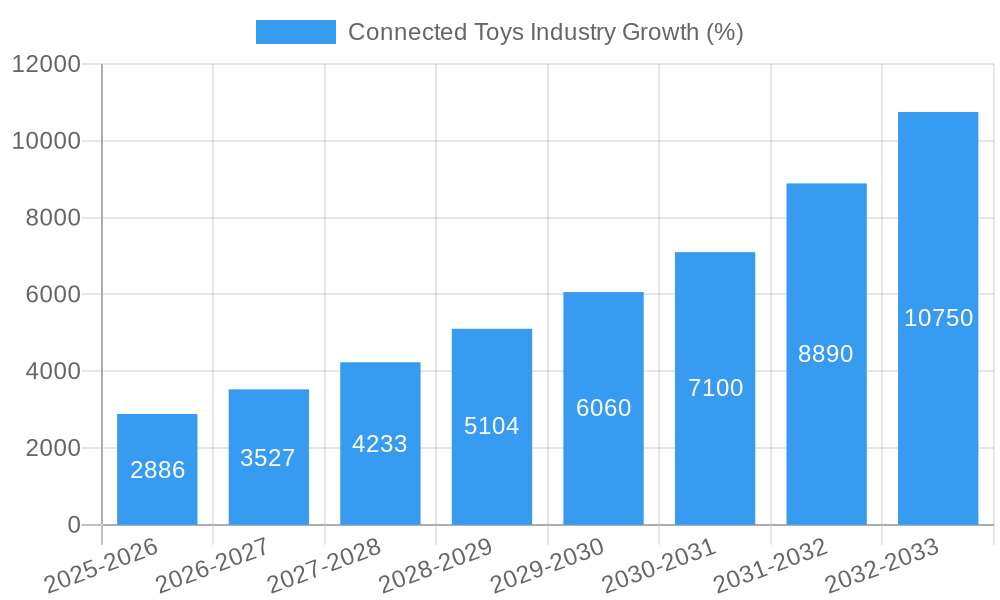
The Connected Toys market experienced significant growth during the historical period (2019-2024), with a CAGR of xx%. This growth is attributed to increasing smartphone and tablet penetration, rising disposable incomes in key markets, and evolving consumer preferences towards interactive and educational toys. Technological disruptions, such as the integration of AI and IoT, are creating new opportunities for enhanced play experiences and data-driven personalization. Consumer behavior shifts show a preference for toys that offer digital connectivity, interactive features, and educational value. The market is expected to maintain a robust growth trajectory during the forecast period (2025-2033), reaching xx million units by 2033, driven by continuous technological advancements and increasing market penetration, particularly in emerging economies. Market penetration is expected to reach xx% by 2033.
Dominant Regions, Countries, or Segments in Connected Toys Industry
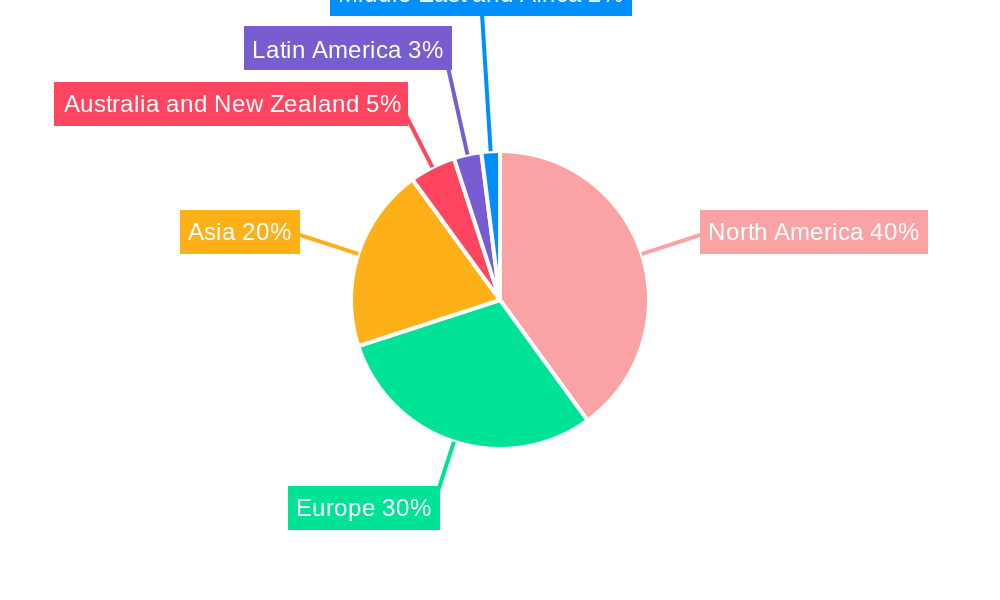
North America and Europe currently dominate the Connected Toys market, driven by higher disposable incomes, advanced technological infrastructure, and strong brand presence. Within these regions, the Smartphone Connected Toys segment holds the largest market share due to widespread smartphone ownership and the ease of integration. Asia-Pacific is experiencing rapid growth, driven by increasing smartphone penetration and a large child population. However, regulatory hurdles and infrastructure limitations present challenges.
- Key Drivers in North America: High disposable income, strong brand presence, early adoption of new technologies.
- Key Drivers in Europe: Established technological infrastructure, stringent safety regulations, parent interest in educational apps.
- Key Drivers in Asia-Pacific: Rapid increase in smartphone penetration, large child population, growing middle class.
- Segment Dominance: Smartphone Connected Toys holds the largest market share globally, followed by Tablet Connected Toys and then Console Connected Toys.
Connected Toys Industry Product Landscape
Connected toys are rapidly evolving, incorporating sophisticated features like AI-powered voice recognition, augmented reality experiences, and personalized learning modules. These advancements enhance the play experience, offer educational benefits, and cater to evolving consumer preferences. Unique selling propositions include interactive storytelling, customized gameplay, and integration with other smart devices. Technological advancements focus on improved connectivity, enhanced safety features, and seamless integration with parental control applications.
Key Drivers, Barriers & Challenges in Connected Toys Industry
Key Drivers:
- Increasing smartphone and tablet penetration.
- Growing demand for interactive and educational toys.
- Technological advancements in AI, AR/VR, and IoT.
- Rising disposable incomes in key markets.
Key Challenges:
- Data privacy concerns and regulatory hurdles.
- High manufacturing and R&D costs.
- Intense competition from established toy manufacturers and tech companies.
- Supply chain disruptions. The impact is estimated to be xx% reduction in production during the historical period.
Emerging Opportunities in Connected Toys Industry
Emerging opportunities include the development of toys with advanced AI capabilities, integration with educational platforms, and the expansion into untapped markets like developing economies. Increased focus on sustainability and eco-friendly materials also presents opportunities. The development of toys targeted towards older children and adolescents represents a significant growth area.
Growth Accelerators in the Connected Toys Industry
Technological breakthroughs, strategic partnerships between toy companies and tech firms, and expansion into new markets are key growth catalysts. Innovation in areas such as personalized learning experiences and interactive storytelling will further drive market expansion. The increasing acceptance of connected toys by parents, driven by the educational and developmental benefits, also accelerates growth.
Key Players Shaping the Connected Toys Industry Market
- Mattel Inc
- Hasbro Inc
- Anki inc
- LEGO System A/S
- Wonder Workshop Inc
- Sphero
- WowWee Group Limited
- Leka SAS
- Sony Corporation
- Bandai Namco Entertainment Inc
Notable Milestones in Connected Toys Industry Sector
- March 2023: LEGO Group reports significant profit increase and expands its retail presence with 155 new stores.
- January 2022: LEGO discontinues its VIDIYO music-making toy line.
In-Depth Connected Toys Industry Market Outlook
The Connected Toys market is poised for continued growth driven by ongoing technological advancements, increasing consumer demand, and strategic partnerships. Future opportunities lie in expanding into new markets, developing innovative product features, and leveraging data analytics to personalize the user experience. The market is expected to witness strong growth across all segments, particularly in regions with high smartphone penetration and increasing disposable incomes.
Connected Toys Industry Segmentation
-
1. Type
- 1.1. Smartphone Connected Toys
- 1.2. Console Connected Toys
- 1.3. Tablet Connected Toys
Connected Toys Industry Segmentation By Geography
- 1. North America
- 2. Europe
- 3. Asia
- 4. Australia and New Zealand
- 5. Latin America
- 6. Middle East and Africa
Connected Toys Industry REPORT HIGHLIGHTS
| Aspects | Details |
|---|---|
| Study Period | 2019-2033 |
| Base Year | 2024 |
| Estimated Year | 2025 |
| Forecast Period | 2025-2033 |
| Historical Period | 2019-2024 |
| Growth Rate | CAGR of 21.63% from 2019-2033 |
| Segmentation |
|
Table of Contents
- 1. Introduction
- 1.1. Research Scope
- 1.2. Market Segmentation
- 1.3. Research Methodology
- 1.4. Definitions and Assumptions
- 2. Executive Summary
- 2.1. Introduction
- 3. Market Dynamics
- 3.1. Introduction
- 3.2. Market Drivers
- 3.2.1. Easy Availability of Connected Platforms
- 3.3. Market Restrains
- 3.3.1. Fragmented Market with Several Local Vendors
- 3.4. Market Trends
- 3.4.1. Smartphone Connected Toys are Expected to Witness Significant Growth
- 4. Market Factor Analysis
- 4.1. Porters Five Forces
- 4.2. Supply/Value Chain
- 4.3. PESTEL analysis
- 4.4. Market Entropy
- 4.5. Patent/Trademark Analysis
- 5. Global Connected Toys Industry Analysis, Insights and Forecast, 2019-2031
- 5.1. Market Analysis, Insights and Forecast - by Type
- 5.1.1. Smartphone Connected Toys
- 5.1.2. Console Connected Toys
- 5.1.3. Tablet Connected Toys
- 5.2. Market Analysis, Insights and Forecast - by Region
- 5.2.1. North America
- 5.2.2. Europe
- 5.2.3. Asia
- 5.2.4. Australia and New Zealand
- 5.2.5. Latin America
- 5.2.6. Middle East and Africa
- 5.1. Market Analysis, Insights and Forecast - by Type
- 6. North America Connected Toys Industry Analysis, Insights and Forecast, 2019-2031
- 6.1. Market Analysis, Insights and Forecast - by Type
- 6.1.1. Smartphone Connected Toys
- 6.1.2. Console Connected Toys
- 6.1.3. Tablet Connected Toys
- 6.1. Market Analysis, Insights and Forecast - by Type
- 7. Europe Connected Toys Industry Analysis, Insights and Forecast, 2019-2031
- 7.1. Market Analysis, Insights and Forecast - by Type
- 7.1.1. Smartphone Connected Toys
- 7.1.2. Console Connected Toys
- 7.1.3. Tablet Connected Toys
- 7.1. Market Analysis, Insights and Forecast - by Type
- 8. Asia Connected Toys Industry Analysis, Insights and Forecast, 2019-2031
- 8.1. Market Analysis, Insights and Forecast - by Type
- 8.1.1. Smartphone Connected Toys
- 8.1.2. Console Connected Toys
- 8.1.3. Tablet Connected Toys
- 8.1. Market Analysis, Insights and Forecast - by Type
- 9. Australia and New Zealand Connected Toys Industry Analysis, Insights and Forecast, 2019-2031
- 9.1. Market Analysis, Insights and Forecast - by Type
- 9.1.1. Smartphone Connected Toys
- 9.1.2. Console Connected Toys
- 9.1.3. Tablet Connected Toys
- 9.1. Market Analysis, Insights and Forecast - by Type
- 10. Latin America Connected Toys Industry Analysis, Insights and Forecast, 2019-2031
- 10.1. Market Analysis, Insights and Forecast - by Type
- 10.1.1. Smartphone Connected Toys
- 10.1.2. Console Connected Toys
- 10.1.3. Tablet Connected Toys
- 10.1. Market Analysis, Insights and Forecast - by Type
- 11. Middle East and Africa Connected Toys Industry Analysis, Insights and Forecast, 2019-2031
- 11.1. Market Analysis, Insights and Forecast - by Type
- 11.1.1. Smartphone Connected Toys
- 11.1.2. Console Connected Toys
- 11.1.3. Tablet Connected Toys
- 11.1. Market Analysis, Insights and Forecast - by Type
- 12. North America Connected Toys Industry Analysis, Insights and Forecast, 2019-2031
- 12.1. Market Analysis, Insights and Forecast - By Country/Sub-region
- 12.1.1.
- 13. Europe Connected Toys Industry Analysis, Insights and Forecast, 2019-2031
- 13.1. Market Analysis, Insights and Forecast - By Country/Sub-region
- 13.1.1.
- 14. Asia Connected Toys Industry Analysis, Insights and Forecast, 2019-2031
- 14.1. Market Analysis, Insights and Forecast - By Country/Sub-region
- 14.1.1.
- 15. Australia and New Zealand Connected Toys Industry Analysis, Insights and Forecast, 2019-2031
- 15.1. Market Analysis, Insights and Forecast - By Country/Sub-region
- 15.1.1.
- 16. Latin America Connected Toys Industry Analysis, Insights and Forecast, 2019-2031
- 16.1. Market Analysis, Insights and Forecast - By Country/Sub-region
- 16.1.1.
- 17. Middle East and Africa Connected Toys Industry Analysis, Insights and Forecast, 2019-2031
- 17.1. Market Analysis, Insights and Forecast - By Country/Sub-region
- 17.1.1.
- 18. Competitive Analysis
- 18.1. Global Market Share Analysis 2024
- 18.2. Company Profiles
- 18.2.1 Mattel Inc
- 18.2.1.1. Overview
- 18.2.1.2. Products
- 18.2.1.3. SWOT Analysis
- 18.2.1.4. Recent Developments
- 18.2.1.5. Financials (Based on Availability)
- 18.2.2 Hasbro Inc
- 18.2.2.1. Overview
- 18.2.2.2. Products
- 18.2.2.3. SWOT Analysis
- 18.2.2.4. Recent Developments
- 18.2.2.5. Financials (Based on Availability)
- 18.2.3 Anki inc *List Not Exhaustive
- 18.2.3.1. Overview
- 18.2.3.2. Products
- 18.2.3.3. SWOT Analysis
- 18.2.3.4. Recent Developments
- 18.2.3.5. Financials (Based on Availability)
- 18.2.4 LEGO System A/S
- 18.2.4.1. Overview
- 18.2.4.2. Products
- 18.2.4.3. SWOT Analysis
- 18.2.4.4. Recent Developments
- 18.2.4.5. Financials (Based on Availability)
- 18.2.5 Wonder Workshop Inc
- 18.2.5.1. Overview
- 18.2.5.2. Products
- 18.2.5.3. SWOT Analysis
- 18.2.5.4. Recent Developments
- 18.2.5.5. Financials (Based on Availability)
- 18.2.6 Sphero
- 18.2.6.1. Overview
- 18.2.6.2. Products
- 18.2.6.3. SWOT Analysis
- 18.2.6.4. Recent Developments
- 18.2.6.5. Financials (Based on Availability)
- 18.2.7 WowWee Group Limited
- 18.2.7.1. Overview
- 18.2.7.2. Products
- 18.2.7.3. SWOT Analysis
- 18.2.7.4. Recent Developments
- 18.2.7.5. Financials (Based on Availability)
- 18.2.8 Leka SAS
- 18.2.8.1. Overview
- 18.2.8.2. Products
- 18.2.8.3. SWOT Analysis
- 18.2.8.4. Recent Developments
- 18.2.8.5. Financials (Based on Availability)
- 18.2.9 Sony Corporation
- 18.2.9.1. Overview
- 18.2.9.2. Products
- 18.2.9.3. SWOT Analysis
- 18.2.9.4. Recent Developments
- 18.2.9.5. Financials (Based on Availability)
- 18.2.10 Bandai Namco Entertainment Inc
- 18.2.10.1. Overview
- 18.2.10.2. Products
- 18.2.10.3. SWOT Analysis
- 18.2.10.4. Recent Developments
- 18.2.10.5. Financials (Based on Availability)
- 18.2.1 Mattel Inc
List of Figures
- Figure 1: Global Connected Toys Industry Revenue Breakdown (Million, %) by Region 2024 & 2032
- Figure 2: North America Connected Toys Industry Revenue (Million), by Country 2024 & 2032
- Figure 3: North America Connected Toys Industry Revenue Share (%), by Country 2024 & 2032
- Figure 4: Europe Connected Toys Industry Revenue (Million), by Country 2024 & 2032
- Figure 5: Europe Connected Toys Industry Revenue Share (%), by Country 2024 & 2032
- Figure 6: Asia Connected Toys Industry Revenue (Million), by Country 2024 & 2032
- Figure 7: Asia Connected Toys Industry Revenue Share (%), by Country 2024 & 2032
- Figure 8: Australia and New Zealand Connected Toys Industry Revenue (Million), by Country 2024 & 2032
- Figure 9: Australia and New Zealand Connected Toys Industry Revenue Share (%), by Country 2024 & 2032
- Figure 10: Latin America Connected Toys Industry Revenue (Million), by Country 2024 & 2032
- Figure 11: Latin America Connected Toys Industry Revenue Share (%), by Country 2024 & 2032
- Figure 12: Middle East and Africa Connected Toys Industry Revenue (Million), by Country 2024 & 2032
- Figure 13: Middle East and Africa Connected Toys Industry Revenue Share (%), by Country 2024 & 2032
- Figure 14: North America Connected Toys Industry Revenue (Million), by Type 2024 & 2032
- Figure 15: North America Connected Toys Industry Revenue Share (%), by Type 2024 & 2032
- Figure 16: North America Connected Toys Industry Revenue (Million), by Country 2024 & 2032
- Figure 17: North America Connected Toys Industry Revenue Share (%), by Country 2024 & 2032
- Figure 18: Europe Connected Toys Industry Revenue (Million), by Type 2024 & 2032
- Figure 19: Europe Connected Toys Industry Revenue Share (%), by Type 2024 & 2032
- Figure 20: Europe Connected Toys Industry Revenue (Million), by Country 2024 & 2032
- Figure 21: Europe Connected Toys Industry Revenue Share (%), by Country 2024 & 2032
- Figure 22: Asia Connected Toys Industry Revenue (Million), by Type 2024 & 2032
- Figure 23: Asia Connected Toys Industry Revenue Share (%), by Type 2024 & 2032
- Figure 24: Asia Connected Toys Industry Revenue (Million), by Country 2024 & 2032
- Figure 25: Asia Connected Toys Industry Revenue Share (%), by Country 2024 & 2032
- Figure 26: Australia and New Zealand Connected Toys Industry Revenue (Million), by Type 2024 & 2032
- Figure 27: Australia and New Zealand Connected Toys Industry Revenue Share (%), by Type 2024 & 2032
- Figure 28: Australia and New Zealand Connected Toys Industry Revenue (Million), by Country 2024 & 2032
- Figure 29: Australia and New Zealand Connected Toys Industry Revenue Share (%), by Country 2024 & 2032
- Figure 30: Latin America Connected Toys Industry Revenue (Million), by Type 2024 & 2032
- Figure 31: Latin America Connected Toys Industry Revenue Share (%), by Type 2024 & 2032
- Figure 32: Latin America Connected Toys Industry Revenue (Million), by Country 2024 & 2032
- Figure 33: Latin America Connected Toys Industry Revenue Share (%), by Country 2024 & 2032
- Figure 34: Middle East and Africa Connected Toys Industry Revenue (Million), by Type 2024 & 2032
- Figure 35: Middle East and Africa Connected Toys Industry Revenue Share (%), by Type 2024 & 2032
- Figure 36: Middle East and Africa Connected Toys Industry Revenue (Million), by Country 2024 & 2032
- Figure 37: Middle East and Africa Connected Toys Industry Revenue Share (%), by Country 2024 & 2032
List of Tables
- Table 1: Global Connected Toys Industry Revenue Million Forecast, by Region 2019 & 2032
- Table 2: Global Connected Toys Industry Revenue Million Forecast, by Type 2019 & 2032
- Table 3: Global Connected Toys Industry Revenue Million Forecast, by Region 2019 & 2032
- Table 4: Global Connected Toys Industry Revenue Million Forecast, by Country 2019 & 2032
- Table 5: Connected Toys Industry Revenue (Million) Forecast, by Application 2019 & 2032
- Table 6: Global Connected Toys Industry Revenue Million Forecast, by Country 2019 & 2032
- Table 7: Connected Toys Industry Revenue (Million) Forecast, by Application 2019 & 2032
- Table 8: Global Connected Toys Industry Revenue Million Forecast, by Country 2019 & 2032
- Table 9: Connected Toys Industry Revenue (Million) Forecast, by Application 2019 & 2032
- Table 10: Global Connected Toys Industry Revenue Million Forecast, by Country 2019 & 2032
- Table 11: Connected Toys Industry Revenue (Million) Forecast, by Application 2019 & 2032
- Table 12: Global Connected Toys Industry Revenue Million Forecast, by Country 2019 & 2032
- Table 13: Connected Toys Industry Revenue (Million) Forecast, by Application 2019 & 2032
- Table 14: Global Connected Toys Industry Revenue Million Forecast, by Country 2019 & 2032
- Table 15: Connected Toys Industry Revenue (Million) Forecast, by Application 2019 & 2032
- Table 16: Global Connected Toys Industry Revenue Million Forecast, by Type 2019 & 2032
- Table 17: Global Connected Toys Industry Revenue Million Forecast, by Country 2019 & 2032
- Table 18: Global Connected Toys Industry Revenue Million Forecast, by Type 2019 & 2032
- Table 19: Global Connected Toys Industry Revenue Million Forecast, by Country 2019 & 2032
- Table 20: Global Connected Toys Industry Revenue Million Forecast, by Type 2019 & 2032
- Table 21: Global Connected Toys Industry Revenue Million Forecast, by Country 2019 & 2032
- Table 22: Global Connected Toys Industry Revenue Million Forecast, by Type 2019 & 2032
- Table 23: Global Connected Toys Industry Revenue Million Forecast, by Country 2019 & 2032
- Table 24: Global Connected Toys Industry Revenue Million Forecast, by Type 2019 & 2032
- Table 25: Global Connected Toys Industry Revenue Million Forecast, by Country 2019 & 2032
- Table 26: Global Connected Toys Industry Revenue Million Forecast, by Type 2019 & 2032
- Table 27: Global Connected Toys Industry Revenue Million Forecast, by Country 2019 & 2032
Frequently Asked Questions
1. What is the projected Compound Annual Growth Rate (CAGR) of the Connected Toys Industry?
The projected CAGR is approximately 21.63%.
2. Which companies are prominent players in the Connected Toys Industry?
Key companies in the market include Mattel Inc, Hasbro Inc, Anki inc *List Not Exhaustive, LEGO System A/S, Wonder Workshop Inc, Sphero, WowWee Group Limited, Leka SAS, Sony Corporation, Bandai Namco Entertainment Inc.
3. What are the main segments of the Connected Toys Industry?
The market segments include Type.
4. Can you provide details about the market size?
The market size is estimated to be USD 13.25 Million as of 2022.
5. What are some drivers contributing to market growth?
Easy Availability of Connected Platforms.
6. What are the notable trends driving market growth?
Smartphone Connected Toys are Expected to Witness Significant Growth.
7. Are there any restraints impacting market growth?
Fragmented Market with Several Local Vendors.
8. Can you provide examples of recent developments in the market?
March 2023: The Lego Group recently announced a significant increase in profit after three years, despite experiencing a surge in demand. To meet the growing demand, the company made substantial investments in production capabilities and expanded its reach by opening 155 new branded stores in the previous year. Additionally, the company ramped up production at three of its five factories to ensure an adequate supply of Lego products.
9. What pricing options are available for accessing the report?
Pricing options include single-user, multi-user, and enterprise licenses priced at USD 4750, USD 5250, and USD 8750 respectively.
10. Is the market size provided in terms of value or volume?
The market size is provided in terms of value, measured in Million.
11. Are there any specific market keywords associated with the report?
Yes, the market keyword associated with the report is "Connected Toys Industry," which aids in identifying and referencing the specific market segment covered.
12. How do I determine which pricing option suits my needs best?
The pricing options vary based on user requirements and access needs. Individual users may opt for single-user licenses, while businesses requiring broader access may choose multi-user or enterprise licenses for cost-effective access to the report.
13. Are there any additional resources or data provided in the Connected Toys Industry report?
While the report offers comprehensive insights, it's advisable to review the specific contents or supplementary materials provided to ascertain if additional resources or data are available.
14. How can I stay updated on further developments or reports in the Connected Toys Industry?
To stay informed about further developments, trends, and reports in the Connected Toys Industry, consider subscribing to industry newsletters, following relevant companies and organizations, or regularly checking reputable industry news sources and publications.
Methodology
Step 1 - Identification of Relevant Samples Size from Population Database


Step 2 - Approaches for Defining Global Market Size (Value, Volume* & Price*)

Note*: In applicable scenarios
Step 3 - Data Sources
Primary Research
- Web Analytics
- Survey Reports
- Research Institute
- Latest Research Reports
- Opinion Leaders
Secondary Research
- Annual Reports
- White Paper
- Latest Press Release
- Industry Association
- Paid Database
- Investor Presentations

Step 4 - Data Triangulation
Involves using different sources of information in order to increase the validity of a study
These sources are likely to be stakeholders in a program - participants, other researchers, program staff, other community members, and so on.
Then we put all data in single framework & apply various statistical tools to find out the dynamic on the market.
During the analysis stage, feedback from the stakeholder groups would be compared to determine areas of agreement as well as areas of divergence
