

Key Insights
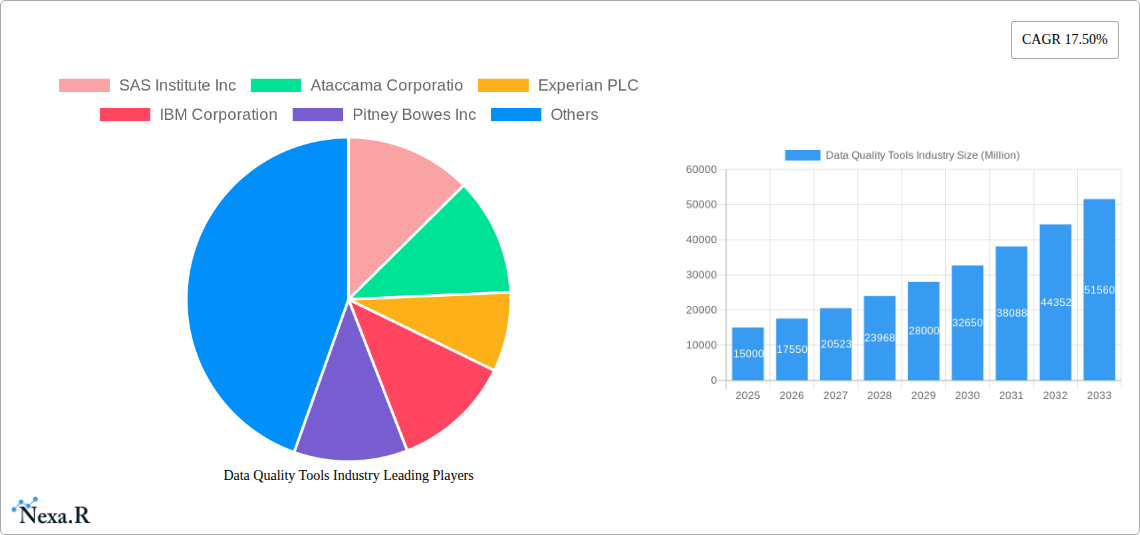
The Data Quality Tools market is experiencing robust growth, projected to reach a substantial size by 2033, driven by a compound annual growth rate (CAGR) of 17.50%. This expansion is fueled by several key factors. The increasing volume and complexity of data across various industries, coupled with the rising need for regulatory compliance (like GDPR and CCPA), are compelling organizations to prioritize data quality. Businesses are increasingly recognizing the significant competitive advantage derived from accurate, reliable data, leading to higher investments in data quality solutions. Furthermore, the shift towards cloud-based deployments offers scalability and cost-effectiveness, accelerating market adoption. The market is segmented by deployment type (cloud-based and on-premise), organization size (SMEs and large enterprises), component (software and services), and end-user vertical (BFSI, government, IT & telecom, retail & e-commerce, healthcare, and others). Large enterprises currently dominate the market due to their higher budgets and more complex data management needs. However, the growing adoption of cloud-based solutions is democratizing access to these tools, fostering growth among SMEs. The competitive landscape is shaped by a mix of established players and emerging technology providers, leading to innovation and improved offerings. Geographical expansion, particularly in Asia-Pacific and South America, is expected to contribute significantly to overall market growth in the coming years.
The continued growth trajectory of the Data Quality Tools market will be influenced by several factors. Advancements in artificial intelligence (AI) and machine learning (ML) are enhancing the capabilities of data quality tools, enabling automated data cleansing and validation. This automation contributes to cost reduction and improved efficiency. However, challenges such as data integration complexities and the need for skilled professionals to implement and manage these tools could act as potential restraints. Furthermore, the market will witness increasing consolidation as larger players acquire smaller companies to expand their product portfolios and market reach. The focus will likely shift towards providing integrated solutions that address the entire data quality lifecycle, from data ingestion to reporting and analytics. The growing emphasis on data governance and security will also drive demand for robust data quality tools that ensure compliance and protect sensitive information.
Data Quality Tools Market: A Comprehensive Report (2019-2033)
This comprehensive report provides a detailed analysis of the Data Quality Tools market, encompassing market dynamics, growth trends, regional segmentation, product landscape, key players, and future outlook. The study period covers 2019-2033, with 2025 as the base and estimated year. The forecast period spans 2025-2033, while the historical period encompasses 2019-2024. This report is designed for industry professionals, investors, and strategic decision-makers seeking a deep understanding of this rapidly evolving market. The global market size is predicted to reach xx Million by 2033.
Data Quality Tools Industry Market Dynamics & Structure
The Data Quality Tools market is characterized by a moderately concentrated landscape with key players like SAS Institute Inc, Ataccama Corporation, Experian PLC, IBM Corporation, Pitney Bowes Inc, Information Builders Inc, Syncsort Inc, Oracle Corporation, Informatica LLC, Talend Inc, and SAP SE competing for market share.
- Market Concentration: The market exhibits moderate concentration, with the top 10 players holding an estimated xx% market share in 2025.
- Technological Innovation: AI, machine learning, and automation are driving significant innovation, leading to more efficient and accurate data quality solutions.
- Regulatory Frameworks: GDPR and other data privacy regulations are influencing the demand for robust data quality tools to ensure compliance.
- Competitive Product Substitutes: The rise of cloud-based solutions and open-source alternatives presents a competitive challenge to established vendors.
- End-User Demographics: Large enterprises currently dominate the market, but SMEs are increasingly adopting data quality tools to enhance operational efficiency.
- M&A Trends: Consolidation is expected to continue, with larger players acquiring smaller companies to expand their product portfolios and market reach. An estimated xx M&A deals were recorded in the historical period (2019-2024).
Data Quality Tools Industry Growth Trends & Insights
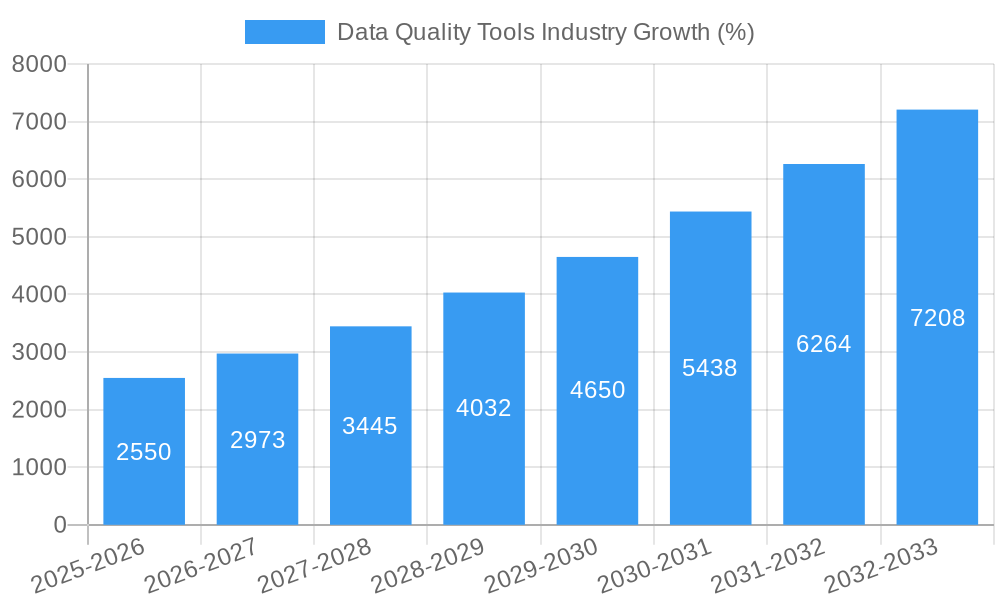
The Data Quality Tools market is experiencing robust growth, driven by the increasing volume and complexity of data across various industries. The market size is projected to grow at a CAGR of xx% during the forecast period (2025-2033), reaching an estimated xx Million by 2033. This growth is fueled by the rising adoption of cloud-based solutions, the increasing demand for data-driven decision-making, and the growing need for data compliance. Technological disruptions such as the rise of AI and big data analytics are further accelerating market growth. Consumer behavior shifts toward greater reliance on data-driven insights are contributing to higher adoption rates. Market penetration is expected to reach xx% by 2033.
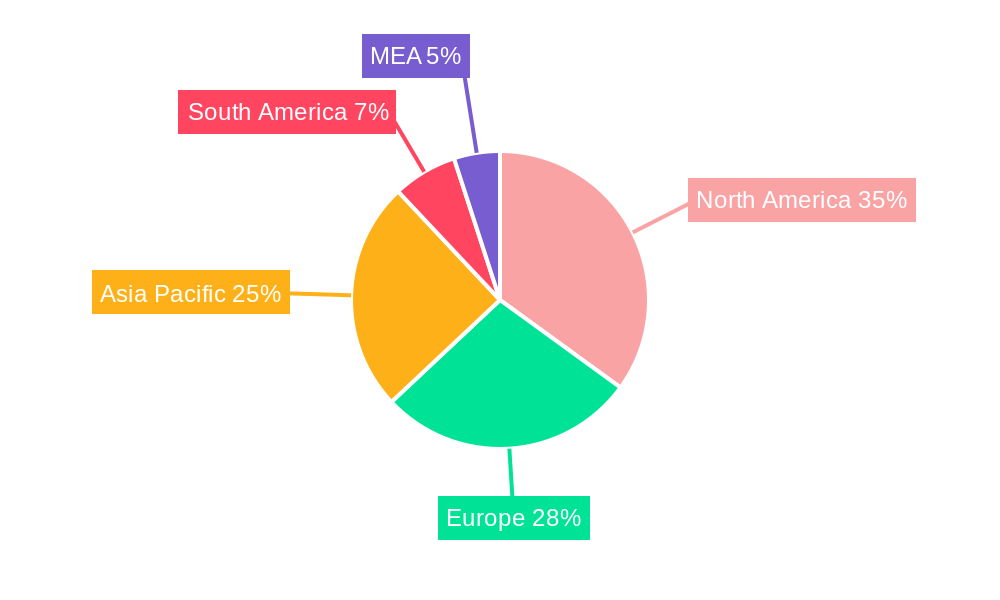
Dominant Regions, Countries, or Segments in Data Quality Tools Industry
North America currently holds the largest market share, followed by Europe and Asia-Pacific. Within these regions, specific countries such as the US, UK, and Germany are significant contributors to market growth.
By Deployment Type: The cloud-based segment is experiencing the fastest growth, driven by its scalability, flexibility, and cost-effectiveness.
By Organization Size: Large enterprises continue to dominate the market, but the SME segment is showing promising growth potential.
By Component: The software segment currently holds the largest market share, followed by the services segment.
By End-user Vertical: The BFSI (Banking, Financial Services, and Insurance) sector is a major driver of market growth, followed by the IT & Telecom, Government, and Healthcare sectors.
- Key Drivers: Strong economic growth in key regions, increasing government investments in IT infrastructure, and growing awareness of data quality's importance are driving market growth.
Data Quality Tools Industry Product Landscape
The Data Quality Tools market offers a diverse range of products, from standalone tools to comprehensive suites. Recent innovations focus on AI-powered data profiling, automated data cleansing, and real-time data quality monitoring. Key features include robust data validation, customizable rules engines, and advanced reporting capabilities. These tools are finding applications across diverse sectors, improving data integrity and enhancing decision-making. Unique selling propositions include ease of use, seamless integration with existing systems, and improved data accuracy.
Key Drivers, Barriers & Challenges in Data Quality Tools Industry
Key Drivers: The exponential growth of data volume, the increasing demand for data-driven decision-making, stringent data regulations (like GDPR), and the need for improved data accuracy are key drivers. The rising adoption of cloud computing and advancements in AI are also accelerating market growth.
Challenges & Restraints: High initial investment costs, the complexity of data integration, a lack of skilled professionals, and data security concerns can hinder market growth. The competitive landscape with numerous vendors also poses a challenge. Supply chain disruptions can impact the availability of components, adding to costs. Estimated losses due to supply chain issues were xx Million in 2024.
Emerging Opportunities in Data Quality Tools Industry
Emerging opportunities include the growing adoption of data quality tools in emerging economies, the increasing demand for data quality solutions in the IoT sector, and the rise of specialized solutions for specific data types (e.g., unstructured data). The development of AI-powered data quality solutions offers substantial potential for market expansion.
Growth Accelerators in the Data Quality Tools Industry
Technological advancements, strategic partnerships between data quality tool vendors and cloud providers, and expansion into new geographic markets are key growth accelerators. Investments in research and development to improve AI and machine learning capabilities are also driving long-term growth.
Key Players Shaping the Data Quality Tools Industry Market
- SAS Institute Inc
- Ataccama Corporation
- Experian PLC
- IBM Corporation
- Pitney Bowes Inc
- Information Builders Inc
- Syncsort Inc
- Oracle Corporation
- Informatica LLC
- Talend Inc
- SAP SE
Notable Milestones in Data Quality Tools Industry Sector
- September 2022: DataCebo launched Synthetic Data (SD) Metrics, a tool for comparing the quality of synthetic data against real datasets. This signifies a growing focus on synthetic data quality.
- May 2022: Pyramid Analytics secured USD 120 Million in Series E funding, boosting investment in AI-driven data analytics and preparation platforms. This reflects investor confidence in the market's growth potential.
In-Depth Data Quality Tools Industry Market Outlook
The Data Quality Tools market is poised for significant growth over the next decade, driven by the continued increase in data volume, the rising demand for data-driven decision-making, and the growing adoption of cloud-based solutions. Strategic partnerships, technological innovation, and market expansion into emerging economies will further fuel market expansion. The market offers lucrative opportunities for both established players and new entrants, promising significant returns on investment.
Data Quality Tools Industry Segmentation
-
1. Deployment Type
- 1.1. Cloud-based
- 1.2. On Premise
-
2. Size of the Organization
- 2.1. Small and Medium Enterprises
- 2.2. Large Enterprises
-
3. Component
- 3.1. Software
- 3.2. Services
-
4. End-user Vertical
- 4.1. BFSI
- 4.2. Government
- 4.3. IT & Telecom
- 4.4. Retail and E-commerce
- 4.5. Healthcare
- 4.6. Other End-user Industries
Data Quality Tools Industry Segmentation By Geography
- 1. North America
- 2. Europe
- 3. Asia Pacific
- 4. Latin America
- 5. Middle East and Africa
Data Quality Tools Industry REPORT HIGHLIGHTS
| Aspects | Details |
|---|---|
| Study Period | 2019-2033 |
| Base Year | 2024 |
| Estimated Year | 2025 |
| Forecast Period | 2025-2033 |
| Historical Period | 2019-2024 |
| Growth Rate | CAGR of 17.50% from 2019-2033 |
| Segmentation |
|
Table of Contents
- 1. Introduction
- 1.1. Research Scope
- 1.2. Market Segmentation
- 1.3. Research Methodology
- 1.4. Definitions and Assumptions
- 2. Executive Summary
- 2.1. Introduction
- 3. Market Dynamics
- 3.1. Introduction
- 3.2. Market Drivers
- 3.2.1. Increasing Use of External Data Sources Owing to Mobile Connectivity Growth
- 3.3. Market Restrains
- 3.3.1. Lack of information and Awareness about the Solutions Among Potential Users
- 3.4. Market Trends
- 3.4.1. Healthcare is Expected to Witness Significant Growth
- 4. Market Factor Analysis
- 4.1. Porters Five Forces
- 4.2. Supply/Value Chain
- 4.3. PESTEL analysis
- 4.4. Market Entropy
- 4.5. Patent/Trademark Analysis
- 5. Global Data Quality Tools Industry Analysis, Insights and Forecast, 2019-2031
- 5.1. Market Analysis, Insights and Forecast - by Deployment Type
- 5.1.1. Cloud-based
- 5.1.2. On Premise
- 5.2. Market Analysis, Insights and Forecast - by Size of the Organization
- 5.2.1. Small and Medium Enterprises
- 5.2.2. Large Enterprises
- 5.3. Market Analysis, Insights and Forecast - by Component
- 5.3.1. Software
- 5.3.2. Services
- 5.4. Market Analysis, Insights and Forecast - by End-user Vertical
- 5.4.1. BFSI
- 5.4.2. Government
- 5.4.3. IT & Telecom
- 5.4.4. Retail and E-commerce
- 5.4.5. Healthcare
- 5.4.6. Other End-user Industries
- 5.5. Market Analysis, Insights and Forecast - by Region
- 5.5.1. North America
- 5.5.2. Europe
- 5.5.3. Asia Pacific
- 5.5.4. Latin America
- 5.5.5. Middle East and Africa
- 5.1. Market Analysis, Insights and Forecast - by Deployment Type
- 6. North America Data Quality Tools Industry Analysis, Insights and Forecast, 2019-2031
- 6.1. Market Analysis, Insights and Forecast - by Deployment Type
- 6.1.1. Cloud-based
- 6.1.2. On Premise
- 6.2. Market Analysis, Insights and Forecast - by Size of the Organization
- 6.2.1. Small and Medium Enterprises
- 6.2.2. Large Enterprises
- 6.3. Market Analysis, Insights and Forecast - by Component
- 6.3.1. Software
- 6.3.2. Services
- 6.4. Market Analysis, Insights and Forecast - by End-user Vertical
- 6.4.1. BFSI
- 6.4.2. Government
- 6.4.3. IT & Telecom
- 6.4.4. Retail and E-commerce
- 6.4.5. Healthcare
- 6.4.6. Other End-user Industries
- 6.1. Market Analysis, Insights and Forecast - by Deployment Type
- 7. Europe Data Quality Tools Industry Analysis, Insights and Forecast, 2019-2031
- 7.1. Market Analysis, Insights and Forecast - by Deployment Type
- 7.1.1. Cloud-based
- 7.1.2. On Premise
- 7.2. Market Analysis, Insights and Forecast - by Size of the Organization
- 7.2.1. Small and Medium Enterprises
- 7.2.2. Large Enterprises
- 7.3. Market Analysis, Insights and Forecast - by Component
- 7.3.1. Software
- 7.3.2. Services
- 7.4. Market Analysis, Insights and Forecast - by End-user Vertical
- 7.4.1. BFSI
- 7.4.2. Government
- 7.4.3. IT & Telecom
- 7.4.4. Retail and E-commerce
- 7.4.5. Healthcare
- 7.4.6. Other End-user Industries
- 7.1. Market Analysis, Insights and Forecast - by Deployment Type
- 8. Asia Pacific Data Quality Tools Industry Analysis, Insights and Forecast, 2019-2031
- 8.1. Market Analysis, Insights and Forecast - by Deployment Type
- 8.1.1. Cloud-based
- 8.1.2. On Premise
- 8.2. Market Analysis, Insights and Forecast - by Size of the Organization
- 8.2.1. Small and Medium Enterprises
- 8.2.2. Large Enterprises
- 8.3. Market Analysis, Insights and Forecast - by Component
- 8.3.1. Software
- 8.3.2. Services
- 8.4. Market Analysis, Insights and Forecast - by End-user Vertical
- 8.4.1. BFSI
- 8.4.2. Government
- 8.4.3. IT & Telecom
- 8.4.4. Retail and E-commerce
- 8.4.5. Healthcare
- 8.4.6. Other End-user Industries
- 8.1. Market Analysis, Insights and Forecast - by Deployment Type
- 9. Latin America Data Quality Tools Industry Analysis, Insights and Forecast, 2019-2031
- 9.1. Market Analysis, Insights and Forecast - by Deployment Type
- 9.1.1. Cloud-based
- 9.1.2. On Premise
- 9.2. Market Analysis, Insights and Forecast - by Size of the Organization
- 9.2.1. Small and Medium Enterprises
- 9.2.2. Large Enterprises
- 9.3. Market Analysis, Insights and Forecast - by Component
- 9.3.1. Software
- 9.3.2. Services
- 9.4. Market Analysis, Insights and Forecast - by End-user Vertical
- 9.4.1. BFSI
- 9.4.2. Government
- 9.4.3. IT & Telecom
- 9.4.4. Retail and E-commerce
- 9.4.5. Healthcare
- 9.4.6. Other End-user Industries
- 9.1. Market Analysis, Insights and Forecast - by Deployment Type
- 10. Middle East and Africa Data Quality Tools Industry Analysis, Insights and Forecast, 2019-2031
- 10.1. Market Analysis, Insights and Forecast - by Deployment Type
- 10.1.1. Cloud-based
- 10.1.2. On Premise
- 10.2. Market Analysis, Insights and Forecast - by Size of the Organization
- 10.2.1. Small and Medium Enterprises
- 10.2.2. Large Enterprises
- 10.3. Market Analysis, Insights and Forecast - by Component
- 10.3.1. Software
- 10.3.2. Services
- 10.4. Market Analysis, Insights and Forecast - by End-user Vertical
- 10.4.1. BFSI
- 10.4.2. Government
- 10.4.3. IT & Telecom
- 10.4.4. Retail and E-commerce
- 10.4.5. Healthcare
- 10.4.6. Other End-user Industries
- 10.1. Market Analysis, Insights and Forecast - by Deployment Type
- 11. North America Data Quality Tools Industry Analysis, Insights and Forecast, 2019-2031
- 11.1. Market Analysis, Insights and Forecast - By Country/Sub-region
- 11.1.1 United States
- 11.1.2 Canada
- 11.1.3 Mexico
- 12. Europe Data Quality Tools Industry Analysis, Insights and Forecast, 2019-2031
- 12.1. Market Analysis, Insights and Forecast - By Country/Sub-region
- 12.1.1 Germany
- 12.1.2 United Kingdom
- 12.1.3 France
- 12.1.4 Spain
- 12.1.5 Italy
- 12.1.6 Spain
- 12.1.7 Belgium
- 12.1.8 Netherland
- 12.1.9 Nordics
- 12.1.10 Rest of Europe
- 13. Asia Pacific Data Quality Tools Industry Analysis, Insights and Forecast, 2019-2031
- 13.1. Market Analysis, Insights and Forecast - By Country/Sub-region
- 13.1.1 China
- 13.1.2 Japan
- 13.1.3 India
- 13.1.4 South Korea
- 13.1.5 Southeast Asia
- 13.1.6 Australia
- 13.1.7 Indonesia
- 13.1.8 Phillipes
- 13.1.9 Singapore
- 13.1.10 Thailandc
- 13.1.11 Rest of Asia Pacific
- 14. South America Data Quality Tools Industry Analysis, Insights and Forecast, 2019-2031
- 14.1. Market Analysis, Insights and Forecast - By Country/Sub-region
- 14.1.1 Brazil
- 14.1.2 Argentina
- 14.1.3 Peru
- 14.1.4 Chile
- 14.1.5 Colombia
- 14.1.6 Ecuador
- 14.1.7 Venezuela
- 14.1.8 Rest of South America
- 15. North America Data Quality Tools Industry Analysis, Insights and Forecast, 2019-2031
- 15.1. Market Analysis, Insights and Forecast - By Country/Sub-region
- 15.1.1 United States
- 15.1.2 Canada
- 15.1.3 Mexico
- 16. MEA Data Quality Tools Industry Analysis, Insights and Forecast, 2019-2031
- 16.1. Market Analysis, Insights and Forecast - By Country/Sub-region
- 16.1.1 United Arab Emirates
- 16.1.2 Saudi Arabia
- 16.1.3 South Africa
- 16.1.4 Rest of Middle East and Africa
- 17. Competitive Analysis
- 17.1. Global Market Share Analysis 2024
- 17.2. Company Profiles
- 17.2.1 SAS Institute Inc
- 17.2.1.1. Overview
- 17.2.1.2. Products
- 17.2.1.3. SWOT Analysis
- 17.2.1.4. Recent Developments
- 17.2.1.5. Financials (Based on Availability)
- 17.2.2 Ataccama Corporatio
- 17.2.2.1. Overview
- 17.2.2.2. Products
- 17.2.2.3. SWOT Analysis
- 17.2.2.4. Recent Developments
- 17.2.2.5. Financials (Based on Availability)
- 17.2.3 Experian PLC
- 17.2.3.1. Overview
- 17.2.3.2. Products
- 17.2.3.3. SWOT Analysis
- 17.2.3.4. Recent Developments
- 17.2.3.5. Financials (Based on Availability)
- 17.2.4 IBM Corporation
- 17.2.4.1. Overview
- 17.2.4.2. Products
- 17.2.4.3. SWOT Analysis
- 17.2.4.4. Recent Developments
- 17.2.4.5. Financials (Based on Availability)
- 17.2.5 Pitney Bowes Inc
- 17.2.5.1. Overview
- 17.2.5.2. Products
- 17.2.5.3. SWOT Analysis
- 17.2.5.4. Recent Developments
- 17.2.5.5. Financials (Based on Availability)
- 17.2.6 Information Builders Inc
- 17.2.6.1. Overview
- 17.2.6.2. Products
- 17.2.6.3. SWOT Analysis
- 17.2.6.4. Recent Developments
- 17.2.6.5. Financials (Based on Availability)
- 17.2.7 Syncsort Inc
- 17.2.7.1. Overview
- 17.2.7.2. Products
- 17.2.7.3. SWOT Analysis
- 17.2.7.4. Recent Developments
- 17.2.7.5. Financials (Based on Availability)
- 17.2.8 Oracle Corporation
- 17.2.8.1. Overview
- 17.2.8.2. Products
- 17.2.8.3. SWOT Analysis
- 17.2.8.4. Recent Developments
- 17.2.8.5. Financials (Based on Availability)
- 17.2.9 Informatica LLC
- 17.2.9.1. Overview
- 17.2.9.2. Products
- 17.2.9.3. SWOT Analysis
- 17.2.9.4. Recent Developments
- 17.2.9.5. Financials (Based on Availability)
- 17.2.10 Talend Inc
- 17.2.10.1. Overview
- 17.2.10.2. Products
- 17.2.10.3. SWOT Analysis
- 17.2.10.4. Recent Developments
- 17.2.10.5. Financials (Based on Availability)
- 17.2.11 SAP SE
- 17.2.11.1. Overview
- 17.2.11.2. Products
- 17.2.11.3. SWOT Analysis
- 17.2.11.4. Recent Developments
- 17.2.11.5. Financials (Based on Availability)
- 17.2.1 SAS Institute Inc
List of Figures
- Figure 1: Global Data Quality Tools Industry Revenue Breakdown (Million, %) by Region 2024 & 2032
- Figure 2: North America Data Quality Tools Industry Revenue (Million), by Country 2024 & 2032
- Figure 3: North America Data Quality Tools Industry Revenue Share (%), by Country 2024 & 2032
- Figure 4: Europe Data Quality Tools Industry Revenue (Million), by Country 2024 & 2032
- Figure 5: Europe Data Quality Tools Industry Revenue Share (%), by Country 2024 & 2032
- Figure 6: Asia Pacific Data Quality Tools Industry Revenue (Million), by Country 2024 & 2032
- Figure 7: Asia Pacific Data Quality Tools Industry Revenue Share (%), by Country 2024 & 2032
- Figure 8: South America Data Quality Tools Industry Revenue (Million), by Country 2024 & 2032
- Figure 9: South America Data Quality Tools Industry Revenue Share (%), by Country 2024 & 2032
- Figure 10: North America Data Quality Tools Industry Revenue (Million), by Country 2024 & 2032
- Figure 11: North America Data Quality Tools Industry Revenue Share (%), by Country 2024 & 2032
- Figure 12: MEA Data Quality Tools Industry Revenue (Million), by Country 2024 & 2032
- Figure 13: MEA Data Quality Tools Industry Revenue Share (%), by Country 2024 & 2032
- Figure 14: North America Data Quality Tools Industry Revenue (Million), by Deployment Type 2024 & 2032
- Figure 15: North America Data Quality Tools Industry Revenue Share (%), by Deployment Type 2024 & 2032
- Figure 16: North America Data Quality Tools Industry Revenue (Million), by Size of the Organization 2024 & 2032
- Figure 17: North America Data Quality Tools Industry Revenue Share (%), by Size of the Organization 2024 & 2032
- Figure 18: North America Data Quality Tools Industry Revenue (Million), by Component 2024 & 2032
- Figure 19: North America Data Quality Tools Industry Revenue Share (%), by Component 2024 & 2032
- Figure 20: North America Data Quality Tools Industry Revenue (Million), by End-user Vertical 2024 & 2032
- Figure 21: North America Data Quality Tools Industry Revenue Share (%), by End-user Vertical 2024 & 2032
- Figure 22: North America Data Quality Tools Industry Revenue (Million), by Country 2024 & 2032
- Figure 23: North America Data Quality Tools Industry Revenue Share (%), by Country 2024 & 2032
- Figure 24: Europe Data Quality Tools Industry Revenue (Million), by Deployment Type 2024 & 2032
- Figure 25: Europe Data Quality Tools Industry Revenue Share (%), by Deployment Type 2024 & 2032
- Figure 26: Europe Data Quality Tools Industry Revenue (Million), by Size of the Organization 2024 & 2032
- Figure 27: Europe Data Quality Tools Industry Revenue Share (%), by Size of the Organization 2024 & 2032
- Figure 28: Europe Data Quality Tools Industry Revenue (Million), by Component 2024 & 2032
- Figure 29: Europe Data Quality Tools Industry Revenue Share (%), by Component 2024 & 2032
- Figure 30: Europe Data Quality Tools Industry Revenue (Million), by End-user Vertical 2024 & 2032
- Figure 31: Europe Data Quality Tools Industry Revenue Share (%), by End-user Vertical 2024 & 2032
- Figure 32: Europe Data Quality Tools Industry Revenue (Million), by Country 2024 & 2032
- Figure 33: Europe Data Quality Tools Industry Revenue Share (%), by Country 2024 & 2032
- Figure 34: Asia Pacific Data Quality Tools Industry Revenue (Million), by Deployment Type 2024 & 2032
- Figure 35: Asia Pacific Data Quality Tools Industry Revenue Share (%), by Deployment Type 2024 & 2032
- Figure 36: Asia Pacific Data Quality Tools Industry Revenue (Million), by Size of the Organization 2024 & 2032
- Figure 37: Asia Pacific Data Quality Tools Industry Revenue Share (%), by Size of the Organization 2024 & 2032
- Figure 38: Asia Pacific Data Quality Tools Industry Revenue (Million), by Component 2024 & 2032
- Figure 39: Asia Pacific Data Quality Tools Industry Revenue Share (%), by Component 2024 & 2032
- Figure 40: Asia Pacific Data Quality Tools Industry Revenue (Million), by End-user Vertical 2024 & 2032
- Figure 41: Asia Pacific Data Quality Tools Industry Revenue Share (%), by End-user Vertical 2024 & 2032
- Figure 42: Asia Pacific Data Quality Tools Industry Revenue (Million), by Country 2024 & 2032
- Figure 43: Asia Pacific Data Quality Tools Industry Revenue Share (%), by Country 2024 & 2032
- Figure 44: Latin America Data Quality Tools Industry Revenue (Million), by Deployment Type 2024 & 2032
- Figure 45: Latin America Data Quality Tools Industry Revenue Share (%), by Deployment Type 2024 & 2032
- Figure 46: Latin America Data Quality Tools Industry Revenue (Million), by Size of the Organization 2024 & 2032
- Figure 47: Latin America Data Quality Tools Industry Revenue Share (%), by Size of the Organization 2024 & 2032
- Figure 48: Latin America Data Quality Tools Industry Revenue (Million), by Component 2024 & 2032
- Figure 49: Latin America Data Quality Tools Industry Revenue Share (%), by Component 2024 & 2032
- Figure 50: Latin America Data Quality Tools Industry Revenue (Million), by End-user Vertical 2024 & 2032
- Figure 51: Latin America Data Quality Tools Industry Revenue Share (%), by End-user Vertical 2024 & 2032
- Figure 52: Latin America Data Quality Tools Industry Revenue (Million), by Country 2024 & 2032
- Figure 53: Latin America Data Quality Tools Industry Revenue Share (%), by Country 2024 & 2032
- Figure 54: Middle East and Africa Data Quality Tools Industry Revenue (Million), by Deployment Type 2024 & 2032
- Figure 55: Middle East and Africa Data Quality Tools Industry Revenue Share (%), by Deployment Type 2024 & 2032
- Figure 56: Middle East and Africa Data Quality Tools Industry Revenue (Million), by Size of the Organization 2024 & 2032
- Figure 57: Middle East and Africa Data Quality Tools Industry Revenue Share (%), by Size of the Organization 2024 & 2032
- Figure 58: Middle East and Africa Data Quality Tools Industry Revenue (Million), by Component 2024 & 2032
- Figure 59: Middle East and Africa Data Quality Tools Industry Revenue Share (%), by Component 2024 & 2032
- Figure 60: Middle East and Africa Data Quality Tools Industry Revenue (Million), by End-user Vertical 2024 & 2032
- Figure 61: Middle East and Africa Data Quality Tools Industry Revenue Share (%), by End-user Vertical 2024 & 2032
- Figure 62: Middle East and Africa Data Quality Tools Industry Revenue (Million), by Country 2024 & 2032
- Figure 63: Middle East and Africa Data Quality Tools Industry Revenue Share (%), by Country 2024 & 2032
List of Tables
- Table 1: Global Data Quality Tools Industry Revenue Million Forecast, by Region 2019 & 2032
- Table 2: Global Data Quality Tools Industry Revenue Million Forecast, by Deployment Type 2019 & 2032
- Table 3: Global Data Quality Tools Industry Revenue Million Forecast, by Size of the Organization 2019 & 2032
- Table 4: Global Data Quality Tools Industry Revenue Million Forecast, by Component 2019 & 2032
- Table 5: Global Data Quality Tools Industry Revenue Million Forecast, by End-user Vertical 2019 & 2032
- Table 6: Global Data Quality Tools Industry Revenue Million Forecast, by Region 2019 & 2032
- Table 7: Global Data Quality Tools Industry Revenue Million Forecast, by Country 2019 & 2032
- Table 8: United States Data Quality Tools Industry Revenue (Million) Forecast, by Application 2019 & 2032
- Table 9: Canada Data Quality Tools Industry Revenue (Million) Forecast, by Application 2019 & 2032
- Table 10: Mexico Data Quality Tools Industry Revenue (Million) Forecast, by Application 2019 & 2032
- Table 11: Global Data Quality Tools Industry Revenue Million Forecast, by Country 2019 & 2032
- Table 12: Germany Data Quality Tools Industry Revenue (Million) Forecast, by Application 2019 & 2032
- Table 13: United Kingdom Data Quality Tools Industry Revenue (Million) Forecast, by Application 2019 & 2032
- Table 14: France Data Quality Tools Industry Revenue (Million) Forecast, by Application 2019 & 2032
- Table 15: Spain Data Quality Tools Industry Revenue (Million) Forecast, by Application 2019 & 2032
- Table 16: Italy Data Quality Tools Industry Revenue (Million) Forecast, by Application 2019 & 2032
- Table 17: Spain Data Quality Tools Industry Revenue (Million) Forecast, by Application 2019 & 2032
- Table 18: Belgium Data Quality Tools Industry Revenue (Million) Forecast, by Application 2019 & 2032
- Table 19: Netherland Data Quality Tools Industry Revenue (Million) Forecast, by Application 2019 & 2032
- Table 20: Nordics Data Quality Tools Industry Revenue (Million) Forecast, by Application 2019 & 2032
- Table 21: Rest of Europe Data Quality Tools Industry Revenue (Million) Forecast, by Application 2019 & 2032
- Table 22: Global Data Quality Tools Industry Revenue Million Forecast, by Country 2019 & 2032
- Table 23: China Data Quality Tools Industry Revenue (Million) Forecast, by Application 2019 & 2032
- Table 24: Japan Data Quality Tools Industry Revenue (Million) Forecast, by Application 2019 & 2032
- Table 25: India Data Quality Tools Industry Revenue (Million) Forecast, by Application 2019 & 2032
- Table 26: South Korea Data Quality Tools Industry Revenue (Million) Forecast, by Application 2019 & 2032
- Table 27: Southeast Asia Data Quality Tools Industry Revenue (Million) Forecast, by Application 2019 & 2032
- Table 28: Australia Data Quality Tools Industry Revenue (Million) Forecast, by Application 2019 & 2032
- Table 29: Indonesia Data Quality Tools Industry Revenue (Million) Forecast, by Application 2019 & 2032
- Table 30: Phillipes Data Quality Tools Industry Revenue (Million) Forecast, by Application 2019 & 2032
- Table 31: Singapore Data Quality Tools Industry Revenue (Million) Forecast, by Application 2019 & 2032
- Table 32: Thailandc Data Quality Tools Industry Revenue (Million) Forecast, by Application 2019 & 2032
- Table 33: Rest of Asia Pacific Data Quality Tools Industry Revenue (Million) Forecast, by Application 2019 & 2032
- Table 34: Global Data Quality Tools Industry Revenue Million Forecast, by Country 2019 & 2032
- Table 35: Brazil Data Quality Tools Industry Revenue (Million) Forecast, by Application 2019 & 2032
- Table 36: Argentina Data Quality Tools Industry Revenue (Million) Forecast, by Application 2019 & 2032
- Table 37: Peru Data Quality Tools Industry Revenue (Million) Forecast, by Application 2019 & 2032
- Table 38: Chile Data Quality Tools Industry Revenue (Million) Forecast, by Application 2019 & 2032
- Table 39: Colombia Data Quality Tools Industry Revenue (Million) Forecast, by Application 2019 & 2032
- Table 40: Ecuador Data Quality Tools Industry Revenue (Million) Forecast, by Application 2019 & 2032
- Table 41: Venezuela Data Quality Tools Industry Revenue (Million) Forecast, by Application 2019 & 2032
- Table 42: Rest of South America Data Quality Tools Industry Revenue (Million) Forecast, by Application 2019 & 2032
- Table 43: Global Data Quality Tools Industry Revenue Million Forecast, by Country 2019 & 2032
- Table 44: United States Data Quality Tools Industry Revenue (Million) Forecast, by Application 2019 & 2032
- Table 45: Canada Data Quality Tools Industry Revenue (Million) Forecast, by Application 2019 & 2032
- Table 46: Mexico Data Quality Tools Industry Revenue (Million) Forecast, by Application 2019 & 2032
- Table 47: Global Data Quality Tools Industry Revenue Million Forecast, by Country 2019 & 2032
- Table 48: United Arab Emirates Data Quality Tools Industry Revenue (Million) Forecast, by Application 2019 & 2032
- Table 49: Saudi Arabia Data Quality Tools Industry Revenue (Million) Forecast, by Application 2019 & 2032
- Table 50: South Africa Data Quality Tools Industry Revenue (Million) Forecast, by Application 2019 & 2032
- Table 51: Rest of Middle East and Africa Data Quality Tools Industry Revenue (Million) Forecast, by Application 2019 & 2032
- Table 52: Global Data Quality Tools Industry Revenue Million Forecast, by Deployment Type 2019 & 2032
- Table 53: Global Data Quality Tools Industry Revenue Million Forecast, by Size of the Organization 2019 & 2032
- Table 54: Global Data Quality Tools Industry Revenue Million Forecast, by Component 2019 & 2032
- Table 55: Global Data Quality Tools Industry Revenue Million Forecast, by End-user Vertical 2019 & 2032
- Table 56: Global Data Quality Tools Industry Revenue Million Forecast, by Country 2019 & 2032
- Table 57: Global Data Quality Tools Industry Revenue Million Forecast, by Deployment Type 2019 & 2032
- Table 58: Global Data Quality Tools Industry Revenue Million Forecast, by Size of the Organization 2019 & 2032
- Table 59: Global Data Quality Tools Industry Revenue Million Forecast, by Component 2019 & 2032
- Table 60: Global Data Quality Tools Industry Revenue Million Forecast, by End-user Vertical 2019 & 2032
- Table 61: Global Data Quality Tools Industry Revenue Million Forecast, by Country 2019 & 2032
- Table 62: Global Data Quality Tools Industry Revenue Million Forecast, by Deployment Type 2019 & 2032
- Table 63: Global Data Quality Tools Industry Revenue Million Forecast, by Size of the Organization 2019 & 2032
- Table 64: Global Data Quality Tools Industry Revenue Million Forecast, by Component 2019 & 2032
- Table 65: Global Data Quality Tools Industry Revenue Million Forecast, by End-user Vertical 2019 & 2032
- Table 66: Global Data Quality Tools Industry Revenue Million Forecast, by Country 2019 & 2032
- Table 67: Global Data Quality Tools Industry Revenue Million Forecast, by Deployment Type 2019 & 2032
- Table 68: Global Data Quality Tools Industry Revenue Million Forecast, by Size of the Organization 2019 & 2032
- Table 69: Global Data Quality Tools Industry Revenue Million Forecast, by Component 2019 & 2032
- Table 70: Global Data Quality Tools Industry Revenue Million Forecast, by End-user Vertical 2019 & 2032
- Table 71: Global Data Quality Tools Industry Revenue Million Forecast, by Country 2019 & 2032
- Table 72: Global Data Quality Tools Industry Revenue Million Forecast, by Deployment Type 2019 & 2032
- Table 73: Global Data Quality Tools Industry Revenue Million Forecast, by Size of the Organization 2019 & 2032
- Table 74: Global Data Quality Tools Industry Revenue Million Forecast, by Component 2019 & 2032
- Table 75: Global Data Quality Tools Industry Revenue Million Forecast, by End-user Vertical 2019 & 2032
- Table 76: Global Data Quality Tools Industry Revenue Million Forecast, by Country 2019 & 2032
Frequently Asked Questions
1. What is the projected Compound Annual Growth Rate (CAGR) of the Data Quality Tools Industry?
The projected CAGR is approximately 17.50%.
2. Which companies are prominent players in the Data Quality Tools Industry?
Key companies in the market include SAS Institute Inc, Ataccama Corporatio, Experian PLC, IBM Corporation, Pitney Bowes Inc, Information Builders Inc, Syncsort Inc, Oracle Corporation, Informatica LLC, Talend Inc, SAP SE.
3. What are the main segments of the Data Quality Tools Industry?
The market segments include Deployment Type, Size of the Organization, Component, End-user Vertical.
4. Can you provide details about the market size?
The market size is estimated to be USD XX Million as of 2022.
5. What are some drivers contributing to market growth?
Increasing Use of External Data Sources Owing to Mobile Connectivity Growth.
6. What are the notable trends driving market growth?
Healthcare is Expected to Witness Significant Growth.
7. Are there any restraints impacting market growth?
Lack of information and Awareness about the Solutions Among Potential Users.
8. Can you provide examples of recent developments in the market?
September 2022: MIT Computer Science and Artificial Intelligence Laboratory (CSAIL) spin-off DataCebo announced the launch of a new tool, dubbed Synthetic Data (SD) Metrics, to help enterprises compare the quality of machine-generated synthetic data by pitching it against real data sets.
9. What pricing options are available for accessing the report?
Pricing options include single-user, multi-user, and enterprise licenses priced at USD 4750, USD 5250, and USD 8750 respectively.
10. Is the market size provided in terms of value or volume?
The market size is provided in terms of value, measured in Million.
11. Are there any specific market keywords associated with the report?
Yes, the market keyword associated with the report is "Data Quality Tools Industry," which aids in identifying and referencing the specific market segment covered.
12. How do I determine which pricing option suits my needs best?
The pricing options vary based on user requirements and access needs. Individual users may opt for single-user licenses, while businesses requiring broader access may choose multi-user or enterprise licenses for cost-effective access to the report.
13. Are there any additional resources or data provided in the Data Quality Tools Industry report?
While the report offers comprehensive insights, it's advisable to review the specific contents or supplementary materials provided to ascertain if additional resources or data are available.
14. How can I stay updated on further developments or reports in the Data Quality Tools Industry?
To stay informed about further developments, trends, and reports in the Data Quality Tools Industry, consider subscribing to industry newsletters, following relevant companies and organizations, or regularly checking reputable industry news sources and publications.
Methodology
Step 1 - Identification of Relevant Samples Size from Population Database


Step 2 - Approaches for Defining Global Market Size (Value, Volume* & Price*)

Note*: In applicable scenarios
Step 3 - Data Sources
Primary Research
- Web Analytics
- Survey Reports
- Research Institute
- Latest Research Reports
- Opinion Leaders
Secondary Research
- Annual Reports
- White Paper
- Latest Press Release
- Industry Association
- Paid Database
- Investor Presentations

Step 4 - Data Triangulation
Involves using different sources of information in order to increase the validity of a study
These sources are likely to be stakeholders in a program - participants, other researchers, program staff, other community members, and so on.
Then we put all data in single framework & apply various statistical tools to find out the dynamic on the market.
During the analysis stage, feedback from the stakeholder groups would be compared to determine areas of agreement as well as areas of divergence
