

Key Insights
The global Dental Delivery Systems market is poised for robust expansion, projected to reach $1.64 billion in 2025 and grow at a Compound Annual Growth Rate (CAGR) of 7.4% through 2033. This significant growth is fueled by a confluence of factors, including the increasing demand for advanced dental care, a rising prevalence of oral diseases worldwide, and a growing awareness among the general population regarding oral hygiene. The market is witnessing a strong push towards technologically advanced solutions that enhance efficiency and patient comfort in dental practices. Key market drivers include the increasing adoption of digital dentistry technologies, which are integrating seamlessly with dental delivery systems, and the rising disposable incomes in emerging economies, enabling greater investment in high-quality dental equipment. Furthermore, government initiatives and private sector investments aimed at improving healthcare infrastructure, particularly in developing regions, are also contributing to the market's upward trajectory. The ongoing evolution of dental treatment methodologies, coupled with the increasing patient preference for minimally invasive procedures, further bolsters the demand for sophisticated and versatile dental delivery systems.
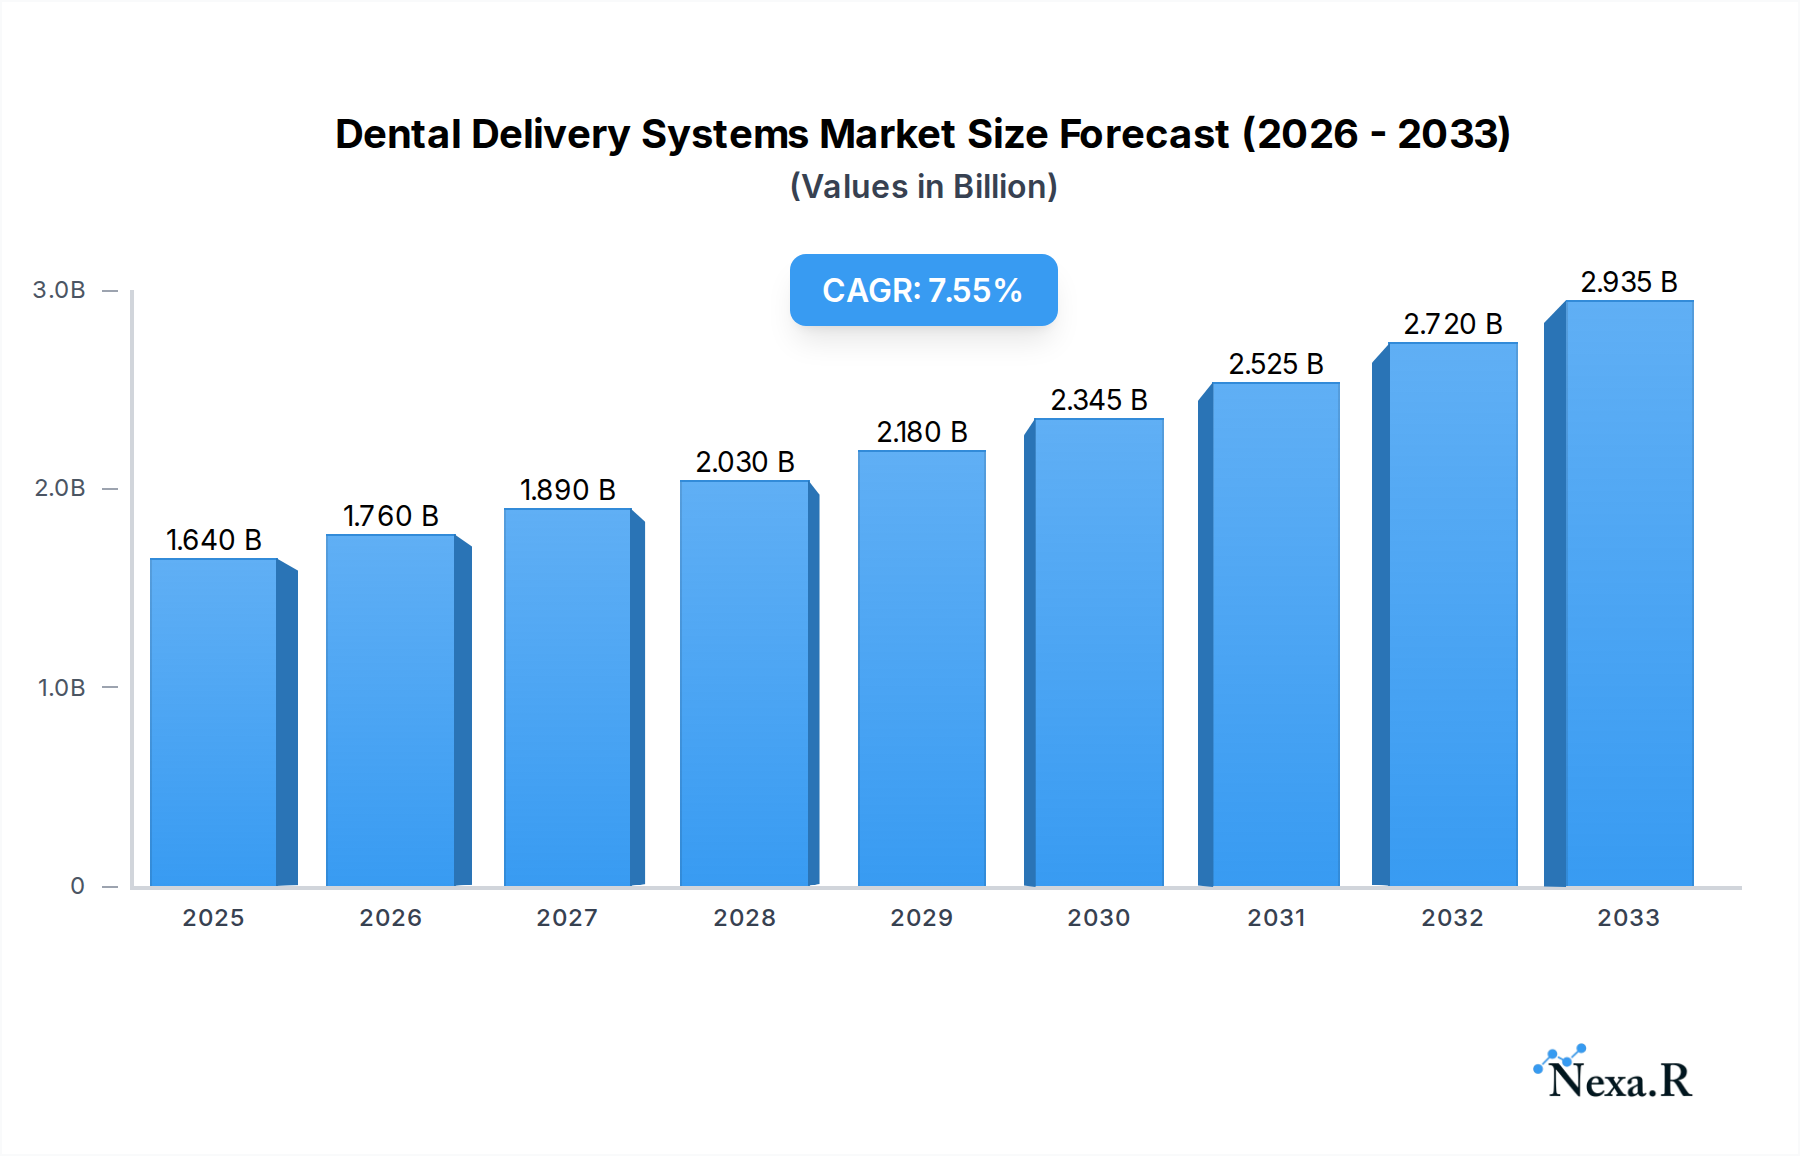
Dental Delivery Systems Market Size (In Billion)
The market segmentation reveals a dynamic landscape, with the "Hospital" application segment expected to dominate due to the comprehensive range of dental services offered in hospital settings. However, "Clinics" are also showing substantial growth, driven by the proliferation of specialized dental clinics and the increasing focus on outpatient dental care. In terms of product types, "Mobile Dental Delivery Systems" are gaining traction, offering flexibility and accessibility, particularly in remote areas or for outreach programs. "Chairside Dental Delivery Systems" continue to be a staple, providing integrated solutions for direct patient treatment. The market is characterized by a competitive environment with numerous established and emerging players, including AIREL - QUETIN, ANCAR, ASEPTICO, and Midmark, among others, all vying for market share through innovation and strategic partnerships. Regional analysis indicates that North America and Europe currently hold significant market shares, owing to well-established healthcare infrastructures and high adoption rates of advanced dental technologies. However, the Asia Pacific region is anticipated to exhibit the fastest growth, propelled by a large patient pool, increasing healthcare expenditure, and rapid technological advancements in dentistry.

Dental Delivery Systems Company Market Share
This comprehensive report, "Global Dental Delivery Systems Market: Size, Share, Trends, and Forecast 2025-2033," offers an in-depth analysis of the dental delivery systems industry. It covers market dynamics, growth trends, regional dominance, product landscape, key drivers, barriers, challenges, emerging opportunities, growth accelerators, key players, notable milestones, and a detailed market outlook. The report is structured to provide actionable insights for stakeholders, including manufacturers, suppliers, distributors, dental professionals, and investors. We delve into the parent market of dental equipment and the child market of dental delivery systems, providing a holistic view of the industry's trajectory.
Dental Delivery Systems Market Dynamics & Structure
The global dental delivery systems market is characterized by a moderately concentrated structure, with a few key players holding significant market share. Technological innovation is a primary driver, fueled by advancements in digital dentistry, miniaturization, and ergonomic design. Regulatory frameworks, such as those from the FDA and CE marking, play a crucial role in ensuring product safety and efficacy, influencing market entry and product development. Competitive product substitutes, including traditional dental chairs with integrated units, present a dynamic competitive landscape. End-user demographics, particularly the increasing demand for minimally invasive procedures and aesthetic dentistry, are shaping product demand. Mergers and acquisitions (M&A) are a notable trend, with companies consolidating to expand product portfolios, geographical reach, and technological capabilities. For instance, recent M&A activity has seen larger conglomerates acquiring specialized dental equipment manufacturers, leading to an estimated 7 M&A deals in the historical period (2019-2024) to consolidate market power. Innovation barriers include the high cost of R&D, stringent regulatory approvals, and the need for extensive clinical validation.
Dental Delivery Systems Growth Trends & Insights
The global dental delivery systems market is projected to witness robust growth over the forecast period (2025–2033). The market size is estimated to reach $5.2 billion in 2025 and is expected to grow at a Compound Annual Growth Rate (CAGR) of 6.8% to reach $8.9 billion by 2033. Adoption rates are steadily increasing, driven by the growing awareness of oral hygiene and the demand for advanced dental treatments. Technological disruptions, such as the integration of AI-powered diagnostic tools and 3D printing capabilities within dental delivery systems, are revolutionizing patient care and workflow efficiency. Consumer behavior shifts, including a preference for comfortable and efficient dental experiences, are pushing manufacturers to develop more user-friendly and technologically advanced systems. The increasing prevalence of dental diseases globally, coupled with a rising geriatric population that often requires more complex dental care, further propels market growth. The shift towards preventive dentistry and the growing emphasis on aesthetic dental procedures are also significant contributors. The market penetration of advanced dental delivery systems in emerging economies is expected to accelerate, driven by improving healthcare infrastructure and increasing disposable incomes. The parent market of dental equipment, valued at approximately $35.5 billion in 2025, provides a strong foundation for the growth of specialized segments like dental delivery systems. The child market of dental delivery systems is thus set to capture a significant portion of this expanding dental care expenditure.
Dominant Regions, Countries, or Segments in Dental Delivery Systems
North America currently holds a dominant position in the global dental delivery systems market, driven by a well-established healthcare infrastructure, high disposable incomes, and a strong emphasis on advanced dental care. The United States, in particular, accounts for a substantial market share due to the high prevalence of dental practices and the early adoption of innovative dental technologies. Clinics represent the largest application segment within this region, accounting for an estimated 65% of the total market share in 2025, reflecting the high density of dental practices. Chairside Dental Delivery Systems are the most dominant type, comprising approximately 55% of the market share in 2025, owing to their direct utility in patient treatment. Key drivers for North America's dominance include favorable economic policies supporting healthcare innovation, robust government funding for research and development, and advanced healthcare infrastructure that facilitates the widespread adoption of cutting-edge dental equipment. The region also benefits from a highly educated dental professional workforce and a proactive approach to adopting new technologies. The market in North America is valued at approximately $1.8 billion in 2025.
The Asia Pacific region is poised to be the fastest-growing market for dental delivery systems. This growth is fueled by increasing investments in healthcare infrastructure, a rapidly expanding middle class with rising disposable incomes, and a growing awareness of oral health. Countries like China and India are significant contributors to this growth, with a substantial unmet demand for quality dental care. Clinics are also the leading application segment in this region, projected to hold around 60% of the market share in 2025. Chairside Dental Delivery Systems are expected to maintain their dominance, with an estimated 50% market share in 2025. Key growth drivers in Asia Pacific include supportive government initiatives to improve healthcare access, a burgeoning dental tourism sector in countries like Thailand and India, and the increasing presence of global dental equipment manufacturers establishing their presence in the region. The market in Asia Pacific is estimated to be $1.2 billion in 2025 and is projected to grow at a CAGR of 7.5%.
Europe also represents a significant market for dental delivery systems, with strong demand driven by an aging population, high healthcare standards, and a robust reimbursement system for dental treatments. Germany, the UK, and France are key markets within this region. Clinics are the leading application, holding approximately 62% of the market share in 2025, and Chairside Dental Delivery Systems are the dominant type, with an estimated 53% market share in 2025.
Dental Delivery Systems Product Landscape
The dental delivery systems product landscape is characterized by continuous innovation, focusing on enhancing efficiency, ergonomics, and patient comfort. Innovations include advanced suction technologies, integrated multimedia displays, and modular designs for easy customization and maintenance. Product performance metrics emphasize precision, durability, and hygiene. Unique selling propositions often revolve around integrated sterilization solutions, compact footprints for smaller clinics, and sophisticated control panels offering intuitive operation. Technological advancements are leading to the development of smart dental delivery systems that can integrate with practice management software, providing real-time data on usage and maintenance needs.
Key Drivers, Barriers & Challenges in Dental Delivery Systems
Key Drivers:
- Increasing prevalence of dental diseases: Rising incidences of cavities, periodontal diseases, and oral cancers globally drive the demand for advanced dental treatment solutions.
- Technological advancements: Integration of digital dentistry tools, AI, and robotics enhances procedural accuracy and efficiency.
- Growing demand for aesthetic dentistry: The surge in cosmetic dental procedures necessitates specialized and advanced delivery systems.
- Aging population: Geriatric individuals often require more complex dental care, boosting the demand for versatile delivery systems.
- Rising disposable incomes: Increased purchasing power, especially in emerging economies, allows for greater investment in advanced dental care.
Barriers & Challenges:
- High initial investment cost: The significant capital outlay for advanced dental delivery systems can be a deterrent for smaller practices and clinics in developing regions. This can lead to a market penetration of only 30% in some lower-income countries.
- Stringent regulatory requirements: Compliance with global health and safety standards can be time-consuming and expensive, especially for new entrants.
- Lack of skilled professionals: Operating and maintaining complex dental delivery systems requires trained personnel, which can be a challenge in certain markets.
- Supply chain disruptions: Global events can impact the availability of raw materials and components, leading to production delays and increased costs. The estimated impact of supply chain disruptions on manufacturing costs has been a 15% increase in the historical period.
- Intense competition: The market is crowded with established players and new entrants, leading to price pressures and the need for continuous innovation.
Emerging Opportunities in Dental Delivery Systems
Emerging opportunities lie in the development of highly portable and compact dental delivery systems for remote and underserved areas, such as mobile dental clinics and dental camps. The integration of telemedicine capabilities within delivery systems, allowing for remote consultation and diagnostics, presents another significant avenue for growth. Furthermore, the increasing focus on personalized medicine in dentistry opens doors for customizable delivery systems tailored to individual patient needs and specific treatment protocols. The growing trend of dental practices offering a broader range of services beyond general dentistry, including orthodontics and implantology, will drive demand for versatile and multi-functional delivery systems.
Growth Accelerators in the Dental Delivery Systems Industry
Technological breakthroughs in material science are enabling the creation of lighter, more durable, and more hygienic dental delivery systems. Strategic partnerships between dental equipment manufacturers and software developers are crucial for integrating advanced digital solutions. Market expansion strategies targeting emerging economies with growing healthcare expenditure and a rising demand for quality dental care are key growth accelerators. The increasing adoption of subscription-based models for dental equipment can also lower the barrier to entry for smaller practices, thereby accelerating market growth. The development of smart dental chairs with integrated diagnostics and treatment planning capabilities is another significant catalyst.
Key Players Shaping the Dental Delivery Systems Market
- AIREL - QUETIN
- ANCAR
- ASEPTICO
- Best Dent Equipment
- BPR Swiss
- CHIROMEGA
- D.B.I. AMERICA
- Dansereau Dental Equipment
- DentalEZ Group
- Dentflex
- ETI Dental Industries
- Fedesa
- Flight Dental Systems
- GALBIATI
- Galit
- Medidenta
- Midmark
- Miglionico
- Navadha Enterprises
- NSK
- Olsen
- Pelton & Crane
- Ritter Concept
- Safari Dental
- Summit Dental Systems
- Tenko Medical Systems
- TPC
- VITALI
- Zakton
- ZIL FOR
Notable Milestones in Dental Delivery Systems Sector
- 2019: Introduction of AI-powered diagnostic integration in select high-end dental delivery systems, enhancing treatment planning.
- 2020: Significant increase in demand for mobile dental delivery units due to the global pandemic, enabling remote patient care.
- 2021: Development of advanced antimicrobial materials for dental delivery system surfaces to improve infection control.
- 2022: Launch of modular dental delivery systems offering greater customization and easier maintenance for dental practices.
- 2023: Increased M&A activity as larger dental corporations aim to expand their product portfolios in the specialized delivery systems segment, with an estimated 4 significant deals.
- 2024: Emergence of smart dental delivery systems with IoT capabilities for remote monitoring and predictive maintenance.
In-Depth Dental Delivery Systems Market Outlook
The future outlook for the dental delivery systems market is highly promising, driven by a convergence of technological innovation, demographic shifts, and evolving healthcare demands. Growth accelerators such as the continuous integration of digital dentistry tools, including AI and augmented reality, will further enhance the efficiency and precision of dental procedures. Strategic partnerships between dental equipment manufacturers and digital health solution providers will be pivotal in creating integrated ecosystems that improve patient outcomes and practice management. Market expansion in emerging economies, fueled by increasing disposable incomes and a growing awareness of oral health, presents significant untapped potential. The ongoing emphasis on preventive care and minimally invasive treatments will continue to drive the demand for advanced and specialized dental delivery systems, solidifying the market's strong growth trajectory. The parent market of dental equipment is expected to grow to $45 billion by 2030, with dental delivery systems expected to capture 18% of this market, reaching $8.1 billion.
Dental Delivery Systems Segmentation
-
1. Application
- 1.1. Hospital
- 1.2. Clinics
- 1.3. Other
-
2. Types
- 2.1. Mobile Dental Delivery Systems
- 2.2. Chairside Dental Delivery Systems
- 2.3. Wall-mounted Dental Delivery Systems
- 2.4. Other
Dental Delivery Systems Segmentation By Geography
-
1. North America
- 1.1. United States
- 1.2. Canada
- 1.3. Mexico
-
2. South America
- 2.1. Brazil
- 2.2. Argentina
- 2.3. Rest of South America
-
3. Europe
- 3.1. United Kingdom
- 3.2. Germany
- 3.3. France
- 3.4. Italy
- 3.5. Spain
- 3.6. Russia
- 3.7. Benelux
- 3.8. Nordics
- 3.9. Rest of Europe
-
4. Middle East & Africa
- 4.1. Turkey
- 4.2. Israel
- 4.3. GCC
- 4.4. North Africa
- 4.5. South Africa
- 4.6. Rest of Middle East & Africa
-
5. Asia Pacific
- 5.1. China
- 5.2. India
- 5.3. Japan
- 5.4. South Korea
- 5.5. ASEAN
- 5.6. Oceania
- 5.7. Rest of Asia Pacific

Dental Delivery Systems Regional Market Share
Geographic Coverage of Dental Delivery Systems
Dental Delivery Systems REPORT HIGHLIGHTS
| Aspects | Details |
|---|---|
| Study Period | 2020-2034 |
| Base Year | 2025 |
| Estimated Year | 2026 |
| Forecast Period | 2026-2034 |
| Historical Period | 2020-2025 |
| Growth Rate | CAGR of 7.4% from 2020-2034 |
| Segmentation |
|
Table of Contents
- 1. Introduction
- 1.1. Research Scope
- 1.2. Market Segmentation
- 1.3. Research Methodology
- 1.4. Definitions and Assumptions
- 2. Executive Summary
- 2.1. Introduction
- 3. Market Dynamics
- 3.1. Introduction
- 3.2. Market Drivers
- 3.3. Market Restrains
- 3.4. Market Trends
- 4. Market Factor Analysis
- 4.1. Porters Five Forces
- 4.2. Supply/Value Chain
- 4.3. PESTEL analysis
- 4.4. Market Entropy
- 4.5. Patent/Trademark Analysis
- 5. Global Dental Delivery Systems Analysis, Insights and Forecast, 2020-2032
- 5.1. Market Analysis, Insights and Forecast - by Application
- 5.1.1. Hospital
- 5.1.2. Clinics
- 5.1.3. Other
- 5.2. Market Analysis, Insights and Forecast - by Types
- 5.2.1. Mobile Dental Delivery Systems
- 5.2.2. Chairside Dental Delivery Systems
- 5.2.3. Wall-mounted Dental Delivery Systems
- 5.2.4. Other
- 5.3. Market Analysis, Insights and Forecast - by Region
- 5.3.1. North America
- 5.3.2. South America
- 5.3.3. Europe
- 5.3.4. Middle East & Africa
- 5.3.5. Asia Pacific
- 5.1. Market Analysis, Insights and Forecast - by Application
- 6. North America Dental Delivery Systems Analysis, Insights and Forecast, 2020-2032
- 6.1. Market Analysis, Insights and Forecast - by Application
- 6.1.1. Hospital
- 6.1.2. Clinics
- 6.1.3. Other
- 6.2. Market Analysis, Insights and Forecast - by Types
- 6.2.1. Mobile Dental Delivery Systems
- 6.2.2. Chairside Dental Delivery Systems
- 6.2.3. Wall-mounted Dental Delivery Systems
- 6.2.4. Other
- 6.1. Market Analysis, Insights and Forecast - by Application
- 7. South America Dental Delivery Systems Analysis, Insights and Forecast, 2020-2032
- 7.1. Market Analysis, Insights and Forecast - by Application
- 7.1.1. Hospital
- 7.1.2. Clinics
- 7.1.3. Other
- 7.2. Market Analysis, Insights and Forecast - by Types
- 7.2.1. Mobile Dental Delivery Systems
- 7.2.2. Chairside Dental Delivery Systems
- 7.2.3. Wall-mounted Dental Delivery Systems
- 7.2.4. Other
- 7.1. Market Analysis, Insights and Forecast - by Application
- 8. Europe Dental Delivery Systems Analysis, Insights and Forecast, 2020-2032
- 8.1. Market Analysis, Insights and Forecast - by Application
- 8.1.1. Hospital
- 8.1.2. Clinics
- 8.1.3. Other
- 8.2. Market Analysis, Insights and Forecast - by Types
- 8.2.1. Mobile Dental Delivery Systems
- 8.2.2. Chairside Dental Delivery Systems
- 8.2.3. Wall-mounted Dental Delivery Systems
- 8.2.4. Other
- 8.1. Market Analysis, Insights and Forecast - by Application
- 9. Middle East & Africa Dental Delivery Systems Analysis, Insights and Forecast, 2020-2032
- 9.1. Market Analysis, Insights and Forecast - by Application
- 9.1.1. Hospital
- 9.1.2. Clinics
- 9.1.3. Other
- 9.2. Market Analysis, Insights and Forecast - by Types
- 9.2.1. Mobile Dental Delivery Systems
- 9.2.2. Chairside Dental Delivery Systems
- 9.2.3. Wall-mounted Dental Delivery Systems
- 9.2.4. Other
- 9.1. Market Analysis, Insights and Forecast - by Application
- 10. Asia Pacific Dental Delivery Systems Analysis, Insights and Forecast, 2020-2032
- 10.1. Market Analysis, Insights and Forecast - by Application
- 10.1.1. Hospital
- 10.1.2. Clinics
- 10.1.3. Other
- 10.2. Market Analysis, Insights and Forecast - by Types
- 10.2.1. Mobile Dental Delivery Systems
- 10.2.2. Chairside Dental Delivery Systems
- 10.2.3. Wall-mounted Dental Delivery Systems
- 10.2.4. Other
- 10.1. Market Analysis, Insights and Forecast - by Application
- 11. Competitive Analysis
- 11.1. Global Market Share Analysis 2025
- 11.2. Company Profiles
- 11.2.1 AIREL - QUETIN
- 11.2.1.1. Overview
- 11.2.1.2. Products
- 11.2.1.3. SWOT Analysis
- 11.2.1.4. Recent Developments
- 11.2.1.5. Financials (Based on Availability)
- 11.2.2 ANCAR
- 11.2.2.1. Overview
- 11.2.2.2. Products
- 11.2.2.3. SWOT Analysis
- 11.2.2.4. Recent Developments
- 11.2.2.5. Financials (Based on Availability)
- 11.2.3 ASEPTICO
- 11.2.3.1. Overview
- 11.2.3.2. Products
- 11.2.3.3. SWOT Analysis
- 11.2.3.4. Recent Developments
- 11.2.3.5. Financials (Based on Availability)
- 11.2.4 Best Dent Equipment
- 11.2.4.1. Overview
- 11.2.4.2. Products
- 11.2.4.3. SWOT Analysis
- 11.2.4.4. Recent Developments
- 11.2.4.5. Financials (Based on Availability)
- 11.2.5 BPR Swiss
- 11.2.5.1. Overview
- 11.2.5.2. Products
- 11.2.5.3. SWOT Analysis
- 11.2.5.4. Recent Developments
- 11.2.5.5. Financials (Based on Availability)
- 11.2.6 CHIROMEGA
- 11.2.6.1. Overview
- 11.2.6.2. Products
- 11.2.6.3. SWOT Analysis
- 11.2.6.4. Recent Developments
- 11.2.6.5. Financials (Based on Availability)
- 11.2.7 D.B.I. AMERICA
- 11.2.7.1. Overview
- 11.2.7.2. Products
- 11.2.7.3. SWOT Analysis
- 11.2.7.4. Recent Developments
- 11.2.7.5. Financials (Based on Availability)
- 11.2.8 Dansereau Dental Equipment
- 11.2.8.1. Overview
- 11.2.8.2. Products
- 11.2.8.3. SWOT Analysis
- 11.2.8.4. Recent Developments
- 11.2.8.5. Financials (Based on Availability)
- 11.2.9 DentalEZ Group
- 11.2.9.1. Overview
- 11.2.9.2. Products
- 11.2.9.3. SWOT Analysis
- 11.2.9.4. Recent Developments
- 11.2.9.5. Financials (Based on Availability)
- 11.2.10 Dentflex
- 11.2.10.1. Overview
- 11.2.10.2. Products
- 11.2.10.3. SWOT Analysis
- 11.2.10.4. Recent Developments
- 11.2.10.5. Financials (Based on Availability)
- 11.2.11 ETI Dental Industries
- 11.2.11.1. Overview
- 11.2.11.2. Products
- 11.2.11.3. SWOT Analysis
- 11.2.11.4. Recent Developments
- 11.2.11.5. Financials (Based on Availability)
- 11.2.12 Fedesa
- 11.2.12.1. Overview
- 11.2.12.2. Products
- 11.2.12.3. SWOT Analysis
- 11.2.12.4. Recent Developments
- 11.2.12.5. Financials (Based on Availability)
- 11.2.13 Flight Dental Systems
- 11.2.13.1. Overview
- 11.2.13.2. Products
- 11.2.13.3. SWOT Analysis
- 11.2.13.4. Recent Developments
- 11.2.13.5. Financials (Based on Availability)
- 11.2.14 GALBIATI
- 11.2.14.1. Overview
- 11.2.14.2. Products
- 11.2.14.3. SWOT Analysis
- 11.2.14.4. Recent Developments
- 11.2.14.5. Financials (Based on Availability)
- 11.2.15 Galit
- 11.2.15.1. Overview
- 11.2.15.2. Products
- 11.2.15.3. SWOT Analysis
- 11.2.15.4. Recent Developments
- 11.2.15.5. Financials (Based on Availability)
- 11.2.16 Medidenta
- 11.2.16.1. Overview
- 11.2.16.2. Products
- 11.2.16.3. SWOT Analysis
- 11.2.16.4. Recent Developments
- 11.2.16.5. Financials (Based on Availability)
- 11.2.17 Midmark
- 11.2.17.1. Overview
- 11.2.17.2. Products
- 11.2.17.3. SWOT Analysis
- 11.2.17.4. Recent Developments
- 11.2.17.5. Financials (Based on Availability)
- 11.2.18 Miglionico
- 11.2.18.1. Overview
- 11.2.18.2. Products
- 11.2.18.3. SWOT Analysis
- 11.2.18.4. Recent Developments
- 11.2.18.5. Financials (Based on Availability)
- 11.2.19 Navadha Enterprises
- 11.2.19.1. Overview
- 11.2.19.2. Products
- 11.2.19.3. SWOT Analysis
- 11.2.19.4. Recent Developments
- 11.2.19.5. Financials (Based on Availability)
- 11.2.20 NSK
- 11.2.20.1. Overview
- 11.2.20.2. Products
- 11.2.20.3. SWOT Analysis
- 11.2.20.4. Recent Developments
- 11.2.20.5. Financials (Based on Availability)
- 11.2.21 Olsen
- 11.2.21.1. Overview
- 11.2.21.2. Products
- 11.2.21.3. SWOT Analysis
- 11.2.21.4. Recent Developments
- 11.2.21.5. Financials (Based on Availability)
- 11.2.22 Pelton & Crane
- 11.2.22.1. Overview
- 11.2.22.2. Products
- 11.2.22.3. SWOT Analysis
- 11.2.22.4. Recent Developments
- 11.2.22.5. Financials (Based on Availability)
- 11.2.23 Ritter Concept
- 11.2.23.1. Overview
- 11.2.23.2. Products
- 11.2.23.3. SWOT Analysis
- 11.2.23.4. Recent Developments
- 11.2.23.5. Financials (Based on Availability)
- 11.2.24 Safari Dental
- 11.2.24.1. Overview
- 11.2.24.2. Products
- 11.2.24.3. SWOT Analysis
- 11.2.24.4. Recent Developments
- 11.2.24.5. Financials (Based on Availability)
- 11.2.25 Summit Dental Systems
- 11.2.25.1. Overview
- 11.2.25.2. Products
- 11.2.25.3. SWOT Analysis
- 11.2.25.4. Recent Developments
- 11.2.25.5. Financials (Based on Availability)
- 11.2.26 Tenko Medical Systems
- 11.2.26.1. Overview
- 11.2.26.2. Products
- 11.2.26.3. SWOT Analysis
- 11.2.26.4. Recent Developments
- 11.2.26.5. Financials (Based on Availability)
- 11.2.27 TPC
- 11.2.27.1. Overview
- 11.2.27.2. Products
- 11.2.27.3. SWOT Analysis
- 11.2.27.4. Recent Developments
- 11.2.27.5. Financials (Based on Availability)
- 11.2.28 VITALI
- 11.2.28.1. Overview
- 11.2.28.2. Products
- 11.2.28.3. SWOT Analysis
- 11.2.28.4. Recent Developments
- 11.2.28.5. Financials (Based on Availability)
- 11.2.29 Zakton
- 11.2.29.1. Overview
- 11.2.29.2. Products
- 11.2.29.3. SWOT Analysis
- 11.2.29.4. Recent Developments
- 11.2.29.5. Financials (Based on Availability)
- 11.2.30 ZIL FOR
- 11.2.30.1. Overview
- 11.2.30.2. Products
- 11.2.30.3. SWOT Analysis
- 11.2.30.4. Recent Developments
- 11.2.30.5. Financials (Based on Availability)
- 11.2.1 AIREL - QUETIN
List of Figures
- Figure 1: Global Dental Delivery Systems Revenue Breakdown (undefined, %) by Region 2025 & 2033
- Figure 2: Global Dental Delivery Systems Volume Breakdown (K, %) by Region 2025 & 2033
- Figure 3: North America Dental Delivery Systems Revenue (undefined), by Application 2025 & 2033
- Figure 4: North America Dental Delivery Systems Volume (K), by Application 2025 & 2033
- Figure 5: North America Dental Delivery Systems Revenue Share (%), by Application 2025 & 2033
- Figure 6: North America Dental Delivery Systems Volume Share (%), by Application 2025 & 2033
- Figure 7: North America Dental Delivery Systems Revenue (undefined), by Types 2025 & 2033
- Figure 8: North America Dental Delivery Systems Volume (K), by Types 2025 & 2033
- Figure 9: North America Dental Delivery Systems Revenue Share (%), by Types 2025 & 2033
- Figure 10: North America Dental Delivery Systems Volume Share (%), by Types 2025 & 2033
- Figure 11: North America Dental Delivery Systems Revenue (undefined), by Country 2025 & 2033
- Figure 12: North America Dental Delivery Systems Volume (K), by Country 2025 & 2033
- Figure 13: North America Dental Delivery Systems Revenue Share (%), by Country 2025 & 2033
- Figure 14: North America Dental Delivery Systems Volume Share (%), by Country 2025 & 2033
- Figure 15: South America Dental Delivery Systems Revenue (undefined), by Application 2025 & 2033
- Figure 16: South America Dental Delivery Systems Volume (K), by Application 2025 & 2033
- Figure 17: South America Dental Delivery Systems Revenue Share (%), by Application 2025 & 2033
- Figure 18: South America Dental Delivery Systems Volume Share (%), by Application 2025 & 2033
- Figure 19: South America Dental Delivery Systems Revenue (undefined), by Types 2025 & 2033
- Figure 20: South America Dental Delivery Systems Volume (K), by Types 2025 & 2033
- Figure 21: South America Dental Delivery Systems Revenue Share (%), by Types 2025 & 2033
- Figure 22: South America Dental Delivery Systems Volume Share (%), by Types 2025 & 2033
- Figure 23: South America Dental Delivery Systems Revenue (undefined), by Country 2025 & 2033
- Figure 24: South America Dental Delivery Systems Volume (K), by Country 2025 & 2033
- Figure 25: South America Dental Delivery Systems Revenue Share (%), by Country 2025 & 2033
- Figure 26: South America Dental Delivery Systems Volume Share (%), by Country 2025 & 2033
- Figure 27: Europe Dental Delivery Systems Revenue (undefined), by Application 2025 & 2033
- Figure 28: Europe Dental Delivery Systems Volume (K), by Application 2025 & 2033
- Figure 29: Europe Dental Delivery Systems Revenue Share (%), by Application 2025 & 2033
- Figure 30: Europe Dental Delivery Systems Volume Share (%), by Application 2025 & 2033
- Figure 31: Europe Dental Delivery Systems Revenue (undefined), by Types 2025 & 2033
- Figure 32: Europe Dental Delivery Systems Volume (K), by Types 2025 & 2033
- Figure 33: Europe Dental Delivery Systems Revenue Share (%), by Types 2025 & 2033
- Figure 34: Europe Dental Delivery Systems Volume Share (%), by Types 2025 & 2033
- Figure 35: Europe Dental Delivery Systems Revenue (undefined), by Country 2025 & 2033
- Figure 36: Europe Dental Delivery Systems Volume (K), by Country 2025 & 2033
- Figure 37: Europe Dental Delivery Systems Revenue Share (%), by Country 2025 & 2033
- Figure 38: Europe Dental Delivery Systems Volume Share (%), by Country 2025 & 2033
- Figure 39: Middle East & Africa Dental Delivery Systems Revenue (undefined), by Application 2025 & 2033
- Figure 40: Middle East & Africa Dental Delivery Systems Volume (K), by Application 2025 & 2033
- Figure 41: Middle East & Africa Dental Delivery Systems Revenue Share (%), by Application 2025 & 2033
- Figure 42: Middle East & Africa Dental Delivery Systems Volume Share (%), by Application 2025 & 2033
- Figure 43: Middle East & Africa Dental Delivery Systems Revenue (undefined), by Types 2025 & 2033
- Figure 44: Middle East & Africa Dental Delivery Systems Volume (K), by Types 2025 & 2033
- Figure 45: Middle East & Africa Dental Delivery Systems Revenue Share (%), by Types 2025 & 2033
- Figure 46: Middle East & Africa Dental Delivery Systems Volume Share (%), by Types 2025 & 2033
- Figure 47: Middle East & Africa Dental Delivery Systems Revenue (undefined), by Country 2025 & 2033
- Figure 48: Middle East & Africa Dental Delivery Systems Volume (K), by Country 2025 & 2033
- Figure 49: Middle East & Africa Dental Delivery Systems Revenue Share (%), by Country 2025 & 2033
- Figure 50: Middle East & Africa Dental Delivery Systems Volume Share (%), by Country 2025 & 2033
- Figure 51: Asia Pacific Dental Delivery Systems Revenue (undefined), by Application 2025 & 2033
- Figure 52: Asia Pacific Dental Delivery Systems Volume (K), by Application 2025 & 2033
- Figure 53: Asia Pacific Dental Delivery Systems Revenue Share (%), by Application 2025 & 2033
- Figure 54: Asia Pacific Dental Delivery Systems Volume Share (%), by Application 2025 & 2033
- Figure 55: Asia Pacific Dental Delivery Systems Revenue (undefined), by Types 2025 & 2033
- Figure 56: Asia Pacific Dental Delivery Systems Volume (K), by Types 2025 & 2033
- Figure 57: Asia Pacific Dental Delivery Systems Revenue Share (%), by Types 2025 & 2033
- Figure 58: Asia Pacific Dental Delivery Systems Volume Share (%), by Types 2025 & 2033
- Figure 59: Asia Pacific Dental Delivery Systems Revenue (undefined), by Country 2025 & 2033
- Figure 60: Asia Pacific Dental Delivery Systems Volume (K), by Country 2025 & 2033
- Figure 61: Asia Pacific Dental Delivery Systems Revenue Share (%), by Country 2025 & 2033
- Figure 62: Asia Pacific Dental Delivery Systems Volume Share (%), by Country 2025 & 2033
List of Tables
- Table 1: Global Dental Delivery Systems Revenue undefined Forecast, by Application 2020 & 2033
- Table 2: Global Dental Delivery Systems Volume K Forecast, by Application 2020 & 2033
- Table 3: Global Dental Delivery Systems Revenue undefined Forecast, by Types 2020 & 2033
- Table 4: Global Dental Delivery Systems Volume K Forecast, by Types 2020 & 2033
- Table 5: Global Dental Delivery Systems Revenue undefined Forecast, by Region 2020 & 2033
- Table 6: Global Dental Delivery Systems Volume K Forecast, by Region 2020 & 2033
- Table 7: Global Dental Delivery Systems Revenue undefined Forecast, by Application 2020 & 2033
- Table 8: Global Dental Delivery Systems Volume K Forecast, by Application 2020 & 2033
- Table 9: Global Dental Delivery Systems Revenue undefined Forecast, by Types 2020 & 2033
- Table 10: Global Dental Delivery Systems Volume K Forecast, by Types 2020 & 2033
- Table 11: Global Dental Delivery Systems Revenue undefined Forecast, by Country 2020 & 2033
- Table 12: Global Dental Delivery Systems Volume K Forecast, by Country 2020 & 2033
- Table 13: United States Dental Delivery Systems Revenue (undefined) Forecast, by Application 2020 & 2033
- Table 14: United States Dental Delivery Systems Volume (K) Forecast, by Application 2020 & 2033
- Table 15: Canada Dental Delivery Systems Revenue (undefined) Forecast, by Application 2020 & 2033
- Table 16: Canada Dental Delivery Systems Volume (K) Forecast, by Application 2020 & 2033
- Table 17: Mexico Dental Delivery Systems Revenue (undefined) Forecast, by Application 2020 & 2033
- Table 18: Mexico Dental Delivery Systems Volume (K) Forecast, by Application 2020 & 2033
- Table 19: Global Dental Delivery Systems Revenue undefined Forecast, by Application 2020 & 2033
- Table 20: Global Dental Delivery Systems Volume K Forecast, by Application 2020 & 2033
- Table 21: Global Dental Delivery Systems Revenue undefined Forecast, by Types 2020 & 2033
- Table 22: Global Dental Delivery Systems Volume K Forecast, by Types 2020 & 2033
- Table 23: Global Dental Delivery Systems Revenue undefined Forecast, by Country 2020 & 2033
- Table 24: Global Dental Delivery Systems Volume K Forecast, by Country 2020 & 2033
- Table 25: Brazil Dental Delivery Systems Revenue (undefined) Forecast, by Application 2020 & 2033
- Table 26: Brazil Dental Delivery Systems Volume (K) Forecast, by Application 2020 & 2033
- Table 27: Argentina Dental Delivery Systems Revenue (undefined) Forecast, by Application 2020 & 2033
- Table 28: Argentina Dental Delivery Systems Volume (K) Forecast, by Application 2020 & 2033
- Table 29: Rest of South America Dental Delivery Systems Revenue (undefined) Forecast, by Application 2020 & 2033
- Table 30: Rest of South America Dental Delivery Systems Volume (K) Forecast, by Application 2020 & 2033
- Table 31: Global Dental Delivery Systems Revenue undefined Forecast, by Application 2020 & 2033
- Table 32: Global Dental Delivery Systems Volume K Forecast, by Application 2020 & 2033
- Table 33: Global Dental Delivery Systems Revenue undefined Forecast, by Types 2020 & 2033
- Table 34: Global Dental Delivery Systems Volume K Forecast, by Types 2020 & 2033
- Table 35: Global Dental Delivery Systems Revenue undefined Forecast, by Country 2020 & 2033
- Table 36: Global Dental Delivery Systems Volume K Forecast, by Country 2020 & 2033
- Table 37: United Kingdom Dental Delivery Systems Revenue (undefined) Forecast, by Application 2020 & 2033
- Table 38: United Kingdom Dental Delivery Systems Volume (K) Forecast, by Application 2020 & 2033
- Table 39: Germany Dental Delivery Systems Revenue (undefined) Forecast, by Application 2020 & 2033
- Table 40: Germany Dental Delivery Systems Volume (K) Forecast, by Application 2020 & 2033
- Table 41: France Dental Delivery Systems Revenue (undefined) Forecast, by Application 2020 & 2033
- Table 42: France Dental Delivery Systems Volume (K) Forecast, by Application 2020 & 2033
- Table 43: Italy Dental Delivery Systems Revenue (undefined) Forecast, by Application 2020 & 2033
- Table 44: Italy Dental Delivery Systems Volume (K) Forecast, by Application 2020 & 2033
- Table 45: Spain Dental Delivery Systems Revenue (undefined) Forecast, by Application 2020 & 2033
- Table 46: Spain Dental Delivery Systems Volume (K) Forecast, by Application 2020 & 2033
- Table 47: Russia Dental Delivery Systems Revenue (undefined) Forecast, by Application 2020 & 2033
- Table 48: Russia Dental Delivery Systems Volume (K) Forecast, by Application 2020 & 2033
- Table 49: Benelux Dental Delivery Systems Revenue (undefined) Forecast, by Application 2020 & 2033
- Table 50: Benelux Dental Delivery Systems Volume (K) Forecast, by Application 2020 & 2033
- Table 51: Nordics Dental Delivery Systems Revenue (undefined) Forecast, by Application 2020 & 2033
- Table 52: Nordics Dental Delivery Systems Volume (K) Forecast, by Application 2020 & 2033
- Table 53: Rest of Europe Dental Delivery Systems Revenue (undefined) Forecast, by Application 2020 & 2033
- Table 54: Rest of Europe Dental Delivery Systems Volume (K) Forecast, by Application 2020 & 2033
- Table 55: Global Dental Delivery Systems Revenue undefined Forecast, by Application 2020 & 2033
- Table 56: Global Dental Delivery Systems Volume K Forecast, by Application 2020 & 2033
- Table 57: Global Dental Delivery Systems Revenue undefined Forecast, by Types 2020 & 2033
- Table 58: Global Dental Delivery Systems Volume K Forecast, by Types 2020 & 2033
- Table 59: Global Dental Delivery Systems Revenue undefined Forecast, by Country 2020 & 2033
- Table 60: Global Dental Delivery Systems Volume K Forecast, by Country 2020 & 2033
- Table 61: Turkey Dental Delivery Systems Revenue (undefined) Forecast, by Application 2020 & 2033
- Table 62: Turkey Dental Delivery Systems Volume (K) Forecast, by Application 2020 & 2033
- Table 63: Israel Dental Delivery Systems Revenue (undefined) Forecast, by Application 2020 & 2033
- Table 64: Israel Dental Delivery Systems Volume (K) Forecast, by Application 2020 & 2033
- Table 65: GCC Dental Delivery Systems Revenue (undefined) Forecast, by Application 2020 & 2033
- Table 66: GCC Dental Delivery Systems Volume (K) Forecast, by Application 2020 & 2033
- Table 67: North Africa Dental Delivery Systems Revenue (undefined) Forecast, by Application 2020 & 2033
- Table 68: North Africa Dental Delivery Systems Volume (K) Forecast, by Application 2020 & 2033
- Table 69: South Africa Dental Delivery Systems Revenue (undefined) Forecast, by Application 2020 & 2033
- Table 70: South Africa Dental Delivery Systems Volume (K) Forecast, by Application 2020 & 2033
- Table 71: Rest of Middle East & Africa Dental Delivery Systems Revenue (undefined) Forecast, by Application 2020 & 2033
- Table 72: Rest of Middle East & Africa Dental Delivery Systems Volume (K) Forecast, by Application 2020 & 2033
- Table 73: Global Dental Delivery Systems Revenue undefined Forecast, by Application 2020 & 2033
- Table 74: Global Dental Delivery Systems Volume K Forecast, by Application 2020 & 2033
- Table 75: Global Dental Delivery Systems Revenue undefined Forecast, by Types 2020 & 2033
- Table 76: Global Dental Delivery Systems Volume K Forecast, by Types 2020 & 2033
- Table 77: Global Dental Delivery Systems Revenue undefined Forecast, by Country 2020 & 2033
- Table 78: Global Dental Delivery Systems Volume K Forecast, by Country 2020 & 2033
- Table 79: China Dental Delivery Systems Revenue (undefined) Forecast, by Application 2020 & 2033
- Table 80: China Dental Delivery Systems Volume (K) Forecast, by Application 2020 & 2033
- Table 81: India Dental Delivery Systems Revenue (undefined) Forecast, by Application 2020 & 2033
- Table 82: India Dental Delivery Systems Volume (K) Forecast, by Application 2020 & 2033
- Table 83: Japan Dental Delivery Systems Revenue (undefined) Forecast, by Application 2020 & 2033
- Table 84: Japan Dental Delivery Systems Volume (K) Forecast, by Application 2020 & 2033
- Table 85: South Korea Dental Delivery Systems Revenue (undefined) Forecast, by Application 2020 & 2033
- Table 86: South Korea Dental Delivery Systems Volume (K) Forecast, by Application 2020 & 2033
- Table 87: ASEAN Dental Delivery Systems Revenue (undefined) Forecast, by Application 2020 & 2033
- Table 88: ASEAN Dental Delivery Systems Volume (K) Forecast, by Application 2020 & 2033
- Table 89: Oceania Dental Delivery Systems Revenue (undefined) Forecast, by Application 2020 & 2033
- Table 90: Oceania Dental Delivery Systems Volume (K) Forecast, by Application 2020 & 2033
- Table 91: Rest of Asia Pacific Dental Delivery Systems Revenue (undefined) Forecast, by Application 2020 & 2033
- Table 92: Rest of Asia Pacific Dental Delivery Systems Volume (K) Forecast, by Application 2020 & 2033
Frequently Asked Questions
1. What is the projected Compound Annual Growth Rate (CAGR) of the Dental Delivery Systems?
The projected CAGR is approximately 7.4%.
2. Which companies are prominent players in the Dental Delivery Systems?
Key companies in the market include AIREL - QUETIN, ANCAR, ASEPTICO, Best Dent Equipment, BPR Swiss, CHIROMEGA, D.B.I. AMERICA, Dansereau Dental Equipment, DentalEZ Group, Dentflex, ETI Dental Industries, Fedesa, Flight Dental Systems, GALBIATI, Galit, Medidenta, Midmark, Miglionico, Navadha Enterprises, NSK, Olsen, Pelton & Crane, Ritter Concept, Safari Dental, Summit Dental Systems, Tenko Medical Systems, TPC, VITALI, Zakton, ZIL FOR.
3. What are the main segments of the Dental Delivery Systems?
The market segments include Application, Types.
4. Can you provide details about the market size?
The market size is estimated to be USD XXX N/A as of 2022.
5. What are some drivers contributing to market growth?
N/A
6. What are the notable trends driving market growth?
N/A
7. Are there any restraints impacting market growth?
N/A
8. Can you provide examples of recent developments in the market?
N/A
9. What pricing options are available for accessing the report?
Pricing options include single-user, multi-user, and enterprise licenses priced at USD 3950.00, USD 5925.00, and USD 7900.00 respectively.
10. Is the market size provided in terms of value or volume?
The market size is provided in terms of value, measured in N/A and volume, measured in K.
11. Are there any specific market keywords associated with the report?
Yes, the market keyword associated with the report is "Dental Delivery Systems," which aids in identifying and referencing the specific market segment covered.
12. How do I determine which pricing option suits my needs best?
The pricing options vary based on user requirements and access needs. Individual users may opt for single-user licenses, while businesses requiring broader access may choose multi-user or enterprise licenses for cost-effective access to the report.
13. Are there any additional resources or data provided in the Dental Delivery Systems report?
While the report offers comprehensive insights, it's advisable to review the specific contents or supplementary materials provided to ascertain if additional resources or data are available.
14. How can I stay updated on further developments or reports in the Dental Delivery Systems?
To stay informed about further developments, trends, and reports in the Dental Delivery Systems, consider subscribing to industry newsletters, following relevant companies and organizations, or regularly checking reputable industry news sources and publications.
Methodology
Step 1 - Identification of Relevant Samples Size from Population Database


Step 2 - Approaches for Defining Global Market Size (Value, Volume* & Price*)

Note*: In applicable scenarios
Step 3 - Data Sources
Primary Research
- Web Analytics
- Survey Reports
- Research Institute
- Latest Research Reports
- Opinion Leaders
Secondary Research
- Annual Reports
- White Paper
- Latest Press Release
- Industry Association
- Paid Database
- Investor Presentations

Step 4 - Data Triangulation
Involves using different sources of information in order to increase the validity of a study
These sources are likely to be stakeholders in a program - participants, other researchers, program staff, other community members, and so on.
Then we put all data in single framework & apply various statistical tools to find out the dynamic on the market.
During the analysis stage, feedback from the stakeholder groups would be compared to determine areas of agreement as well as areas of divergence