

Key Insights
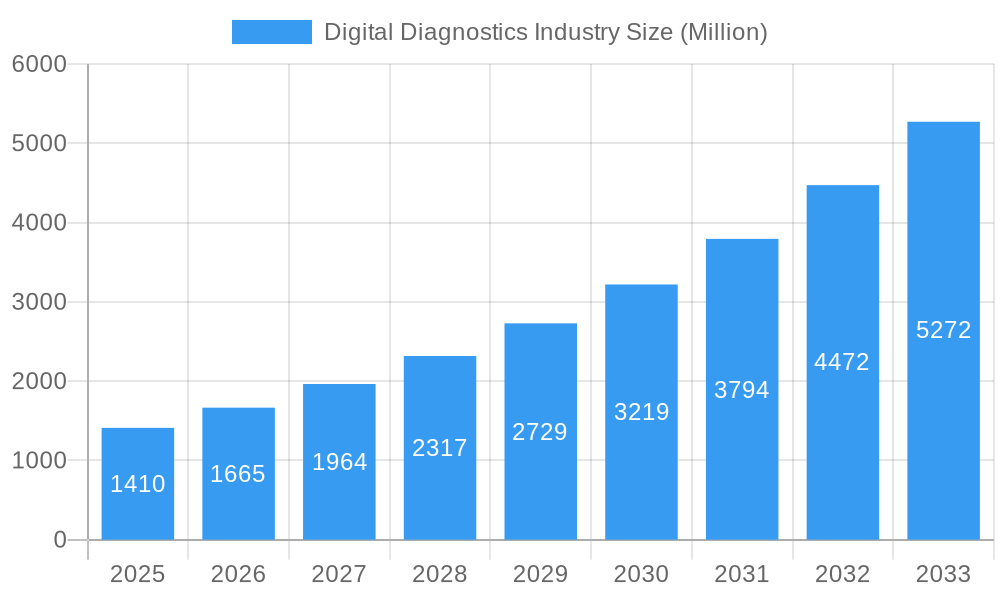
The Digital Diagnostics market is poised for substantial expansion, projected to reach an impressive USD 1.41 billion in 2025. This growth is underpinned by a robust CAGR of 18.08%, indicating a dynamic and rapidly evolving industry. Key drivers fueling this surge include the increasing adoption of artificial intelligence and machine learning in diagnostics, enabling faster and more accurate disease detection. The growing prevalence of chronic diseases globally, coupled with an aging population, necessitates advanced diagnostic solutions, further propelling market demand. Furthermore, the continuous technological advancements in imaging and analytical tools are enhancing the capabilities of digital diagnostic systems, making them indispensable in modern healthcare. The emphasis on personalized medicine and the drive for early disease intervention also contribute significantly to the market's upward trajectory, as digital diagnostics play a crucial role in identifying biomarkers and predicting disease risk.
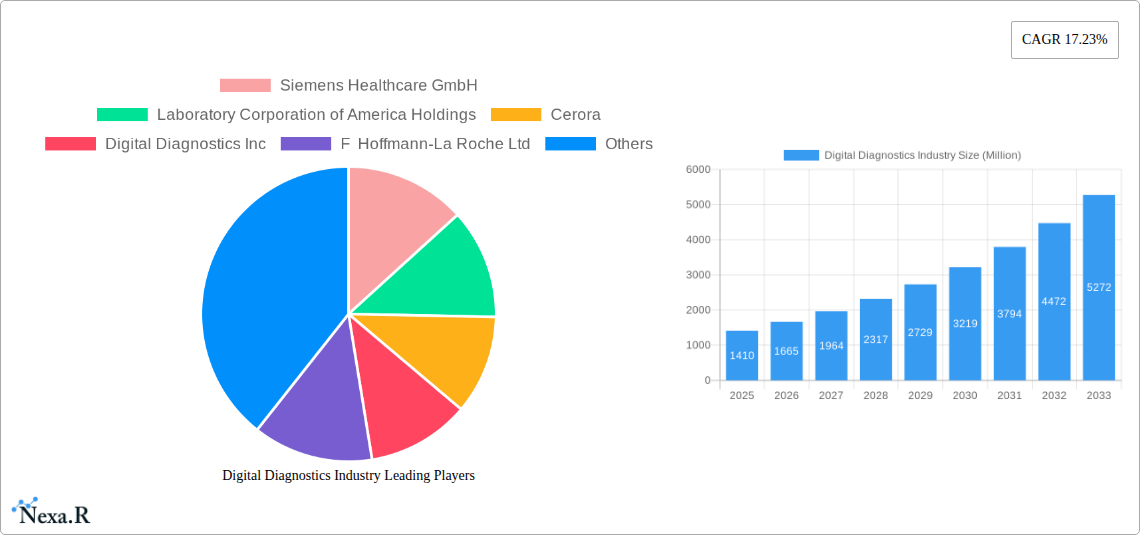
Digital Diagnostics Industry Market Size (In Billion)
The market is segmented across a diverse range of offerings, with Hardware, Software, and Services all contributing to the overall value chain. In terms of diagnosis types, Cardiology, Oncology, and Neurology represent significant segments due to the high burden of these diseases and the critical need for precise diagnostic tools. The primary end users, Hospitals and Clinics and Clinical Laboratories, are investing heavily in digital diagnostic solutions to improve patient outcomes and operational efficiency. Leading companies such as Siemens Healthcare GmbH, GE Healthcare, and Thermo Fisher Scientific Inc. are at the forefront of innovation, driving the market through strategic partnerships and product development. Geographically, North America and Europe currently dominate the market, owing to advanced healthcare infrastructure and higher R&D investments. However, the Asia Pacific region is expected to witness the fastest growth due to increasing healthcare expenditure and a rising demand for advanced medical technologies. Restrains such as high implementation costs and data privacy concerns are being addressed through technological advancements and evolving regulatory frameworks, ensuring sustained market growth.
Digital Diagnostics Industry Company Market Share
This comprehensive report provides an in-depth analysis of the global Digital Diagnostics Industry, covering market dynamics, growth trends, regional dominance, product landscape, key drivers, challenges, opportunities, growth accelerators, and key players. The study encompasses the historical period of 2019–2024, with the base year and estimated year at 2025, and forecasts to 2033. The report leverages high-traffic keywords such as "digital diagnostics," "AI in healthcare," "telehealth diagnostics," "pathology diagnostics," "radiology imaging," "cardiology diagnostics," "oncology diagnostics," "neurology diagnostics," and "in-vitro diagnostics (IVD)" to maximize search engine visibility and attract industry professionals.
Digital Diagnostics Industry Market Dynamics & Structure
The Digital Diagnostics Industry is characterized by a dynamic interplay of technological innovation, evolving regulatory landscapes, and intense competitive pressures. Market concentration varies across segments, with specialized software and AI-driven solutions exhibiting higher fragmentation compared to established hardware providers. Technological advancements, particularly in artificial intelligence (AI), machine learning (ML), and cloud computing, serve as primary drivers, enabling enhanced diagnostic accuracy, faster turnaround times, and remote patient monitoring. The stringent regulatory frameworks governing medical devices and data privacy necessitate significant investment in compliance, acting as both a barrier to entry and a driver for product development that adheres to global standards. Competitive product substitutes range from traditional diagnostic methods to emerging point-of-care (POC) solutions, forcing companies to continuously innovate and differentiate their offerings. End-user demographics are increasingly shifting towards value-based healthcare models, demanding cost-effective and outcome-driven diagnostic solutions. Mergers and acquisitions (M&A) are prevalent, with larger players acquiring innovative startups to expand their portfolios and market reach.
- Market Concentration: High in hardware, moderate in software and services, with significant fragmentation in niche AI diagnostic solutions.
- Technological Innovation Drivers: AI/ML for image analysis, cloud platforms for data management, IoT for remote monitoring, advancements in biosensors.
- Regulatory Frameworks: FDA, CE Marking, HIPAA, GDPR compliance are critical.
- Competitive Product Substitutes: Traditional lab tests, rapid POC tests, competitor digital platforms, AI algorithms from different vendors.
- End-User Demographics: Hospitals, clinics, clinical laboratories, research institutions, direct-to-consumer (DTC) platforms.
- M&A Trends: Strategic acquisitions of AI startups, integration of digital capabilities by traditional diagnostic companies, consolidation in the IVD market.
Digital Diagnostics Industry Growth Trends & Insights
The global Digital Diagnostics Industry is poised for substantial expansion, driven by the increasing adoption of AI in healthcare, the burgeoning telehealth sector, and the demand for precision medicine. Market size is projected to grow from an estimated $45.6 billion in 2025 to $110.5 billion by 2033, exhibiting a compound annual growth rate (CAGR) of 11.8%. This growth is underpinned by rising healthcare expenditures worldwide, a growing aging population requiring more diagnostic interventions, and the critical need for efficient disease detection and management. Technological disruptions, such as the integration of AI algorithms into radiology and pathology workflows, are revolutionizing diagnostic capabilities, leading to earlier and more accurate disease identification. Consumer behavior shifts are also playing a pivotal role, with a growing preference for convenient, accessible, and personalized healthcare solutions, evidenced by the rise of online diagnostic platforms and home-based testing kits. The digital transformation of healthcare infrastructure is accelerating, enabling seamless data integration and improved patient outcomes.
- Market Size Evolution: Forecasted to reach $110.5 billion by 2033 from $45.6 billion in 2025.
- Adoption Rates: Rapid adoption of AI-powered diagnostics in radiology and pathology, increasing penetration of telehealth diagnostic services.
- Technological Disruptions: AI for image interpretation, ML for predictive diagnostics, blockchain for secure data sharing, advanced biosensors for POC testing.
- Consumer Behavior Shifts: Demand for remote diagnostics, personalized health monitoring, direct access to diagnostic testing, preventative health focus.
- Market Penetration: Significant growth in segments like oncology and cardiology diagnostics due to disease prevalence and technological advancements.
Dominant Regions, Countries, or Segments in Digital Diagnostics Industry
North America, particularly the United States, is currently the dominant region in the Digital Diagnostics Industry, driven by robust healthcare infrastructure, high R&D investment, and favorable regulatory environments for medical technology innovation. The region's dominance is further amplified by the presence of leading technology companies and academic research institutions pushing the boundaries of AI and digital health.
Product Segment Dominance:
- Software: This segment is experiencing exponential growth, fueled by the increasing demand for AI-powered diagnostic algorithms, cloud-based data management solutions, and integrated diagnostic platforms. Companies are investing heavily in developing sophisticated software for image analysis, risk prediction, and workflow optimization.
- Key Drivers: AI/ML advancements, interoperability standards, demand for data analytics, remote diagnostic capabilities.
- Market Share: Projected to capture a significant portion of the market due to its scalability and integration potential.
- Hardware: While established, the hardware segment remains crucial, encompassing advanced imaging devices, molecular diagnostic equipment, and POC testing hardware. Innovations focus on miniaturization, improved portability, and enhanced data acquisition capabilities.
- Key Drivers: Demand for high-resolution imaging, development of advanced molecular diagnostic instruments, need for reliable POC devices.
- Market Share: Continues to hold substantial value, particularly in specialized areas like advanced imaging.
- Services: The services segment, including cloud hosting, data analysis, technical support, and consulting, is a rapidly expanding area. This is driven by the increasing complexity of digital diagnostic systems and the need for expert implementation and maintenance.
- Key Drivers: Need for data security and compliance, demand for specialized analytical expertise, integration of digital solutions into existing healthcare systems.
- Market Share: Growing in importance as digital ecosystems become more complex.
Diagnosis Type Dominance:
- Oncology: Digital diagnostics are revolutionizing cancer detection, staging, and treatment monitoring. AI-powered image analysis for radiology and pathology, as well as digital tools for genomic profiling, are key growth drivers.
- Key Drivers: High cancer incidence, demand for early detection and personalized treatment, advancements in computational pathology.
- Market Share: Consistently high due to the critical need for advanced cancer diagnostics.
- Cardiology: Digital tools are transforming cardiac diagnostics through AI-driven ECG analysis, remote cardiac monitoring devices, and advanced imaging interpretation.
- Key Drivers: High prevalence of cardiovascular diseases, demand for continuous patient monitoring, integration of wearable technology.
- Market Share: Significant and growing, driven by the prevalence of heart conditions and the effectiveness of digital interventions.
- Radiology: This segment is a frontrunner in digital diagnostics, with AI algorithms significantly enhancing image interpretation, reducing radiologist workload, and improving diagnostic accuracy.
- Key Drivers: Volume of imaging procedures, demand for faster and more accurate interpretations, development of sophisticated AI imaging software.
- Market Share: Leading segment due to early adoption and continuous innovation.
End User Dominance:
- Hospitals and Clinics: These remain the largest end-users, integrating digital diagnostic solutions to improve patient care, streamline workflows, and enhance operational efficiency. The shift towards value-based care incentivizes the adoption of cost-effective digital tools.
- Key Drivers: Need for integrated patient care, pressure to reduce costs, adoption of EMR/EHR systems, demand for improved clinical decision support.
- Market Share: Dominant, representing the primary customer base for most digital diagnostic solutions.
Digital Diagnostics Industry Product Landscape
The product landscape in the Digital Diagnostics Industry is characterized by continuous innovation, with a strong emphasis on AI-driven software solutions, advanced imaging hardware, and integrated service platforms. Key product innovations include AI algorithms for automated image analysis in radiology and pathology, enabling faster and more accurate diagnoses of conditions like cancer and neurological disorders. Advanced hardware encompasses miniaturized POC diagnostic devices and high-resolution imaging equipment that capture more detailed data for digital interpretation. Software plays a crucial role in data integration, workflow optimization, and predictive analytics, providing clinicians with actionable insights. These products offer unique selling propositions such as enhanced diagnostic accuracy, reduced turnaround times, improved patient access to care through telehealth, and cost efficiencies for healthcare providers. Technological advancements are driving the development of more intelligent, connected, and user-friendly diagnostic tools.
Key Drivers, Barriers & Challenges in Digital Diagnostics Industry
Key Drivers:
- Technological Advancements: The relentless progress in AI, ML, cloud computing, and IoT is central to the development of more sophisticated and accurate digital diagnostic tools.
- Increasing Healthcare Expenditure: Growing global healthcare spending, particularly in emerging economies, fuels the demand for advanced diagnostic solutions.
- Rising Prevalence of Chronic Diseases: The increasing burden of chronic conditions like cancer, cardiovascular diseases, and neurological disorders necessitates efficient and early diagnostic methods.
- Government Initiatives & Funding: Supportive government policies, R&D grants, and digital health mandates are accelerating market growth.
- Demand for Personalized Medicine: Digital diagnostics enable genomic sequencing, biomarker analysis, and tailored treatment plans, aligning with the personalized medicine paradigm.
Barriers & Challenges:
- Regulatory Hurdles: Navigating complex and evolving regulatory approval processes for digital health technologies can be time-consuming and costly.
- Data Security & Privacy Concerns: Ensuring the secure storage, transmission, and privacy of sensitive patient data is paramount and requires robust cybersecurity measures.
- Interoperability Issues: Lack of seamless integration between different digital diagnostic systems and existing healthcare IT infrastructure hinders widespread adoption.
- High Implementation Costs: The initial investment in digital diagnostic hardware, software, and training can be substantial, posing a challenge for smaller healthcare facilities.
- Digital Divide & Access: Unequal access to technology and digital literacy can create disparities in healthcare, limiting the reach of digital diagnostics in certain populations or regions.
- Physician Adoption & Training: Overcoming physician resistance and providing adequate training on new digital diagnostic tools are crucial for successful implementation.
Emerging Opportunities in Digital Diagnostics Industry
The Digital Diagnostics Industry is ripe with emerging opportunities, particularly in the development of AI-powered predictive diagnostics for early disease risk assessment and personalized treatment planning. The expansion of telehealth services presents a significant avenue for remote diagnostic solutions, enabling wider patient access, especially in underserved areas. Furthermore, the integration of digital diagnostics with wearable devices and the Internet of Things (IoT) is creating new possibilities for continuous, non-invasive patient monitoring and early detection of anomalies. Untapped markets in developing economies, where the adoption of advanced diagnostic technologies is still nascent, offer substantial growth potential. The increasing focus on preventative healthcare also opens doors for digital tools that facilitate early screening and proactive health management.
Growth Accelerators in the Digital Diagnostics Industry Industry
Long-term growth in the Digital Diagnostics Industry will be propelled by significant technological breakthroughs, particularly in AI's ability to interpret complex biological data and enhance diagnostic accuracy. Strategic partnerships between technology companies, pharmaceutical firms, and healthcare providers are crucial for co-development and market penetration of innovative solutions. Market expansion strategies, including entering new geographic regions and targeting specific disease areas with tailored digital diagnostic offerings, will further accelerate growth. The increasing acceptance and integration of digital health technologies within mainstream healthcare systems, coupled with favorable reimbursement policies, will act as powerful growth catalysts, driving widespread adoption and investment.
Key Players Shaping the Digital Diagnostics Industry Market
- Siemens Healthcare GmbH
- Laboratory Corporation of America Holdings
- Cerora
- Digital Diagnostics Inc
- F Hoffmann-La Roche Ltd
- GE Healthcare
- Vuno Inc
- Midmark Corporation
- Nanox Imaging Ltd
- Novasignal Corporation
- Riverain Technologies
- ThermoFisher Scientific Inc
Notable Milestones in Digital Diagnostics Industry Sector
- May 2022: TestCard, a MedTech company, secured USD 10 million in fundraising to commercialize its existing product suite and launch new products for diabetes, pregnancy, CKD, and flu testing.
- February 2022: Labcorp launched Labcorp OnDemand, an online platform allowing users to order diagnostic tests, with potential for home sample collection, enhancing accessibility to leading diagnostic tests.
In-Depth Digital Diagnostics Industry Market Outlook
The future outlook for the Digital Diagnostics Industry is exceptionally promising, driven by the continued integration of advanced technologies and a global shift towards proactive and personalized healthcare. Growth accelerators such as AI-driven predictive analytics, the expansion of remote patient monitoring via telehealth platforms, and the increasing application of digital tools in oncology, cardiology, and neurology will continue to fuel market expansion. Strategic collaborations between leading technology providers and healthcare institutions will foster innovation and streamline the adoption of these cutting-edge solutions. Furthermore, the growing emphasis on value-based healthcare models globally presents a significant opportunity for digital diagnostics to demonstrate their ability to improve patient outcomes while optimizing costs, setting the stage for sustained robust growth in the coming years.
Digital Diagnostics Industry Segmentation
-
1. Product
- 1.1. Hardware
- 1.2. Software
- 1.3. Services
-
2. Diagnosis Type
- 2.1. Cardiology
- 2.2. Oncology
- 2.3. Neurology
- 2.4. Radiology
- 2.5. Pathology
- 2.6. Others
-
3. End User
- 3.1. Hospitals and Clinics
- 3.2. Clinical Laboratories
- 3.3. Others
Digital Diagnostics Industry Segmentation By Geography
-
1. North America
- 1.1. United States
- 1.2. Canada
- 1.3. Mexico
-
2. Europe
- 2.1. Germany
- 2.2. United Kingdom
- 2.3. France
- 2.4. Italy
- 2.5. Spain
- 2.6. Rest of Europe
-
3. Asia Pacific
- 3.1. China
- 3.2. Japan
- 3.3. India
- 3.4. Australia
- 3.5. South Korea
- 3.6. Rest of Asia Pacific
-
4. Middle East and Africa
- 4.1. GCC
- 4.2. South Africa
- 4.3. Rest of Middle East and Africa
-
5. South America
- 5.1. Brazil
- 5.2. Argentina
- 5.3. Rest of South America
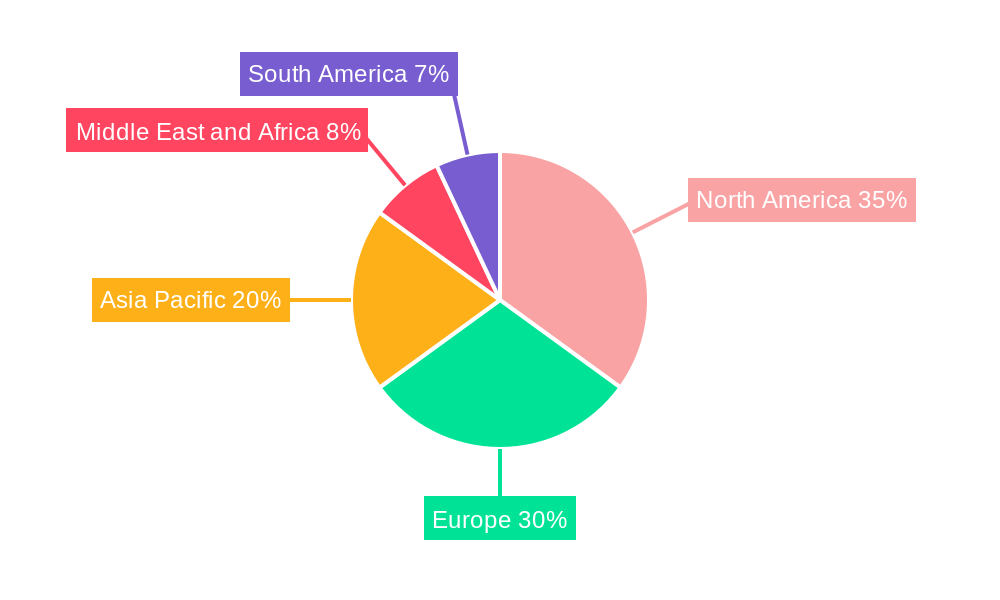
Digital Diagnostics Industry Regional Market Share
Geographic Coverage of Digital Diagnostics Industry
Digital Diagnostics Industry REPORT HIGHLIGHTS
| Aspects | Details |
|---|---|
| Study Period | 2020-2034 |
| Base Year | 2025 |
| Estimated Year | 2026 |
| Forecast Period | 2026-2034 |
| Historical Period | 2020-2025 |
| Growth Rate | CAGR of 18.08% from 2020-2034 |
| Segmentation |
|
Table of Contents
- 1. Introduction
- 1.1. Research Scope
- 1.2. Market Segmentation
- 1.3. Research Objective
- 1.4. Definitions and Assumptions
- 2. Executive Summary
- 2.1. Market Snapshot
- 3. Market Dynamics
- 3.1. Market Drivers
- 3.2. Market Restrains
- 3.3. Market Trends
- 3.4. Market Opportunities
- 4. Market Factor Analysis
- 4.1. Porters Five Forces
- 4.1.1. Bargaining Power of Suppliers
- 4.1.2. Bargaining Power of Buyers
- 4.1.3. Threat of New Entrants
- 4.1.4. Threat of Substitutes
- 4.1.5. Competitive Rivalry
- 4.2. PESTEL analysis
- 4.3. BCG Analysis
- 4.3.1. Stars (High Growth, High Market Share)
- 4.3.2. Cash Cows (Low Growth, High Market Share)
- 4.3.3. Question Mark (High Growth, Low Market Share)
- 4.3.4. Dogs (Low Growth, Low Market Share)
- 4.4. Ansoff Matrix Analysis
- 4.5. Supply Chain Analysis
- 4.6. Regulatory Landscape
- 4.7. Current Market Potential and Opportunity Assessment (TAM–SAM–SOM Framework)
- 4.8. NRP Analyst Note
- 4.1. Porters Five Forces
- 5. Market Analysis, Insights and Forecast 2021-2033
- 5.1. Market Analysis, Insights and Forecast - by Product
- 5.1.1. Hardware
- 5.1.2. Software
- 5.1.3. Services
- 5.2. Market Analysis, Insights and Forecast - by Diagnosis Type
- 5.2.1. Cardiology
- 5.2.2. Oncology
- 5.2.3. Neurology
- 5.2.4. Radiology
- 5.2.5. Pathology
- 5.2.6. Others
- 5.3. Market Analysis, Insights and Forecast - by End User
- 5.3.1. Hospitals and Clinics
- 5.3.2. Clinical Laboratories
- 5.3.3. Others
- 5.4. Market Analysis, Insights and Forecast - by Region
- 5.4.1. North America
- 5.4.2. Europe
- 5.4.3. Asia Pacific
- 5.4.4. Middle East and Africa
- 5.4.5. South America
- 5.1. Market Analysis, Insights and Forecast - by Product
- 6. Global Digital Diagnostics Industry Analysis, Insights and Forecast, 2021-2033
- 6.1. Market Analysis, Insights and Forecast - by Product
- 6.1.1. Hardware
- 6.1.2. Software
- 6.1.3. Services
- 6.2. Market Analysis, Insights and Forecast - by Diagnosis Type
- 6.2.1. Cardiology
- 6.2.2. Oncology
- 6.2.3. Neurology
- 6.2.4. Radiology
- 6.2.5. Pathology
- 6.2.6. Others
- 6.3. Market Analysis, Insights and Forecast - by End User
- 6.3.1. Hospitals and Clinics
- 6.3.2. Clinical Laboratories
- 6.3.3. Others
- 6.1. Market Analysis, Insights and Forecast - by Product
- 7. North America Digital Diagnostics Industry Analysis, Insights and Forecast, 2020-2032
- 7.1. Market Analysis, Insights and Forecast - by Product
- 7.1.1. Hardware
- 7.1.2. Software
- 7.1.3. Services
- 7.2. Market Analysis, Insights and Forecast - by Diagnosis Type
- 7.2.1. Cardiology
- 7.2.2. Oncology
- 7.2.3. Neurology
- 7.2.4. Radiology
- 7.2.5. Pathology
- 7.2.6. Others
- 7.3. Market Analysis, Insights and Forecast - by End User
- 7.3.1. Hospitals and Clinics
- 7.3.2. Clinical Laboratories
- 7.3.3. Others
- 7.1. Market Analysis, Insights and Forecast - by Product
- 8. Europe Digital Diagnostics Industry Analysis, Insights and Forecast, 2020-2032
- 8.1. Market Analysis, Insights and Forecast - by Product
- 8.1.1. Hardware
- 8.1.2. Software
- 8.1.3. Services
- 8.2. Market Analysis, Insights and Forecast - by Diagnosis Type
- 8.2.1. Cardiology
- 8.2.2. Oncology
- 8.2.3. Neurology
- 8.2.4. Radiology
- 8.2.5. Pathology
- 8.2.6. Others
- 8.3. Market Analysis, Insights and Forecast - by End User
- 8.3.1. Hospitals and Clinics
- 8.3.2. Clinical Laboratories
- 8.3.3. Others
- 8.1. Market Analysis, Insights and Forecast - by Product
- 9. Asia Pacific Digital Diagnostics Industry Analysis, Insights and Forecast, 2020-2032
- 9.1. Market Analysis, Insights and Forecast - by Product
- 9.1.1. Hardware
- 9.1.2. Software
- 9.1.3. Services
- 9.2. Market Analysis, Insights and Forecast - by Diagnosis Type
- 9.2.1. Cardiology
- 9.2.2. Oncology
- 9.2.3. Neurology
- 9.2.4. Radiology
- 9.2.5. Pathology
- 9.2.6. Others
- 9.3. Market Analysis, Insights and Forecast - by End User
- 9.3.1. Hospitals and Clinics
- 9.3.2. Clinical Laboratories
- 9.3.3. Others
- 9.1. Market Analysis, Insights and Forecast - by Product
- 10. Middle East and Africa Digital Diagnostics Industry Analysis, Insights and Forecast, 2020-2032
- 10.1. Market Analysis, Insights and Forecast - by Product
- 10.1.1. Hardware
- 10.1.2. Software
- 10.1.3. Services
- 10.2. Market Analysis, Insights and Forecast - by Diagnosis Type
- 10.2.1. Cardiology
- 10.2.2. Oncology
- 10.2.3. Neurology
- 10.2.4. Radiology
- 10.2.5. Pathology
- 10.2.6. Others
- 10.3. Market Analysis, Insights and Forecast - by End User
- 10.3.1. Hospitals and Clinics
- 10.3.2. Clinical Laboratories
- 10.3.3. Others
- 10.1. Market Analysis, Insights and Forecast - by Product
- 11. South America Digital Diagnostics Industry Analysis, Insights and Forecast, 2020-2032
- 11.1. Market Analysis, Insights and Forecast - by Product
- 11.1.1. Hardware
- 11.1.2. Software
- 11.1.3. Services
- 11.2. Market Analysis, Insights and Forecast - by Diagnosis Type
- 11.2.1. Cardiology
- 11.2.2. Oncology
- 11.2.3. Neurology
- 11.2.4. Radiology
- 11.2.5. Pathology
- 11.2.6. Others
- 11.3. Market Analysis, Insights and Forecast - by End User
- 11.3.1. Hospitals and Clinics
- 11.3.2. Clinical Laboratories
- 11.3.3. Others
- 11.1. Market Analysis, Insights and Forecast - by Product
- 12. Competitive Analysis
- 12.1. Company Profiles
- 12.1.1 Siemens Healthcare GmbH
- 12.1.1.1. Company Overview
- 12.1.1.2. Products
- 12.1.1.3. Company Financials
- 12.1.1.4. SWOT Analysis
- 12.1.2 Laboratory Corporation of America Holdings
- 12.1.2.1. Company Overview
- 12.1.2.2. Products
- 12.1.2.3. Company Financials
- 12.1.2.4. SWOT Analysis
- 12.1.3 Cerora
- 12.1.3.1. Company Overview
- 12.1.3.2. Products
- 12.1.3.3. Company Financials
- 12.1.3.4. SWOT Analysis
- 12.1.4 Digital Diagnostics Inc
- 12.1.4.1. Company Overview
- 12.1.4.2. Products
- 12.1.4.3. Company Financials
- 12.1.4.4. SWOT Analysis
- 12.1.5 F Hoffmann-La Roche Ltd
- 12.1.5.1. Company Overview
- 12.1.5.2. Products
- 12.1.5.3. Company Financials
- 12.1.5.4. SWOT Analysis
- 12.1.6 GE Healthcare
- 12.1.6.1. Company Overview
- 12.1.6.2. Products
- 12.1.6.3. Company Financials
- 12.1.6.4. SWOT Analysis
- 12.1.7 Vuno Inc
- 12.1.7.1. Company Overview
- 12.1.7.2. Products
- 12.1.7.3. Company Financials
- 12.1.7.4. SWOT Analysis
- 12.1.8 Midmark Corporation
- 12.1.8.1. Company Overview
- 12.1.8.2. Products
- 12.1.8.3. Company Financials
- 12.1.8.4. SWOT Analysis
- 12.1.9 Nanox Imaging Ltd
- 12.1.9.1. Company Overview
- 12.1.9.2. Products
- 12.1.9.3. Company Financials
- 12.1.9.4. SWOT Analysis
- 12.1.10 Novasignal Corporation
- 12.1.10.1. Company Overview
- 12.1.10.2. Products
- 12.1.10.3. Company Financials
- 12.1.10.4. SWOT Analysis
- 12.1.11 Riverain Technologies
- 12.1.11.1. Company Overview
- 12.1.11.2. Products
- 12.1.11.3. Company Financials
- 12.1.11.4. SWOT Analysis
- 12.1.12 ThermoFisher Scientific Inc
- 12.1.12.1. Company Overview
- 12.1.12.2. Products
- 12.1.12.3. Company Financials
- 12.1.12.4. SWOT Analysis
- 12.1.1 Siemens Healthcare GmbH
- 12.2. Market Entropy
- 12.2.1 Company's Key Areas Served
- 12.2.2 Recent Developments
- 12.3. Company Market Share Analysis 2025
- 12.3.1 Top 5 Companies Market Share Analysis
- 12.3.2 Top 3 Companies Market Share Analysis
- 12.4. List of Potential Customers
- 13. Research Methodology
List of Figures
- Figure 1: Global Digital Diagnostics Industry Revenue Breakdown (billion, %) by Region 2025 & 2033
- Figure 2: Global Digital Diagnostics Industry Volume Breakdown (K Unit, %) by Region 2025 & 2033
- Figure 3: North America Digital Diagnostics Industry Revenue (billion), by Product 2025 & 2033
- Figure 4: North America Digital Diagnostics Industry Volume (K Unit), by Product 2025 & 2033
- Figure 5: North America Digital Diagnostics Industry Revenue Share (%), by Product 2025 & 2033
- Figure 6: North America Digital Diagnostics Industry Volume Share (%), by Product 2025 & 2033
- Figure 7: North America Digital Diagnostics Industry Revenue (billion), by Diagnosis Type 2025 & 2033
- Figure 8: North America Digital Diagnostics Industry Volume (K Unit), by Diagnosis Type 2025 & 2033
- Figure 9: North America Digital Diagnostics Industry Revenue Share (%), by Diagnosis Type 2025 & 2033
- Figure 10: North America Digital Diagnostics Industry Volume Share (%), by Diagnosis Type 2025 & 2033
- Figure 11: North America Digital Diagnostics Industry Revenue (billion), by End User 2025 & 2033
- Figure 12: North America Digital Diagnostics Industry Volume (K Unit), by End User 2025 & 2033
- Figure 13: North America Digital Diagnostics Industry Revenue Share (%), by End User 2025 & 2033
- Figure 14: North America Digital Diagnostics Industry Volume Share (%), by End User 2025 & 2033
- Figure 15: North America Digital Diagnostics Industry Revenue (billion), by Country 2025 & 2033
- Figure 16: North America Digital Diagnostics Industry Volume (K Unit), by Country 2025 & 2033
- Figure 17: North America Digital Diagnostics Industry Revenue Share (%), by Country 2025 & 2033
- Figure 18: North America Digital Diagnostics Industry Volume Share (%), by Country 2025 & 2033
- Figure 19: Europe Digital Diagnostics Industry Revenue (billion), by Product 2025 & 2033
- Figure 20: Europe Digital Diagnostics Industry Volume (K Unit), by Product 2025 & 2033
- Figure 21: Europe Digital Diagnostics Industry Revenue Share (%), by Product 2025 & 2033
- Figure 22: Europe Digital Diagnostics Industry Volume Share (%), by Product 2025 & 2033
- Figure 23: Europe Digital Diagnostics Industry Revenue (billion), by Diagnosis Type 2025 & 2033
- Figure 24: Europe Digital Diagnostics Industry Volume (K Unit), by Diagnosis Type 2025 & 2033
- Figure 25: Europe Digital Diagnostics Industry Revenue Share (%), by Diagnosis Type 2025 & 2033
- Figure 26: Europe Digital Diagnostics Industry Volume Share (%), by Diagnosis Type 2025 & 2033
- Figure 27: Europe Digital Diagnostics Industry Revenue (billion), by End User 2025 & 2033
- Figure 28: Europe Digital Diagnostics Industry Volume (K Unit), by End User 2025 & 2033
- Figure 29: Europe Digital Diagnostics Industry Revenue Share (%), by End User 2025 & 2033
- Figure 30: Europe Digital Diagnostics Industry Volume Share (%), by End User 2025 & 2033
- Figure 31: Europe Digital Diagnostics Industry Revenue (billion), by Country 2025 & 2033
- Figure 32: Europe Digital Diagnostics Industry Volume (K Unit), by Country 2025 & 2033
- Figure 33: Europe Digital Diagnostics Industry Revenue Share (%), by Country 2025 & 2033
- Figure 34: Europe Digital Diagnostics Industry Volume Share (%), by Country 2025 & 2033
- Figure 35: Asia Pacific Digital Diagnostics Industry Revenue (billion), by Product 2025 & 2033
- Figure 36: Asia Pacific Digital Diagnostics Industry Volume (K Unit), by Product 2025 & 2033
- Figure 37: Asia Pacific Digital Diagnostics Industry Revenue Share (%), by Product 2025 & 2033
- Figure 38: Asia Pacific Digital Diagnostics Industry Volume Share (%), by Product 2025 & 2033
- Figure 39: Asia Pacific Digital Diagnostics Industry Revenue (billion), by Diagnosis Type 2025 & 2033
- Figure 40: Asia Pacific Digital Diagnostics Industry Volume (K Unit), by Diagnosis Type 2025 & 2033
- Figure 41: Asia Pacific Digital Diagnostics Industry Revenue Share (%), by Diagnosis Type 2025 & 2033
- Figure 42: Asia Pacific Digital Diagnostics Industry Volume Share (%), by Diagnosis Type 2025 & 2033
- Figure 43: Asia Pacific Digital Diagnostics Industry Revenue (billion), by End User 2025 & 2033
- Figure 44: Asia Pacific Digital Diagnostics Industry Volume (K Unit), by End User 2025 & 2033
- Figure 45: Asia Pacific Digital Diagnostics Industry Revenue Share (%), by End User 2025 & 2033
- Figure 46: Asia Pacific Digital Diagnostics Industry Volume Share (%), by End User 2025 & 2033
- Figure 47: Asia Pacific Digital Diagnostics Industry Revenue (billion), by Country 2025 & 2033
- Figure 48: Asia Pacific Digital Diagnostics Industry Volume (K Unit), by Country 2025 & 2033
- Figure 49: Asia Pacific Digital Diagnostics Industry Revenue Share (%), by Country 2025 & 2033
- Figure 50: Asia Pacific Digital Diagnostics Industry Volume Share (%), by Country 2025 & 2033
- Figure 51: Middle East and Africa Digital Diagnostics Industry Revenue (billion), by Product 2025 & 2033
- Figure 52: Middle East and Africa Digital Diagnostics Industry Volume (K Unit), by Product 2025 & 2033
- Figure 53: Middle East and Africa Digital Diagnostics Industry Revenue Share (%), by Product 2025 & 2033
- Figure 54: Middle East and Africa Digital Diagnostics Industry Volume Share (%), by Product 2025 & 2033
- Figure 55: Middle East and Africa Digital Diagnostics Industry Revenue (billion), by Diagnosis Type 2025 & 2033
- Figure 56: Middle East and Africa Digital Diagnostics Industry Volume (K Unit), by Diagnosis Type 2025 & 2033
- Figure 57: Middle East and Africa Digital Diagnostics Industry Revenue Share (%), by Diagnosis Type 2025 & 2033
- Figure 58: Middle East and Africa Digital Diagnostics Industry Volume Share (%), by Diagnosis Type 2025 & 2033
- Figure 59: Middle East and Africa Digital Diagnostics Industry Revenue (billion), by End User 2025 & 2033
- Figure 60: Middle East and Africa Digital Diagnostics Industry Volume (K Unit), by End User 2025 & 2033
- Figure 61: Middle East and Africa Digital Diagnostics Industry Revenue Share (%), by End User 2025 & 2033
- Figure 62: Middle East and Africa Digital Diagnostics Industry Volume Share (%), by End User 2025 & 2033
- Figure 63: Middle East and Africa Digital Diagnostics Industry Revenue (billion), by Country 2025 & 2033
- Figure 64: Middle East and Africa Digital Diagnostics Industry Volume (K Unit), by Country 2025 & 2033
- Figure 65: Middle East and Africa Digital Diagnostics Industry Revenue Share (%), by Country 2025 & 2033
- Figure 66: Middle East and Africa Digital Diagnostics Industry Volume Share (%), by Country 2025 & 2033
- Figure 67: South America Digital Diagnostics Industry Revenue (billion), by Product 2025 & 2033
- Figure 68: South America Digital Diagnostics Industry Volume (K Unit), by Product 2025 & 2033
- Figure 69: South America Digital Diagnostics Industry Revenue Share (%), by Product 2025 & 2033
- Figure 70: South America Digital Diagnostics Industry Volume Share (%), by Product 2025 & 2033
- Figure 71: South America Digital Diagnostics Industry Revenue (billion), by Diagnosis Type 2025 & 2033
- Figure 72: South America Digital Diagnostics Industry Volume (K Unit), by Diagnosis Type 2025 & 2033
- Figure 73: South America Digital Diagnostics Industry Revenue Share (%), by Diagnosis Type 2025 & 2033
- Figure 74: South America Digital Diagnostics Industry Volume Share (%), by Diagnosis Type 2025 & 2033
- Figure 75: South America Digital Diagnostics Industry Revenue (billion), by End User 2025 & 2033
- Figure 76: South America Digital Diagnostics Industry Volume (K Unit), by End User 2025 & 2033
- Figure 77: South America Digital Diagnostics Industry Revenue Share (%), by End User 2025 & 2033
- Figure 78: South America Digital Diagnostics Industry Volume Share (%), by End User 2025 & 2033
- Figure 79: South America Digital Diagnostics Industry Revenue (billion), by Country 2025 & 2033
- Figure 80: South America Digital Diagnostics Industry Volume (K Unit), by Country 2025 & 2033
- Figure 81: South America Digital Diagnostics Industry Revenue Share (%), by Country 2025 & 2033
- Figure 82: South America Digital Diagnostics Industry Volume Share (%), by Country 2025 & 2033
List of Tables
- Table 1: Global Digital Diagnostics Industry Revenue billion Forecast, by Product 2020 & 2033
- Table 2: Global Digital Diagnostics Industry Volume K Unit Forecast, by Product 2020 & 2033
- Table 3: Global Digital Diagnostics Industry Revenue billion Forecast, by Diagnosis Type 2020 & 2033
- Table 4: Global Digital Diagnostics Industry Volume K Unit Forecast, by Diagnosis Type 2020 & 2033
- Table 5: Global Digital Diagnostics Industry Revenue billion Forecast, by End User 2020 & 2033
- Table 6: Global Digital Diagnostics Industry Volume K Unit Forecast, by End User 2020 & 2033
- Table 7: Global Digital Diagnostics Industry Revenue billion Forecast, by Region 2020 & 2033
- Table 8: Global Digital Diagnostics Industry Volume K Unit Forecast, by Region 2020 & 2033
- Table 9: Global Digital Diagnostics Industry Revenue billion Forecast, by Product 2020 & 2033
- Table 10: Global Digital Diagnostics Industry Volume K Unit Forecast, by Product 2020 & 2033
- Table 11: Global Digital Diagnostics Industry Revenue billion Forecast, by Diagnosis Type 2020 & 2033
- Table 12: Global Digital Diagnostics Industry Volume K Unit Forecast, by Diagnosis Type 2020 & 2033
- Table 13: Global Digital Diagnostics Industry Revenue billion Forecast, by End User 2020 & 2033
- Table 14: Global Digital Diagnostics Industry Volume K Unit Forecast, by End User 2020 & 2033
- Table 15: Global Digital Diagnostics Industry Revenue billion Forecast, by Country 2020 & 2033
- Table 16: Global Digital Diagnostics Industry Volume K Unit Forecast, by Country 2020 & 2033
- Table 17: United States Digital Diagnostics Industry Revenue (billion) Forecast, by Application 2020 & 2033
- Table 18: United States Digital Diagnostics Industry Volume (K Unit) Forecast, by Application 2020 & 2033
- Table 19: Canada Digital Diagnostics Industry Revenue (billion) Forecast, by Application 2020 & 2033
- Table 20: Canada Digital Diagnostics Industry Volume (K Unit) Forecast, by Application 2020 & 2033
- Table 21: Mexico Digital Diagnostics Industry Revenue (billion) Forecast, by Application 2020 & 2033
- Table 22: Mexico Digital Diagnostics Industry Volume (K Unit) Forecast, by Application 2020 & 2033
- Table 23: Global Digital Diagnostics Industry Revenue billion Forecast, by Product 2020 & 2033
- Table 24: Global Digital Diagnostics Industry Volume K Unit Forecast, by Product 2020 & 2033
- Table 25: Global Digital Diagnostics Industry Revenue billion Forecast, by Diagnosis Type 2020 & 2033
- Table 26: Global Digital Diagnostics Industry Volume K Unit Forecast, by Diagnosis Type 2020 & 2033
- Table 27: Global Digital Diagnostics Industry Revenue billion Forecast, by End User 2020 & 2033
- Table 28: Global Digital Diagnostics Industry Volume K Unit Forecast, by End User 2020 & 2033
- Table 29: Global Digital Diagnostics Industry Revenue billion Forecast, by Country 2020 & 2033
- Table 30: Global Digital Diagnostics Industry Volume K Unit Forecast, by Country 2020 & 2033
- Table 31: Germany Digital Diagnostics Industry Revenue (billion) Forecast, by Application 2020 & 2033
- Table 32: Germany Digital Diagnostics Industry Volume (K Unit) Forecast, by Application 2020 & 2033
- Table 33: United Kingdom Digital Diagnostics Industry Revenue (billion) Forecast, by Application 2020 & 2033
- Table 34: United Kingdom Digital Diagnostics Industry Volume (K Unit) Forecast, by Application 2020 & 2033
- Table 35: France Digital Diagnostics Industry Revenue (billion) Forecast, by Application 2020 & 2033
- Table 36: France Digital Diagnostics Industry Volume (K Unit) Forecast, by Application 2020 & 2033
- Table 37: Italy Digital Diagnostics Industry Revenue (billion) Forecast, by Application 2020 & 2033
- Table 38: Italy Digital Diagnostics Industry Volume (K Unit) Forecast, by Application 2020 & 2033
- Table 39: Spain Digital Diagnostics Industry Revenue (billion) Forecast, by Application 2020 & 2033
- Table 40: Spain Digital Diagnostics Industry Volume (K Unit) Forecast, by Application 2020 & 2033
- Table 41: Rest of Europe Digital Diagnostics Industry Revenue (billion) Forecast, by Application 2020 & 2033
- Table 42: Rest of Europe Digital Diagnostics Industry Volume (K Unit) Forecast, by Application 2020 & 2033
- Table 43: Global Digital Diagnostics Industry Revenue billion Forecast, by Product 2020 & 2033
- Table 44: Global Digital Diagnostics Industry Volume K Unit Forecast, by Product 2020 & 2033
- Table 45: Global Digital Diagnostics Industry Revenue billion Forecast, by Diagnosis Type 2020 & 2033
- Table 46: Global Digital Diagnostics Industry Volume K Unit Forecast, by Diagnosis Type 2020 & 2033
- Table 47: Global Digital Diagnostics Industry Revenue billion Forecast, by End User 2020 & 2033
- Table 48: Global Digital Diagnostics Industry Volume K Unit Forecast, by End User 2020 & 2033
- Table 49: Global Digital Diagnostics Industry Revenue billion Forecast, by Country 2020 & 2033
- Table 50: Global Digital Diagnostics Industry Volume K Unit Forecast, by Country 2020 & 2033
- Table 51: China Digital Diagnostics Industry Revenue (billion) Forecast, by Application 2020 & 2033
- Table 52: China Digital Diagnostics Industry Volume (K Unit) Forecast, by Application 2020 & 2033
- Table 53: Japan Digital Diagnostics Industry Revenue (billion) Forecast, by Application 2020 & 2033
- Table 54: Japan Digital Diagnostics Industry Volume (K Unit) Forecast, by Application 2020 & 2033
- Table 55: India Digital Diagnostics Industry Revenue (billion) Forecast, by Application 2020 & 2033
- Table 56: India Digital Diagnostics Industry Volume (K Unit) Forecast, by Application 2020 & 2033
- Table 57: Australia Digital Diagnostics Industry Revenue (billion) Forecast, by Application 2020 & 2033
- Table 58: Australia Digital Diagnostics Industry Volume (K Unit) Forecast, by Application 2020 & 2033
- Table 59: South Korea Digital Diagnostics Industry Revenue (billion) Forecast, by Application 2020 & 2033
- Table 60: South Korea Digital Diagnostics Industry Volume (K Unit) Forecast, by Application 2020 & 2033
- Table 61: Rest of Asia Pacific Digital Diagnostics Industry Revenue (billion) Forecast, by Application 2020 & 2033
- Table 62: Rest of Asia Pacific Digital Diagnostics Industry Volume (K Unit) Forecast, by Application 2020 & 2033
- Table 63: Global Digital Diagnostics Industry Revenue billion Forecast, by Product 2020 & 2033
- Table 64: Global Digital Diagnostics Industry Volume K Unit Forecast, by Product 2020 & 2033
- Table 65: Global Digital Diagnostics Industry Revenue billion Forecast, by Diagnosis Type 2020 & 2033
- Table 66: Global Digital Diagnostics Industry Volume K Unit Forecast, by Diagnosis Type 2020 & 2033
- Table 67: Global Digital Diagnostics Industry Revenue billion Forecast, by End User 2020 & 2033
- Table 68: Global Digital Diagnostics Industry Volume K Unit Forecast, by End User 2020 & 2033
- Table 69: Global Digital Diagnostics Industry Revenue billion Forecast, by Country 2020 & 2033
- Table 70: Global Digital Diagnostics Industry Volume K Unit Forecast, by Country 2020 & 2033
- Table 71: GCC Digital Diagnostics Industry Revenue (billion) Forecast, by Application 2020 & 2033
- Table 72: GCC Digital Diagnostics Industry Volume (K Unit) Forecast, by Application 2020 & 2033
- Table 73: South Africa Digital Diagnostics Industry Revenue (billion) Forecast, by Application 2020 & 2033
- Table 74: South Africa Digital Diagnostics Industry Volume (K Unit) Forecast, by Application 2020 & 2033
- Table 75: Rest of Middle East and Africa Digital Diagnostics Industry Revenue (billion) Forecast, by Application 2020 & 2033
- Table 76: Rest of Middle East and Africa Digital Diagnostics Industry Volume (K Unit) Forecast, by Application 2020 & 2033
- Table 77: Global Digital Diagnostics Industry Revenue billion Forecast, by Product 2020 & 2033
- Table 78: Global Digital Diagnostics Industry Volume K Unit Forecast, by Product 2020 & 2033
- Table 79: Global Digital Diagnostics Industry Revenue billion Forecast, by Diagnosis Type 2020 & 2033
- Table 80: Global Digital Diagnostics Industry Volume K Unit Forecast, by Diagnosis Type 2020 & 2033
- Table 81: Global Digital Diagnostics Industry Revenue billion Forecast, by End User 2020 & 2033
- Table 82: Global Digital Diagnostics Industry Volume K Unit Forecast, by End User 2020 & 2033
- Table 83: Global Digital Diagnostics Industry Revenue billion Forecast, by Country 2020 & 2033
- Table 84: Global Digital Diagnostics Industry Volume K Unit Forecast, by Country 2020 & 2033
- Table 85: Brazil Digital Diagnostics Industry Revenue (billion) Forecast, by Application 2020 & 2033
- Table 86: Brazil Digital Diagnostics Industry Volume (K Unit) Forecast, by Application 2020 & 2033
- Table 87: Argentina Digital Diagnostics Industry Revenue (billion) Forecast, by Application 2020 & 2033
- Table 88: Argentina Digital Diagnostics Industry Volume (K Unit) Forecast, by Application 2020 & 2033
- Table 89: Rest of South America Digital Diagnostics Industry Revenue (billion) Forecast, by Application 2020 & 2033
- Table 90: Rest of South America Digital Diagnostics Industry Volume (K Unit) Forecast, by Application 2020 & 2033
Frequently Asked Questions
1. What is the projected Compound Annual Growth Rate (CAGR) of the Digital Diagnostics Industry?
The projected CAGR is approximately 18.08%.
2. Which companies are prominent players in the Digital Diagnostics Industry?
Key companies in the market include Siemens Healthcare GmbH, Laboratory Corporation of America Holdings, Cerora, Digital Diagnostics Inc, F Hoffmann-La Roche Ltd, GE Healthcare, Vuno Inc , Midmark Corporation, Nanox Imaging Ltd, Novasignal Corporation, Riverain Technologies, ThermoFisher Scientific Inc.
3. What are the main segments of the Digital Diagnostics Industry?
The market segments include Product, Diagnosis Type, End User.
4. Can you provide details about the market size?
The market size is estimated to be USD 1.41 billion as of 2022.
5. What are some drivers contributing to market growth?
Rising Adoption of Digitalization in Chronic Disease Management; Increasing Burden of Chronic Diseases.
6. What are the notable trends driving market growth?
Oncology Segment is Expected to Account for the Large Market Share During the Forecast Period.
7. Are there any restraints impacting market growth?
High Cost of Instruments.
8. Can you provide examples of recent developments in the market?
In May 2022, TestCard, a MedTech company, received USD 10 million in its latest round of fundraising, which will be used primarily to further commercialize its existing product suite whilst also launching new products such as diabetes, pregnancy, CKD, and flu testing.
9. What pricing options are available for accessing the report?
Pricing options include single-user, multi-user, and enterprise licenses priced at USD 4750, USD 5250, and USD 8750 respectively.
10. Is the market size provided in terms of value or volume?
The market size is provided in terms of value, measured in billion and volume, measured in K Unit.
11. Are there any specific market keywords associated with the report?
Yes, the market keyword associated with the report is "Digital Diagnostics Industry," which aids in identifying and referencing the specific market segment covered.
12. How do I determine which pricing option suits my needs best?
The pricing options vary based on user requirements and access needs. Individual users may opt for single-user licenses, while businesses requiring broader access may choose multi-user or enterprise licenses for cost-effective access to the report.
13. Are there any additional resources or data provided in the Digital Diagnostics Industry report?
While the report offers comprehensive insights, it's advisable to review the specific contents or supplementary materials provided to ascertain if additional resources or data are available.
14. How can I stay updated on further developments or reports in the Digital Diagnostics Industry?
To stay informed about further developments, trends, and reports in the Digital Diagnostics Industry, consider subscribing to industry newsletters, following relevant companies and organizations, or regularly checking reputable industry news sources and publications.
Methodology
Step 1 - Identification of Relevant Samples Size from Population Database


Step 2 - Approaches for Defining Global Market Size (Value, Volume* & Price*)

Note*: In applicable scenarios
Step 3 - Data Sources
Primary Research
- Web Analytics
- Survey Reports
- Research Institute
- Latest Research Reports
- Opinion Leaders
Secondary Research
- Annual Reports
- White Paper
- Latest Press Release
- Industry Association
- Paid Database
- Investor Presentations

Step 4 - Data Triangulation
Involves using different sources of information in order to increase the validity of a study
These sources are likely to be stakeholders in a program - participants, other researchers, program staff, other community members, and so on.
Then we put all data in single framework & apply various statistical tools to find out the dynamic on the market.
During the analysis stage, feedback from the stakeholder groups would be compared to determine areas of agreement as well as areas of divergence