

Key Insights
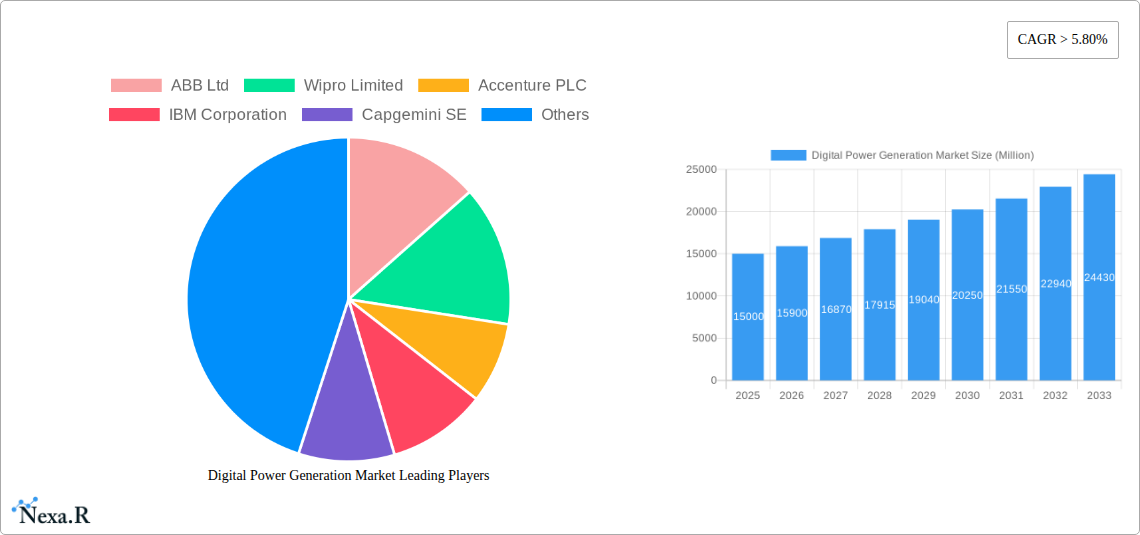
The digital power generation market is experiencing robust growth, driven by the increasing adoption of smart grids, renewable energy integration, and the need for enhanced grid efficiency and reliability. A compound annual growth rate (CAGR) exceeding 5.80% indicates a significant expansion, projected to reach a substantial market value by 2033. This growth is fueled by several key factors: the urgent need to modernize aging power infrastructure, the rising demand for efficient energy management, and the proliferation of advanced technologies like artificial intelligence (AI) and machine learning (ML) for predictive maintenance and optimized grid operation. The integration of digital solutions, such as advanced metering infrastructure (AMI) and energy storage systems (ESS), is further accelerating market expansion. Hardware components, including sensors, communication networks, and data analytics platforms, constitute a significant portion of the market. The power generation, transmission, and distribution (T&D) sector is a primary adopter of these technologies, followed by the burgeoning energy storage and energy trading sectors. Major players like ABB, Siemens, and Microsoft are actively investing in research and development, fostering innovation and competition within the sector. Geographic regions like North America and Asia-Pacific are expected to dominate the market due to significant investments in infrastructure modernization and the rapid expansion of renewable energy sources.
The market segmentation highlights the diverse applications of digital power generation technologies. Integrated solutions offer comprehensive platforms streamlining various aspects of power generation and management. Hardware solutions, including sensors, communication systems, and control devices, are crucial for data acquisition and system control. While the power generation, transmission, and distribution (T&D) sector remains the dominant user, the growing energy storage and energy trading markets are driving demand for digital solutions enabling optimized energy management and trading strategies. However, challenges remain, including high initial investment costs associated with digital infrastructure upgrades and the need for robust cybersecurity measures to protect sensitive grid data. Despite these hurdles, the long-term growth outlook for the digital power generation market remains highly positive, driven by the global transition towards cleaner and more efficient energy systems.
Digital Power Generation Market: A Comprehensive Report (2019-2033)
This in-depth report provides a comprehensive analysis of the Digital Power Generation Market, encompassing its current state, future trajectory, and key players. The report covers the parent market of Power Generation and its child markets, including Transmission & Distribution (T&D), Energy Storage, and Energy Trading, offering a granular understanding of market dynamics and growth potential. The study period spans from 2019 to 2033, with a base year of 2025 and a forecast period from 2025 to 2033. The market size is valued in million units.
Digital Power Generation Market Market Dynamics & Structure
The digital power generation market is characterized by moderate concentration, with key players such as ABB Ltd, Siemens AG, and General Electric Company holding significant market share. However, the market is also witnessing increased participation from IT services giants like Infosys Limited, Wipro Limited, and Accenture PLC, indicating a shift towards integrated solutions. Technological innovation, particularly in areas like AI, IoT, and cloud computing, is a major growth driver. Regulatory frameworks promoting renewable energy and grid modernization are further bolstering market expansion. Competitive substitutes, including traditional power generation technologies, are facing pressure due to the increasing cost-effectiveness and efficiency of digital solutions. The market shows a growing demand for digital solutions among diverse end-users, including power generation companies, utilities, and independent power producers. M&A activity is rising, with a projected xx number of deals in the forecast period, driven by companies seeking to expand their technological capabilities and market reach.
- Market Concentration: Moderately concentrated, with top 5 players holding approximately xx% market share in 2024.
- Technological Innovation: AI, IoT, and cloud computing are key drivers, facilitating predictive maintenance, optimized grid management, and enhanced energy efficiency.
- Regulatory Landscape: Supportive policies promoting renewable energy and grid modernization are creating favorable conditions for market growth.
- Competitive Substitutes: Traditional power generation technologies are facing increasing competition from digital solutions.
- End-User Demographics: Growing demand from power generation companies, utilities, and independent power producers.
- M&A Trends: Increasing M&A activity, with an estimated xx deals expected between 2025 and 2033.
Digital Power Generation Market Growth Trends & Insights
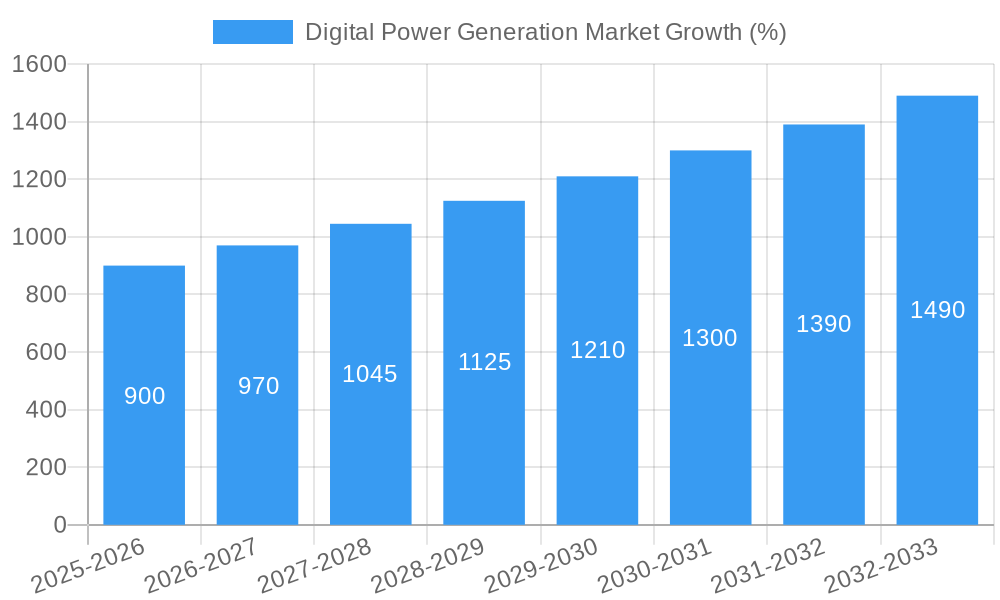
The digital power generation market is experiencing robust growth, fueled by the global shift towards renewable energy sources and the increasing need for grid modernization. Market size is estimated to reach xx million units in 2025 and is projected to grow at a CAGR of xx% during the forecast period (2025-2033), reaching xx million units by 2033. Adoption rates are accelerating, particularly in developed economies with mature electricity grids and strong digital infrastructure. Technological disruptions, like the rise of edge computing and advanced analytics, are transforming operational efficiency and optimizing energy distribution. Consumer behavior is shifting towards greater demand for reliable, sustainable, and cost-effective energy solutions, directly impacting the market demand for digital power generation technologies. This trend is amplified by rising energy costs and environmental concerns.
Dominant Regions, Countries, or Segments in Digital Power Generation Market
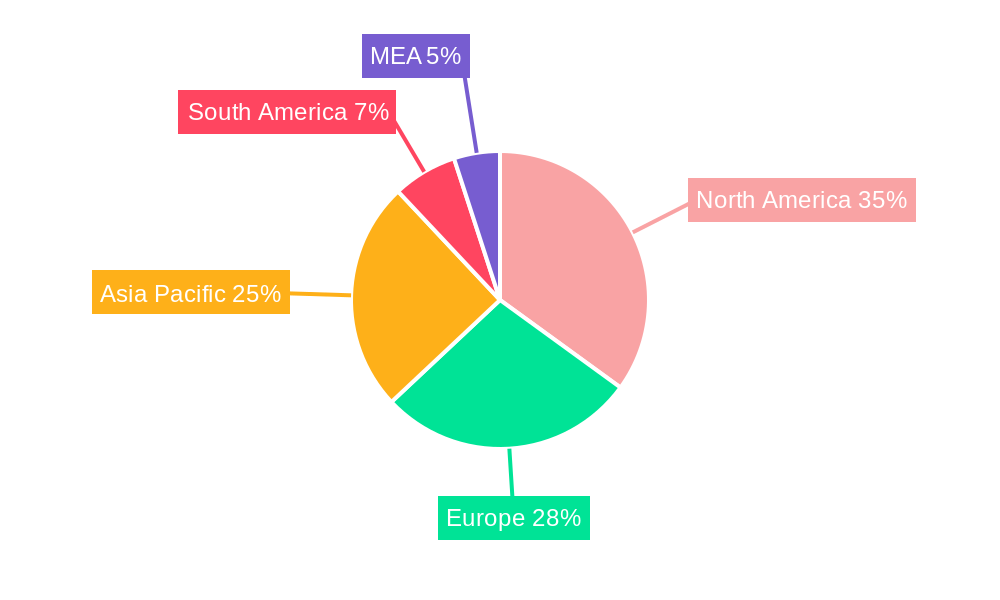
North America currently leads the digital power generation market, followed by Europe and Asia-Pacific. The strong presence of major technology companies and established power grids in North America contributes to its market dominance. Within the segments, the Integrated Solutions segment currently holds the largest market share, driven by the increasing need for holistic energy management systems. However, the Hardware segment is projected to exhibit faster growth, fueled by advancements in sensor technology and improved data analytics capabilities.
- North America: Strong presence of major technology companies and established power grids.
- Europe: Significant investments in renewable energy and grid modernization initiatives.
- Asia-Pacific: Rapid growth driven by increasing energy demand and government support for digitalization.
- Technology Segments: Integrated Solutions currently leads, but Hardware is anticipated to show strong growth.
- Sector Segments: Power Generation and T&D segments are the largest, driven by modernization efforts.
Digital Power Generation Market Product Landscape
The digital power generation market offers a diverse range of products, including advanced metering infrastructure (AMI), smart grids, energy storage management systems, and predictive maintenance software. These products leverage technologies like AI, machine learning, and big data analytics to optimize energy production, distribution, and consumption. Unique selling propositions include enhanced grid reliability, improved energy efficiency, and reduced operational costs. Technological advancements are focused on improving data security, integrating renewable energy sources, and developing more robust and scalable solutions.
Key Drivers, Barriers & Challenges in Digital Power Generation Market
Key Drivers:
- Growing demand for reliable and sustainable energy.
- Increasing adoption of renewable energy sources.
- Government initiatives promoting grid modernization and digitalization.
- Technological advancements in AI, IoT, and cloud computing.
Key Challenges:
- High initial investment costs for digital infrastructure upgrades.
- Cybersecurity risks associated with connected devices and systems.
- Integration challenges with existing legacy systems.
- Lack of skilled workforce to manage and maintain digital infrastructure. This represents an estimated xx% barrier to market entry for smaller firms.
Emerging Opportunities in Digital Power Generation Market
- Growing demand for microgrids and distributed generation.
- Increasing adoption of blockchain technology for energy trading.
- Expansion into developing economies with limited electricity access.
- Development of innovative solutions for energy storage and management.
Growth Accelerators in the Digital Power Generation Market Industry
Technological breakthroughs in areas like AI and edge computing, coupled with strategic partnerships between technology companies and energy providers, are significantly accelerating market growth. Expansion into new geographical markets, particularly developing countries, and the development of innovative solutions for integrating renewable energy sources are further propelling market expansion. Government policies and initiatives supporting renewable energy and grid modernization act as additional catalysts.
Key Players Shaping the Digital Power Generation Market Market
- ABB Ltd
- Wipro Limited
- Accenture PLC
- IBM Corporation
- Capgemini SE
- Siemens AG
- Infosys Limited
- Microsoft Corporation
- General Electric Company
- SAP SE
Notable Milestones in Digital Power Generation Market Sector
- March 2021: ABB reaches 5 GW cumulative mark in PLC-based solar plant automation solutions in India.
- September 2021: Infosys Ltd and Microsoft Corp. sign a multi-year deal with Ausgrid for cloud transformation.
- October 2021: SP Group partners to develop Singapore's first national grid digital twin.
In-Depth Digital Power Generation Market Market Outlook
The digital power generation market is poised for continued strong growth, driven by the ongoing global transition to cleaner energy sources and the increasing need for efficient and reliable power grids. Strategic partnerships, technological innovation, and government support will be key factors shaping the market’s future trajectory. Opportunities exist for companies to develop innovative solutions for integrating renewable energy, optimizing energy storage, and enhancing grid resilience, particularly in emerging markets. The potential for market expansion is significant, offering considerable returns for companies that can effectively leverage emerging technologies and market trends.
Digital Power Generation Market Segmentation
-
1. Technology
- 1.1. Integrated Solutions
- 1.2. Hardware
-
2. Sector
- 2.1. Power Generation
- 2.2. Transmission and Distribution (T&D)
- 2.3. Energy Storage
- 2.4. Energy Trading
Digital Power Generation Market Segmentation By Geography
- 1. North America
- 2. Europe
- 3. Asia Pacific
- 4. South America
- 5. Middle East
Digital Power Generation Market REPORT HIGHLIGHTS
| Aspects | Details |
|---|---|
| Study Period | 2019-2033 |
| Base Year | 2024 |
| Estimated Year | 2025 |
| Forecast Period | 2025-2033 |
| Historical Period | 2019-2024 |
| Growth Rate | CAGR of > 5.80% from 2019-2033 |
| Segmentation |
|
Table of Contents
- 1. Introduction
- 1.1. Research Scope
- 1.2. Market Segmentation
- 1.3. Research Methodology
- 1.4. Definitions and Assumptions
- 2. Executive Summary
- 2.1. Introduction
- 3. Market Dynamics
- 3.1. Introduction
- 3.2. Market Drivers
- 3.2.1. 4.; Supportive Government Policies and Incentives4.; Environmental Concerns
- 3.3. Market Restrains
- 3.3.1. 4.; Fossil Fuel Subsidies
- 3.4. Market Trends
- 3.4.1. Power Generation Segment to Witness Significant Growth
- 4. Market Factor Analysis
- 4.1. Porters Five Forces
- 4.2. Supply/Value Chain
- 4.3. PESTEL analysis
- 4.4. Market Entropy
- 4.5. Patent/Trademark Analysis
- 5. Global Digital Power Generation Market Analysis, Insights and Forecast, 2019-2031
- 5.1. Market Analysis, Insights and Forecast - by Technology
- 5.1.1. Integrated Solutions
- 5.1.2. Hardware
- 5.2. Market Analysis, Insights and Forecast - by Sector
- 5.2.1. Power Generation
- 5.2.2. Transmission and Distribution (T&D)
- 5.2.3. Energy Storage
- 5.2.4. Energy Trading
- 5.3. Market Analysis, Insights and Forecast - by Region
- 5.3.1. North America
- 5.3.2. Europe
- 5.3.3. Asia Pacific
- 5.3.4. South America
- 5.3.5. Middle East
- 5.1. Market Analysis, Insights and Forecast - by Technology
- 6. North America Digital Power Generation Market Analysis, Insights and Forecast, 2019-2031
- 6.1. Market Analysis, Insights and Forecast - by Technology
- 6.1.1. Integrated Solutions
- 6.1.2. Hardware
- 6.2. Market Analysis, Insights and Forecast - by Sector
- 6.2.1. Power Generation
- 6.2.2. Transmission and Distribution (T&D)
- 6.2.3. Energy Storage
- 6.2.4. Energy Trading
- 6.1. Market Analysis, Insights and Forecast - by Technology
- 7. Europe Digital Power Generation Market Analysis, Insights and Forecast, 2019-2031
- 7.1. Market Analysis, Insights and Forecast - by Technology
- 7.1.1. Integrated Solutions
- 7.1.2. Hardware
- 7.2. Market Analysis, Insights and Forecast - by Sector
- 7.2.1. Power Generation
- 7.2.2. Transmission and Distribution (T&D)
- 7.2.3. Energy Storage
- 7.2.4. Energy Trading
- 7.1. Market Analysis, Insights and Forecast - by Technology
- 8. Asia Pacific Digital Power Generation Market Analysis, Insights and Forecast, 2019-2031
- 8.1. Market Analysis, Insights and Forecast - by Technology
- 8.1.1. Integrated Solutions
- 8.1.2. Hardware
- 8.2. Market Analysis, Insights and Forecast - by Sector
- 8.2.1. Power Generation
- 8.2.2. Transmission and Distribution (T&D)
- 8.2.3. Energy Storage
- 8.2.4. Energy Trading
- 8.1. Market Analysis, Insights and Forecast - by Technology
- 9. South America Digital Power Generation Market Analysis, Insights and Forecast, 2019-2031
- 9.1. Market Analysis, Insights and Forecast - by Technology
- 9.1.1. Integrated Solutions
- 9.1.2. Hardware
- 9.2. Market Analysis, Insights and Forecast - by Sector
- 9.2.1. Power Generation
- 9.2.2. Transmission and Distribution (T&D)
- 9.2.3. Energy Storage
- 9.2.4. Energy Trading
- 9.1. Market Analysis, Insights and Forecast - by Technology
- 10. Middle East Digital Power Generation Market Analysis, Insights and Forecast, 2019-2031
- 10.1. Market Analysis, Insights and Forecast - by Technology
- 10.1.1. Integrated Solutions
- 10.1.2. Hardware
- 10.2. Market Analysis, Insights and Forecast - by Sector
- 10.2.1. Power Generation
- 10.2.2. Transmission and Distribution (T&D)
- 10.2.3. Energy Storage
- 10.2.4. Energy Trading
- 10.1. Market Analysis, Insights and Forecast - by Technology
- 11. North America Digital Power Generation Market Analysis, Insights and Forecast, 2019-2031
- 11.1. Market Analysis, Insights and Forecast - By Country/Sub-region
- 11.1.1 United States
- 11.1.2 Canada
- 11.1.3 Mexico
- 12. Europe Digital Power Generation Market Analysis, Insights and Forecast, 2019-2031
- 12.1. Market Analysis, Insights and Forecast - By Country/Sub-region
- 12.1.1 Germany
- 12.1.2 United Kingdom
- 12.1.3 France
- 12.1.4 Spain
- 12.1.5 Italy
- 12.1.6 Spain
- 12.1.7 Belgium
- 12.1.8 Netherland
- 12.1.9 Nordics
- 12.1.10 Rest of Europe
- 13. Asia Pacific Digital Power Generation Market Analysis, Insights and Forecast, 2019-2031
- 13.1. Market Analysis, Insights and Forecast - By Country/Sub-region
- 13.1.1 China
- 13.1.2 Japan
- 13.1.3 India
- 13.1.4 South Korea
- 13.1.5 Southeast Asia
- 13.1.6 Australia
- 13.1.7 Indonesia
- 13.1.8 Phillipes
- 13.1.9 Singapore
- 13.1.10 Thailandc
- 13.1.11 Rest of Asia Pacific
- 14. South America Digital Power Generation Market Analysis, Insights and Forecast, 2019-2031
- 14.1. Market Analysis, Insights and Forecast - By Country/Sub-region
- 14.1.1 Brazil
- 14.1.2 Argentina
- 14.1.3 Peru
- 14.1.4 Chile
- 14.1.5 Colombia
- 14.1.6 Ecuador
- 14.1.7 Venezuela
- 14.1.8 Rest of South America
- 15. North America Digital Power Generation Market Analysis, Insights and Forecast, 2019-2031
- 15.1. Market Analysis, Insights and Forecast - By Country/Sub-region
- 15.1.1 United States
- 15.1.2 Canada
- 15.1.3 Mexico
- 16. MEA Digital Power Generation Market Analysis, Insights and Forecast, 2019-2031
- 16.1. Market Analysis, Insights and Forecast - By Country/Sub-region
- 16.1.1 United Arab Emirates
- 16.1.2 Saudi Arabia
- 16.1.3 South Africa
- 16.1.4 Rest of Middle East and Africa
- 17. Competitive Analysis
- 17.1. Global Market Share Analysis 2024
- 17.2. Company Profiles
- 17.2.1 ABB Ltd
- 17.2.1.1. Overview
- 17.2.1.2. Products
- 17.2.1.3. SWOT Analysis
- 17.2.1.4. Recent Developments
- 17.2.1.5. Financials (Based on Availability)
- 17.2.2 Wipro Limited
- 17.2.2.1. Overview
- 17.2.2.2. Products
- 17.2.2.3. SWOT Analysis
- 17.2.2.4. Recent Developments
- 17.2.2.5. Financials (Based on Availability)
- 17.2.3 Accenture PLC
- 17.2.3.1. Overview
- 17.2.3.2. Products
- 17.2.3.3. SWOT Analysis
- 17.2.3.4. Recent Developments
- 17.2.3.5. Financials (Based on Availability)
- 17.2.4 IBM Corporation
- 17.2.4.1. Overview
- 17.2.4.2. Products
- 17.2.4.3. SWOT Analysis
- 17.2.4.4. Recent Developments
- 17.2.4.5. Financials (Based on Availability)
- 17.2.5 Capgemini SE
- 17.2.5.1. Overview
- 17.2.5.2. Products
- 17.2.5.3. SWOT Analysis
- 17.2.5.4. Recent Developments
- 17.2.5.5. Financials (Based on Availability)
- 17.2.6 Siemens AG
- 17.2.6.1. Overview
- 17.2.6.2. Products
- 17.2.6.3. SWOT Analysis
- 17.2.6.4. Recent Developments
- 17.2.6.5. Financials (Based on Availability)
- 17.2.7 Infosys Limited
- 17.2.7.1. Overview
- 17.2.7.2. Products
- 17.2.7.3. SWOT Analysis
- 17.2.7.4. Recent Developments
- 17.2.7.5. Financials (Based on Availability)
- 17.2.8 Microsoft Corporation
- 17.2.8.1. Overview
- 17.2.8.2. Products
- 17.2.8.3. SWOT Analysis
- 17.2.8.4. Recent Developments
- 17.2.8.5. Financials (Based on Availability)
- 17.2.9 General Electric Company
- 17.2.9.1. Overview
- 17.2.9.2. Products
- 17.2.9.3. SWOT Analysis
- 17.2.9.4. Recent Developments
- 17.2.9.5. Financials (Based on Availability)
- 17.2.10 SAP SE
- 17.2.10.1. Overview
- 17.2.10.2. Products
- 17.2.10.3. SWOT Analysis
- 17.2.10.4. Recent Developments
- 17.2.10.5. Financials (Based on Availability)
- 17.2.1 ABB Ltd
List of Figures
- Figure 1: Global Digital Power Generation Market Revenue Breakdown (Million, %) by Region 2024 & 2032
- Figure 2: North America Digital Power Generation Market Revenue (Million), by Country 2024 & 2032
- Figure 3: North America Digital Power Generation Market Revenue Share (%), by Country 2024 & 2032
- Figure 4: Europe Digital Power Generation Market Revenue (Million), by Country 2024 & 2032
- Figure 5: Europe Digital Power Generation Market Revenue Share (%), by Country 2024 & 2032
- Figure 6: Asia Pacific Digital Power Generation Market Revenue (Million), by Country 2024 & 2032
- Figure 7: Asia Pacific Digital Power Generation Market Revenue Share (%), by Country 2024 & 2032
- Figure 8: South America Digital Power Generation Market Revenue (Million), by Country 2024 & 2032
- Figure 9: South America Digital Power Generation Market Revenue Share (%), by Country 2024 & 2032
- Figure 10: North America Digital Power Generation Market Revenue (Million), by Country 2024 & 2032
- Figure 11: North America Digital Power Generation Market Revenue Share (%), by Country 2024 & 2032
- Figure 12: MEA Digital Power Generation Market Revenue (Million), by Country 2024 & 2032
- Figure 13: MEA Digital Power Generation Market Revenue Share (%), by Country 2024 & 2032
- Figure 14: North America Digital Power Generation Market Revenue (Million), by Technology 2024 & 2032
- Figure 15: North America Digital Power Generation Market Revenue Share (%), by Technology 2024 & 2032
- Figure 16: North America Digital Power Generation Market Revenue (Million), by Sector 2024 & 2032
- Figure 17: North America Digital Power Generation Market Revenue Share (%), by Sector 2024 & 2032
- Figure 18: North America Digital Power Generation Market Revenue (Million), by Country 2024 & 2032
- Figure 19: North America Digital Power Generation Market Revenue Share (%), by Country 2024 & 2032
- Figure 20: Europe Digital Power Generation Market Revenue (Million), by Technology 2024 & 2032
- Figure 21: Europe Digital Power Generation Market Revenue Share (%), by Technology 2024 & 2032
- Figure 22: Europe Digital Power Generation Market Revenue (Million), by Sector 2024 & 2032
- Figure 23: Europe Digital Power Generation Market Revenue Share (%), by Sector 2024 & 2032
- Figure 24: Europe Digital Power Generation Market Revenue (Million), by Country 2024 & 2032
- Figure 25: Europe Digital Power Generation Market Revenue Share (%), by Country 2024 & 2032
- Figure 26: Asia Pacific Digital Power Generation Market Revenue (Million), by Technology 2024 & 2032
- Figure 27: Asia Pacific Digital Power Generation Market Revenue Share (%), by Technology 2024 & 2032
- Figure 28: Asia Pacific Digital Power Generation Market Revenue (Million), by Sector 2024 & 2032
- Figure 29: Asia Pacific Digital Power Generation Market Revenue Share (%), by Sector 2024 & 2032
- Figure 30: Asia Pacific Digital Power Generation Market Revenue (Million), by Country 2024 & 2032
- Figure 31: Asia Pacific Digital Power Generation Market Revenue Share (%), by Country 2024 & 2032
- Figure 32: South America Digital Power Generation Market Revenue (Million), by Technology 2024 & 2032
- Figure 33: South America Digital Power Generation Market Revenue Share (%), by Technology 2024 & 2032
- Figure 34: South America Digital Power Generation Market Revenue (Million), by Sector 2024 & 2032
- Figure 35: South America Digital Power Generation Market Revenue Share (%), by Sector 2024 & 2032
- Figure 36: South America Digital Power Generation Market Revenue (Million), by Country 2024 & 2032
- Figure 37: South America Digital Power Generation Market Revenue Share (%), by Country 2024 & 2032
- Figure 38: Middle East Digital Power Generation Market Revenue (Million), by Technology 2024 & 2032
- Figure 39: Middle East Digital Power Generation Market Revenue Share (%), by Technology 2024 & 2032
- Figure 40: Middle East Digital Power Generation Market Revenue (Million), by Sector 2024 & 2032
- Figure 41: Middle East Digital Power Generation Market Revenue Share (%), by Sector 2024 & 2032
- Figure 42: Middle East Digital Power Generation Market Revenue (Million), by Country 2024 & 2032
- Figure 43: Middle East Digital Power Generation Market Revenue Share (%), by Country 2024 & 2032
List of Tables
- Table 1: Global Digital Power Generation Market Revenue Million Forecast, by Region 2019 & 2032
- Table 2: Global Digital Power Generation Market Revenue Million Forecast, by Technology 2019 & 2032
- Table 3: Global Digital Power Generation Market Revenue Million Forecast, by Sector 2019 & 2032
- Table 4: Global Digital Power Generation Market Revenue Million Forecast, by Region 2019 & 2032
- Table 5: Global Digital Power Generation Market Revenue Million Forecast, by Country 2019 & 2032
- Table 6: United States Digital Power Generation Market Revenue (Million) Forecast, by Application 2019 & 2032
- Table 7: Canada Digital Power Generation Market Revenue (Million) Forecast, by Application 2019 & 2032
- Table 8: Mexico Digital Power Generation Market Revenue (Million) Forecast, by Application 2019 & 2032
- Table 9: Global Digital Power Generation Market Revenue Million Forecast, by Country 2019 & 2032
- Table 10: Germany Digital Power Generation Market Revenue (Million) Forecast, by Application 2019 & 2032
- Table 11: United Kingdom Digital Power Generation Market Revenue (Million) Forecast, by Application 2019 & 2032
- Table 12: France Digital Power Generation Market Revenue (Million) Forecast, by Application 2019 & 2032
- Table 13: Spain Digital Power Generation Market Revenue (Million) Forecast, by Application 2019 & 2032
- Table 14: Italy Digital Power Generation Market Revenue (Million) Forecast, by Application 2019 & 2032
- Table 15: Spain Digital Power Generation Market Revenue (Million) Forecast, by Application 2019 & 2032
- Table 16: Belgium Digital Power Generation Market Revenue (Million) Forecast, by Application 2019 & 2032
- Table 17: Netherland Digital Power Generation Market Revenue (Million) Forecast, by Application 2019 & 2032
- Table 18: Nordics Digital Power Generation Market Revenue (Million) Forecast, by Application 2019 & 2032
- Table 19: Rest of Europe Digital Power Generation Market Revenue (Million) Forecast, by Application 2019 & 2032
- Table 20: Global Digital Power Generation Market Revenue Million Forecast, by Country 2019 & 2032
- Table 21: China Digital Power Generation Market Revenue (Million) Forecast, by Application 2019 & 2032
- Table 22: Japan Digital Power Generation Market Revenue (Million) Forecast, by Application 2019 & 2032
- Table 23: India Digital Power Generation Market Revenue (Million) Forecast, by Application 2019 & 2032
- Table 24: South Korea Digital Power Generation Market Revenue (Million) Forecast, by Application 2019 & 2032
- Table 25: Southeast Asia Digital Power Generation Market Revenue (Million) Forecast, by Application 2019 & 2032
- Table 26: Australia Digital Power Generation Market Revenue (Million) Forecast, by Application 2019 & 2032
- Table 27: Indonesia Digital Power Generation Market Revenue (Million) Forecast, by Application 2019 & 2032
- Table 28: Phillipes Digital Power Generation Market Revenue (Million) Forecast, by Application 2019 & 2032
- Table 29: Singapore Digital Power Generation Market Revenue (Million) Forecast, by Application 2019 & 2032
- Table 30: Thailandc Digital Power Generation Market Revenue (Million) Forecast, by Application 2019 & 2032
- Table 31: Rest of Asia Pacific Digital Power Generation Market Revenue (Million) Forecast, by Application 2019 & 2032
- Table 32: Global Digital Power Generation Market Revenue Million Forecast, by Country 2019 & 2032
- Table 33: Brazil Digital Power Generation Market Revenue (Million) Forecast, by Application 2019 & 2032
- Table 34: Argentina Digital Power Generation Market Revenue (Million) Forecast, by Application 2019 & 2032
- Table 35: Peru Digital Power Generation Market Revenue (Million) Forecast, by Application 2019 & 2032
- Table 36: Chile Digital Power Generation Market Revenue (Million) Forecast, by Application 2019 & 2032
- Table 37: Colombia Digital Power Generation Market Revenue (Million) Forecast, by Application 2019 & 2032
- Table 38: Ecuador Digital Power Generation Market Revenue (Million) Forecast, by Application 2019 & 2032
- Table 39: Venezuela Digital Power Generation Market Revenue (Million) Forecast, by Application 2019 & 2032
- Table 40: Rest of South America Digital Power Generation Market Revenue (Million) Forecast, by Application 2019 & 2032
- Table 41: Global Digital Power Generation Market Revenue Million Forecast, by Country 2019 & 2032
- Table 42: United States Digital Power Generation Market Revenue (Million) Forecast, by Application 2019 & 2032
- Table 43: Canada Digital Power Generation Market Revenue (Million) Forecast, by Application 2019 & 2032
- Table 44: Mexico Digital Power Generation Market Revenue (Million) Forecast, by Application 2019 & 2032
- Table 45: Global Digital Power Generation Market Revenue Million Forecast, by Country 2019 & 2032
- Table 46: United Arab Emirates Digital Power Generation Market Revenue (Million) Forecast, by Application 2019 & 2032
- Table 47: Saudi Arabia Digital Power Generation Market Revenue (Million) Forecast, by Application 2019 & 2032
- Table 48: South Africa Digital Power Generation Market Revenue (Million) Forecast, by Application 2019 & 2032
- Table 49: Rest of Middle East and Africa Digital Power Generation Market Revenue (Million) Forecast, by Application 2019 & 2032
- Table 50: Global Digital Power Generation Market Revenue Million Forecast, by Technology 2019 & 2032
- Table 51: Global Digital Power Generation Market Revenue Million Forecast, by Sector 2019 & 2032
- Table 52: Global Digital Power Generation Market Revenue Million Forecast, by Country 2019 & 2032
- Table 53: Global Digital Power Generation Market Revenue Million Forecast, by Technology 2019 & 2032
- Table 54: Global Digital Power Generation Market Revenue Million Forecast, by Sector 2019 & 2032
- Table 55: Global Digital Power Generation Market Revenue Million Forecast, by Country 2019 & 2032
- Table 56: Global Digital Power Generation Market Revenue Million Forecast, by Technology 2019 & 2032
- Table 57: Global Digital Power Generation Market Revenue Million Forecast, by Sector 2019 & 2032
- Table 58: Global Digital Power Generation Market Revenue Million Forecast, by Country 2019 & 2032
- Table 59: Global Digital Power Generation Market Revenue Million Forecast, by Technology 2019 & 2032
- Table 60: Global Digital Power Generation Market Revenue Million Forecast, by Sector 2019 & 2032
- Table 61: Global Digital Power Generation Market Revenue Million Forecast, by Country 2019 & 2032
- Table 62: Global Digital Power Generation Market Revenue Million Forecast, by Technology 2019 & 2032
- Table 63: Global Digital Power Generation Market Revenue Million Forecast, by Sector 2019 & 2032
- Table 64: Global Digital Power Generation Market Revenue Million Forecast, by Country 2019 & 2032
Frequently Asked Questions
1. What is the projected Compound Annual Growth Rate (CAGR) of the Digital Power Generation Market?
The projected CAGR is approximately > 5.80%.
2. Which companies are prominent players in the Digital Power Generation Market?
Key companies in the market include ABB Ltd, Wipro Limited, Accenture PLC, IBM Corporation, Capgemini SE, Siemens AG, Infosys Limited, Microsoft Corporation, General Electric Company, SAP SE.
3. What are the main segments of the Digital Power Generation Market?
The market segments include Technology, Sector.
4. Can you provide details about the market size?
The market size is estimated to be USD XX Million as of 2022.
5. What are some drivers contributing to market growth?
4.; Supportive Government Policies and Incentives4.; Environmental Concerns.
6. What are the notable trends driving market growth?
Power Generation Segment to Witness Significant Growth.
7. Are there any restraints impacting market growth?
4.; Fossil Fuel Subsidies.
8. Can you provide examples of recent developments in the market?
In March 2021, ABB reached the cumulative 5-gigawatt (GW) mark in providing Programmable Logic Controller-based (PLC) solar plant automation solutions in India.
9. What pricing options are available for accessing the report?
Pricing options include single-user, multi-user, and enterprise licenses priced at USD 4750, USD 5250, and USD 8750 respectively.
10. Is the market size provided in terms of value or volume?
The market size is provided in terms of value, measured in Million.
11. Are there any specific market keywords associated with the report?
Yes, the market keyword associated with the report is "Digital Power Generation Market," which aids in identifying and referencing the specific market segment covered.
12. How do I determine which pricing option suits my needs best?
The pricing options vary based on user requirements and access needs. Individual users may opt for single-user licenses, while businesses requiring broader access may choose multi-user or enterprise licenses for cost-effective access to the report.
13. Are there any additional resources or data provided in the Digital Power Generation Market report?
While the report offers comprehensive insights, it's advisable to review the specific contents or supplementary materials provided to ascertain if additional resources or data are available.
14. How can I stay updated on further developments or reports in the Digital Power Generation Market?
To stay informed about further developments, trends, and reports in the Digital Power Generation Market, consider subscribing to industry newsletters, following relevant companies and organizations, or regularly checking reputable industry news sources and publications.
Methodology
Step 1 - Identification of Relevant Samples Size from Population Database


Step 2 - Approaches for Defining Global Market Size (Value, Volume* & Price*)

Note*: In applicable scenarios
Step 3 - Data Sources
Primary Research
- Web Analytics
- Survey Reports
- Research Institute
- Latest Research Reports
- Opinion Leaders
Secondary Research
- Annual Reports
- White Paper
- Latest Press Release
- Industry Association
- Paid Database
- Investor Presentations

Step 4 - Data Triangulation
Involves using different sources of information in order to increase the validity of a study
These sources are likely to be stakeholders in a program - participants, other researchers, program staff, other community members, and so on.
Then we put all data in single framework & apply various statistical tools to find out the dynamic on the market.
During the analysis stage, feedback from the stakeholder groups would be compared to determine areas of agreement as well as areas of divergence
