

Key Insights
The edge analytics market is experiencing robust growth, projected to reach a substantial size driven by the increasing need for real-time data processing and insights at the source of data generation. The market's Compound Annual Growth Rate (CAGR) of 24.64% from 2019 to 2024 indicates a significant upward trajectory, fueled by several key factors. The rise of IoT devices generating massive volumes of data necessitates processing closer to the source to minimize latency and bandwidth consumption. Furthermore, industries like manufacturing, BFSI, and healthcare are increasingly adopting edge analytics to improve operational efficiency, enhance security, and gain a competitive edge through predictive maintenance and real-time risk assessment. The cloud-based deployment model is gaining traction due to its scalability and cost-effectiveness, while solutions focusing on AI and machine learning are driving innovation and demand. However, challenges such as data security concerns, the complexity of implementing edge computing infrastructure, and the lack of skilled professionals could potentially impede market growth.
Despite these challenges, the market's future outlook remains positive. The ongoing development of advanced technologies like 5G and improved edge computing hardware will further accelerate adoption. The shift towards autonomous systems in various industries, including manufacturing and transportation, will create a strong demand for real-time analytics at the edge. The expansion into new sectors and geographic regions, particularly in Asia-Pacific, will also contribute to market growth. Key players are actively investing in research and development, strategic partnerships, and acquisitions to strengthen their market position and capitalize on the burgeoning opportunities presented by this dynamic market. The competition is expected to intensify further as established technology companies and specialized edge analytics providers vie for market share. This growth, while considerable, needs to be carefully managed to mitigate the potential risks associated with data security and infrastructure complexities.
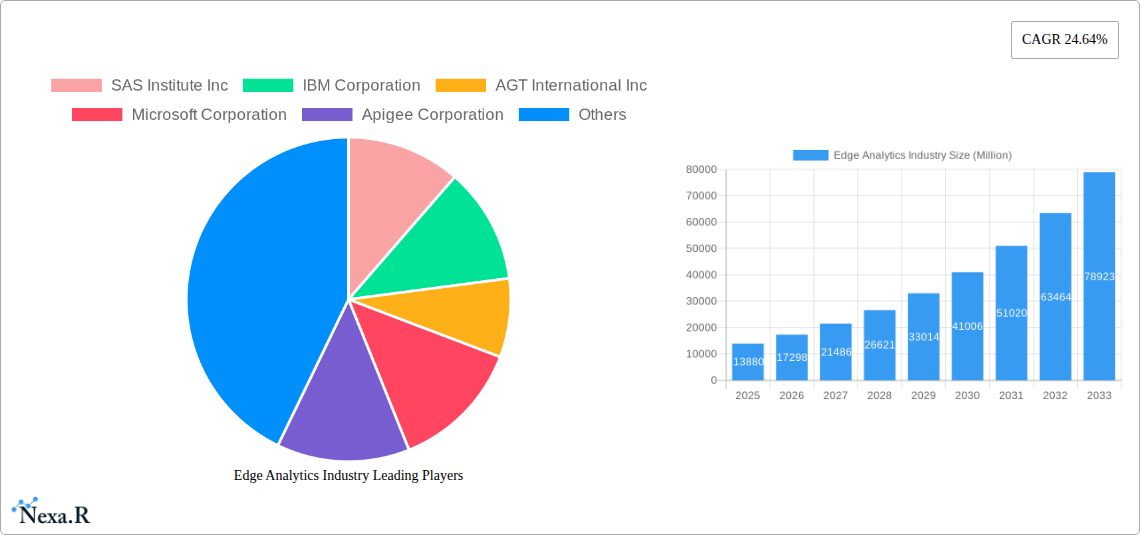
This comprehensive report provides a detailed analysis of the Edge Analytics industry, encompassing market dynamics, growth trends, regional dominance, product landscape, challenges, opportunities, and key players. The report covers the period from 2019 to 2033, with a focus on 2025 as the base and estimated year. The study analyzes the parent market of Analytics and its child market, Edge Analytics, offering valuable insights for industry professionals, investors, and stakeholders. The market is projected to reach xx Million by 2033.
Edge Analytics Industry Market Dynamics & Structure
The Edge Analytics market is characterized by a moderately concentrated structure, with a few major players holding significant market share. However, the market is experiencing rapid growth driven by technological innovations such as AI and IoT, increasing adoption across various end-user industries, and the rising need for real-time data processing and analysis at the edge of the network. Regulatory frameworks vary by region, impacting data privacy and security. The market witnesses significant M&A activity, with companies strategically expanding their product portfolios and market reach. Competitive substitutes include traditional cloud-based analytics solutions, but the unique advantages of edge analytics—such as low latency and improved bandwidth efficiency—are fueling its growth.
- Market Concentration: Moderately concentrated, with top 5 players holding approximately xx% market share in 2024.
- Technological Innovation Drivers: AI, IoT, 5G, and advancements in edge computing hardware.
- Regulatory Frameworks: Vary by region, influencing data privacy and security compliance.
- Competitive Product Substitutes: Cloud-based analytics solutions.
- End-User Demographics: Growing adoption across diverse sectors, particularly BFSI, IT & Telecom, and Manufacturing.
- M&A Trends: Significant increase in M&A activity in recent years, with xx deals recorded in 2024.
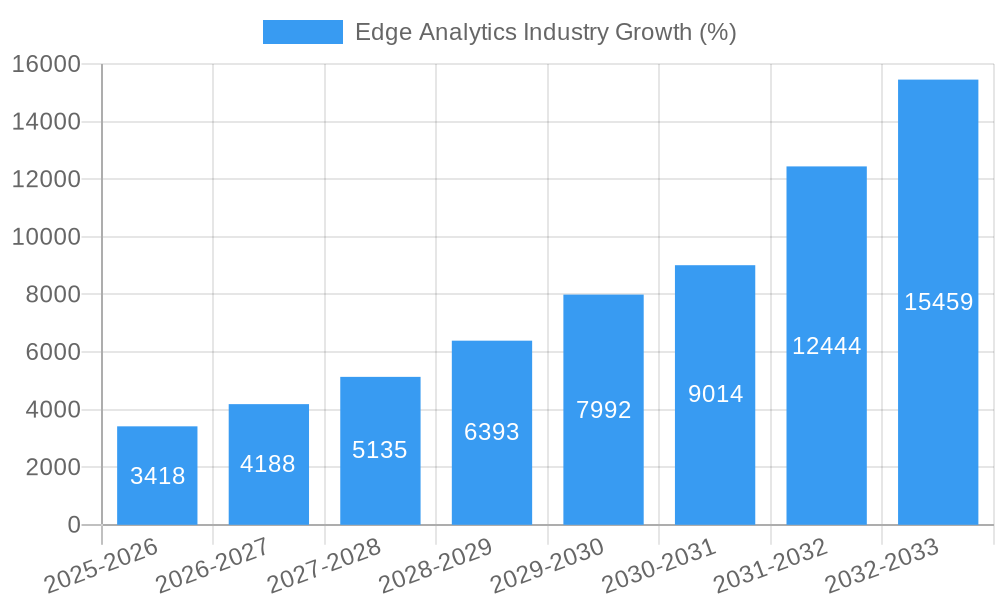
Edge Analytics Industry Growth Trends & Insights
The Edge Analytics market exhibited substantial growth during the historical period (2019-2024), driven by increasing demand for real-time insights and the proliferation of IoT devices. This trend is expected to continue throughout the forecast period (2025-2033), with a Compound Annual Growth Rate (CAGR) of xx% projected. Market penetration is expected to increase from xx% in 2024 to xx% by 2033. Technological disruptions, such as the advancements in edge computing hardware and AI algorithms are accelerating market growth. Consumer behavior shifts towards data-driven decision-making also play a significant role. The adoption of edge analytics is being driven by the need for faster processing of large amounts of data, improved security, and reduced latency.
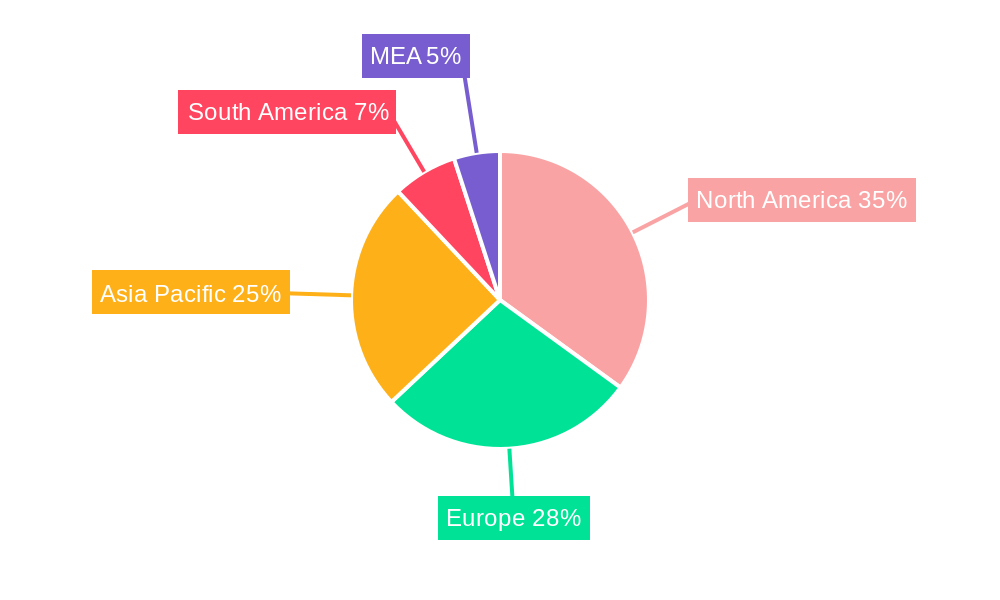
Dominant Regions, Countries, or Segments in Edge Analytics Industry
North America currently dominates the Edge Analytics market, followed by Europe and Asia-Pacific. Within these regions, specific countries like the United States, Germany, and Japan are leading the adoption of edge analytics solutions. The Cloud deployment type holds a dominant position, driven by scalability, cost-effectiveness, and ease of management. In terms of components, Solutions segment is currently larger than Services, though the Services segment is demonstrating faster growth. The BFSI, IT & Telecommunication, and Manufacturing end-user industries are significant contributors to market growth, with BFSI showing particularly high adoption due to the need for real-time fraud detection and risk management.
- Key Drivers (North America): Strong IT infrastructure, high technological advancements, and early adoption of innovative technologies.
- Key Drivers (Europe): Growing focus on data privacy regulations, increased government investments in digital infrastructure, and the high penetration of IoT devices.
- Key Drivers (Asia-Pacific): Rapid industrialization, rising disposable incomes, and increasing adoption of cloud-based services.
- Segment Dominance: Cloud deployment (xx% market share), Solutions (xx% market share), BFSI (xx% market share).
Edge Analytics Industry Product Landscape
The Edge Analytics product landscape is characterized by a diverse range of solutions, including hardware, software, and services. These solutions cater to various applications, from real-time data processing and analysis to predictive maintenance and anomaly detection. Key product innovations focus on improving performance, scalability, and security. Technological advancements are continuously enhancing the efficiency and effectiveness of edge analytics solutions. Unique selling propositions often include low latency, improved data security, and increased operational efficiency.
Key Drivers, Barriers & Challenges in Edge Analytics Industry
Key Drivers: The primary drivers include the increasing adoption of IoT devices, the need for real-time data processing, advancements in AI and machine learning, and the growing demand for improved data security and privacy. Government initiatives to promote digital transformation also play a significant role. The increasing volume and velocity of data is driving the need for more efficient processing capabilities.
Key Challenges: Significant challenges include the high cost of implementation, lack of skilled professionals, and concerns about data security and privacy. Integration complexities between existing systems and edge analytics solutions also pose a barrier. The limited standardization in edge computing technologies poses further challenges. Supply chain disruptions and global economic uncertainties impact the availability of necessary components.
Emerging Opportunities in Edge Analytics Industry
Emerging opportunities include expanding into untapped markets, particularly in developing countries, and catering to new applications such as smart cities, autonomous vehicles, and industrial automation. The increasing demand for real-time data analysis in various sectors creates new opportunities for edge analytics providers. The development of innovative solutions that address specific industry needs will be crucial for success. Focus on developing tailored solutions for specific industry verticals holds immense potential.
Growth Accelerators in the Edge Analytics Industry
Long-term growth will be driven by technological breakthroughs in areas such as AI, 5G, and edge computing. Strategic partnerships between technology providers and end-user industries will play a crucial role. Market expansion strategies, particularly in emerging economies, will unlock significant growth potential. The increasing adoption of cloud-based edge analytics solutions is expected to fuel long-term growth.
Key Players Shaping the Edge Analytics Industry Market
- SAS Institute Inc
- IBM Corporation
- AGT International Inc
- Microsoft Corporation
- Apigee Corporation
- Cisco Systems Inc
- Greenwave Systems
- Oracle Corporation
- Predixion Software
- Foghorn Systems
- CGI Group Inc
- Intel Corporation
Notable Milestones in Edge Analytics Industry Sector
- September 2022: Kyndryl and Elastic announce an expanded global partnership to provide full-stack observability across hybrid and multi-cloud environments, enhancing edge analytics capabilities. This significantly boosts the market’s focus on hybrid and multi-cloud observability.
- November 2022: ZS's investment in and partnership with Abacus Insights accelerates the adoption of edge analytics in healthcare, improving data usability and achieving key health plan goals. This signifies a substantial push for edge analytics in the healthcare sector.
- November 2022: The Water Tower's partnership with Olea Edge AnalyticsTM focuses on developing innovative water-related technologies, highlighting the growing application of edge analytics in the water management sector. This demonstrates an expansion of edge analytics into niche applications.
In-Depth Edge Analytics Industry Market Outlook
The future of the Edge Analytics market looks exceptionally promising. Continued technological advancements, strategic partnerships, and expansion into new markets will drive substantial growth. The increasing demand for real-time insights and the rising adoption of IoT devices across various sectors will fuel market expansion. Opportunities exist in developing tailored solutions for specific industry needs and leveraging the potential of emerging technologies to improve efficiency, security, and scalability. The market is poised for significant growth throughout the forecast period, driven by ongoing innovation and increasing demand.
Edge Analytics Industry Segmentation
-
1. Deployment Type
- 1.1. On-Premises
- 1.2. Cloud
-
2. Component
- 2.1. Solutions
- 2.2. Services (Professional and Managed Services)
-
3. End User Industry
- 3.1. Banking, Financial Services, and Insurance (BFSI)
- 3.2. IT and Telecommunication
- 3.3. Manufacturing
- 3.4. Healthcare
- 3.5. Retail
- 3.6. Other End-user Industry
Edge Analytics Industry Segmentation By Geography
-
1. North America
- 1.1. United States
- 1.2. Canada
-
2. Europe
- 2.1. United Kingdom
- 2.2. Germany
- 2.3. France
- 2.4. Rest of Europe
-
3. Asia Pacific
- 3.1. Japan
- 3.2. China
- 3.3. India
- 3.4. Rest of Asia Pacific
- 4. Latin America
- 5. Middle East and Africa
Edge Analytics Industry REPORT HIGHLIGHTS
| Aspects | Details |
|---|---|
| Study Period | 2019-2033 |
| Base Year | 2024 |
| Estimated Year | 2025 |
| Forecast Period | 2025-2033 |
| Historical Period | 2019-2024 |
| Growth Rate | CAGR of 24.64% from 2019-2033 |
| Segmentation |
|
Table of Contents
- 1. Introduction
- 1.1. Research Scope
- 1.2. Market Segmentation
- 1.3. Research Methodology
- 1.4. Definitions and Assumptions
- 2. Executive Summary
- 2.1. Introduction
- 3. Market Dynamics
- 3.1. Introduction
- 3.2. Market Drivers
- 3.2.1. Growth in Number of Connected Devices in IoT; Rising Propagation of Data Over Connected Devices
- 3.3. Market Restrains
- 3.3.1. Adoption of Edge Technology in Nascent stage; Threat of Data Safety and Security
- 3.4. Market Trends
- 3.4.1. Rising Propagation of Data Over Connected Devices Drives the Market Growth
- 4. Market Factor Analysis
- 4.1. Porters Five Forces
- 4.2. Supply/Value Chain
- 4.3. PESTEL analysis
- 4.4. Market Entropy
- 4.5. Patent/Trademark Analysis
- 5. Global Edge Analytics Industry Analysis, Insights and Forecast, 2019-2031
- 5.1. Market Analysis, Insights and Forecast - by Deployment Type
- 5.1.1. On-Premises
- 5.1.2. Cloud
- 5.2. Market Analysis, Insights and Forecast - by Component
- 5.2.1. Solutions
- 5.2.2. Services (Professional and Managed Services)
- 5.3. Market Analysis, Insights and Forecast - by End User Industry
- 5.3.1. Banking, Financial Services, and Insurance (BFSI)
- 5.3.2. IT and Telecommunication
- 5.3.3. Manufacturing
- 5.3.4. Healthcare
- 5.3.5. Retail
- 5.3.6. Other End-user Industry
- 5.4. Market Analysis, Insights and Forecast - by Region
- 5.4.1. North America
- 5.4.2. Europe
- 5.4.3. Asia Pacific
- 5.4.4. Latin America
- 5.4.5. Middle East and Africa
- 5.1. Market Analysis, Insights and Forecast - by Deployment Type
- 6. North America Edge Analytics Industry Analysis, Insights and Forecast, 2019-2031
- 6.1. Market Analysis, Insights and Forecast - by Deployment Type
- 6.1.1. On-Premises
- 6.1.2. Cloud
- 6.2. Market Analysis, Insights and Forecast - by Component
- 6.2.1. Solutions
- 6.2.2. Services (Professional and Managed Services)
- 6.3. Market Analysis, Insights and Forecast - by End User Industry
- 6.3.1. Banking, Financial Services, and Insurance (BFSI)
- 6.3.2. IT and Telecommunication
- 6.3.3. Manufacturing
- 6.3.4. Healthcare
- 6.3.5. Retail
- 6.3.6. Other End-user Industry
- 6.1. Market Analysis, Insights and Forecast - by Deployment Type
- 7. Europe Edge Analytics Industry Analysis, Insights and Forecast, 2019-2031
- 7.1. Market Analysis, Insights and Forecast - by Deployment Type
- 7.1.1. On-Premises
- 7.1.2. Cloud
- 7.2. Market Analysis, Insights and Forecast - by Component
- 7.2.1. Solutions
- 7.2.2. Services (Professional and Managed Services)
- 7.3. Market Analysis, Insights and Forecast - by End User Industry
- 7.3.1. Banking, Financial Services, and Insurance (BFSI)
- 7.3.2. IT and Telecommunication
- 7.3.3. Manufacturing
- 7.3.4. Healthcare
- 7.3.5. Retail
- 7.3.6. Other End-user Industry
- 7.1. Market Analysis, Insights and Forecast - by Deployment Type
- 8. Asia Pacific Edge Analytics Industry Analysis, Insights and Forecast, 2019-2031
- 8.1. Market Analysis, Insights and Forecast - by Deployment Type
- 8.1.1. On-Premises
- 8.1.2. Cloud
- 8.2. Market Analysis, Insights and Forecast - by Component
- 8.2.1. Solutions
- 8.2.2. Services (Professional and Managed Services)
- 8.3. Market Analysis, Insights and Forecast - by End User Industry
- 8.3.1. Banking, Financial Services, and Insurance (BFSI)
- 8.3.2. IT and Telecommunication
- 8.3.3. Manufacturing
- 8.3.4. Healthcare
- 8.3.5. Retail
- 8.3.6. Other End-user Industry
- 8.1. Market Analysis, Insights and Forecast - by Deployment Type
- 9. Latin America Edge Analytics Industry Analysis, Insights and Forecast, 2019-2031
- 9.1. Market Analysis, Insights and Forecast - by Deployment Type
- 9.1.1. On-Premises
- 9.1.2. Cloud
- 9.2. Market Analysis, Insights and Forecast - by Component
- 9.2.1. Solutions
- 9.2.2. Services (Professional and Managed Services)
- 9.3. Market Analysis, Insights and Forecast - by End User Industry
- 9.3.1. Banking, Financial Services, and Insurance (BFSI)
- 9.3.2. IT and Telecommunication
- 9.3.3. Manufacturing
- 9.3.4. Healthcare
- 9.3.5. Retail
- 9.3.6. Other End-user Industry
- 9.1. Market Analysis, Insights and Forecast - by Deployment Type
- 10. Middle East and Africa Edge Analytics Industry Analysis, Insights and Forecast, 2019-2031
- 10.1. Market Analysis, Insights and Forecast - by Deployment Type
- 10.1.1. On-Premises
- 10.1.2. Cloud
- 10.2. Market Analysis, Insights and Forecast - by Component
- 10.2.1. Solutions
- 10.2.2. Services (Professional and Managed Services)
- 10.3. Market Analysis, Insights and Forecast - by End User Industry
- 10.3.1. Banking, Financial Services, and Insurance (BFSI)
- 10.3.2. IT and Telecommunication
- 10.3.3. Manufacturing
- 10.3.4. Healthcare
- 10.3.5. Retail
- 10.3.6. Other End-user Industry
- 10.1. Market Analysis, Insights and Forecast - by Deployment Type
- 11. North America Edge Analytics Industry Analysis, Insights and Forecast, 2019-2031
- 11.1. Market Analysis, Insights and Forecast - By Country/Sub-region
- 11.1.1 United States
- 11.1.2 Canada
- 11.1.3 Mexico
- 12. Europe Edge Analytics Industry Analysis, Insights and Forecast, 2019-2031
- 12.1. Market Analysis, Insights and Forecast - By Country/Sub-region
- 12.1.1 Germany
- 12.1.2 United Kingdom
- 12.1.3 France
- 12.1.4 Spain
- 12.1.5 Italy
- 12.1.6 Spain
- 12.1.7 Belgium
- 12.1.8 Netherland
- 12.1.9 Nordics
- 12.1.10 Rest of Europe
- 13. Asia Pacific Edge Analytics Industry Analysis, Insights and Forecast, 2019-2031
- 13.1. Market Analysis, Insights and Forecast - By Country/Sub-region
- 13.1.1 China
- 13.1.2 Japan
- 13.1.3 India
- 13.1.4 South Korea
- 13.1.5 Southeast Asia
- 13.1.6 Australia
- 13.1.7 Indonesia
- 13.1.8 Phillipes
- 13.1.9 Singapore
- 13.1.10 Thailandc
- 13.1.11 Rest of Asia Pacific
- 14. South America Edge Analytics Industry Analysis, Insights and Forecast, 2019-2031
- 14.1. Market Analysis, Insights and Forecast - By Country/Sub-region
- 14.1.1 Brazil
- 14.1.2 Argentina
- 14.1.3 Peru
- 14.1.4 Chile
- 14.1.5 Colombia
- 14.1.6 Ecuador
- 14.1.7 Venezuela
- 14.1.8 Rest of South America
- 15. North America Edge Analytics Industry Analysis, Insights and Forecast, 2019-2031
- 15.1. Market Analysis, Insights and Forecast - By Country/Sub-region
- 15.1.1 United States
- 15.1.2 Canada
- 15.1.3 Mexico
- 16. MEA Edge Analytics Industry Analysis, Insights and Forecast, 2019-2031
- 16.1. Market Analysis, Insights and Forecast - By Country/Sub-region
- 16.1.1 United Arab Emirates
- 16.1.2 Saudi Arabia
- 16.1.3 South Africa
- 16.1.4 Rest of Middle East and Africa
- 17. Competitive Analysis
- 17.1. Global Market Share Analysis 2024
- 17.2. Company Profiles
- 17.2.1 SAS Institute Inc
- 17.2.1.1. Overview
- 17.2.1.2. Products
- 17.2.1.3. SWOT Analysis
- 17.2.1.4. Recent Developments
- 17.2.1.5. Financials (Based on Availability)
- 17.2.2 IBM Corporation
- 17.2.2.1. Overview
- 17.2.2.2. Products
- 17.2.2.3. SWOT Analysis
- 17.2.2.4. Recent Developments
- 17.2.2.5. Financials (Based on Availability)
- 17.2.3 AGT International Inc
- 17.2.3.1. Overview
- 17.2.3.2. Products
- 17.2.3.3. SWOT Analysis
- 17.2.3.4. Recent Developments
- 17.2.3.5. Financials (Based on Availability)
- 17.2.4 Microsoft Corporation
- 17.2.4.1. Overview
- 17.2.4.2. Products
- 17.2.4.3. SWOT Analysis
- 17.2.4.4. Recent Developments
- 17.2.4.5. Financials (Based on Availability)
- 17.2.5 Apigee Corporation
- 17.2.5.1. Overview
- 17.2.5.2. Products
- 17.2.5.3. SWOT Analysis
- 17.2.5.4. Recent Developments
- 17.2.5.5. Financials (Based on Availability)
- 17.2.6 Cisco Systems Inc
- 17.2.6.1. Overview
- 17.2.6.2. Products
- 17.2.6.3. SWOT Analysis
- 17.2.6.4. Recent Developments
- 17.2.6.5. Financials (Based on Availability)
- 17.2.7 Greenwave Systems
- 17.2.7.1. Overview
- 17.2.7.2. Products
- 17.2.7.3. SWOT Analysis
- 17.2.7.4. Recent Developments
- 17.2.7.5. Financials (Based on Availability)
- 17.2.8 Oracle Corporation
- 17.2.8.1. Overview
- 17.2.8.2. Products
- 17.2.8.3. SWOT Analysis
- 17.2.8.4. Recent Developments
- 17.2.8.5. Financials (Based on Availability)
- 17.2.9 Predixion Software
- 17.2.9.1. Overview
- 17.2.9.2. Products
- 17.2.9.3. SWOT Analysis
- 17.2.9.4. Recent Developments
- 17.2.9.5. Financials (Based on Availability)
- 17.2.10 Foghorn Systems
- 17.2.10.1. Overview
- 17.2.10.2. Products
- 17.2.10.3. SWOT Analysis
- 17.2.10.4. Recent Developments
- 17.2.10.5. Financials (Based on Availability)
- 17.2.11 CGI Group Inc
- 17.2.11.1. Overview
- 17.2.11.2. Products
- 17.2.11.3. SWOT Analysis
- 17.2.11.4. Recent Developments
- 17.2.11.5. Financials (Based on Availability)
- 17.2.12 Intel Corporation
- 17.2.12.1. Overview
- 17.2.12.2. Products
- 17.2.12.3. SWOT Analysis
- 17.2.12.4. Recent Developments
- 17.2.12.5. Financials (Based on Availability)
- 17.2.1 SAS Institute Inc
List of Figures
- Figure 1: Global Edge Analytics Industry Revenue Breakdown (Million, %) by Region 2024 & 2032
- Figure 2: North America Edge Analytics Industry Revenue (Million), by Country 2024 & 2032
- Figure 3: North America Edge Analytics Industry Revenue Share (%), by Country 2024 & 2032
- Figure 4: Europe Edge Analytics Industry Revenue (Million), by Country 2024 & 2032
- Figure 5: Europe Edge Analytics Industry Revenue Share (%), by Country 2024 & 2032
- Figure 6: Asia Pacific Edge Analytics Industry Revenue (Million), by Country 2024 & 2032
- Figure 7: Asia Pacific Edge Analytics Industry Revenue Share (%), by Country 2024 & 2032
- Figure 8: South America Edge Analytics Industry Revenue (Million), by Country 2024 & 2032
- Figure 9: South America Edge Analytics Industry Revenue Share (%), by Country 2024 & 2032
- Figure 10: North America Edge Analytics Industry Revenue (Million), by Country 2024 & 2032
- Figure 11: North America Edge Analytics Industry Revenue Share (%), by Country 2024 & 2032
- Figure 12: MEA Edge Analytics Industry Revenue (Million), by Country 2024 & 2032
- Figure 13: MEA Edge Analytics Industry Revenue Share (%), by Country 2024 & 2032
- Figure 14: North America Edge Analytics Industry Revenue (Million), by Deployment Type 2024 & 2032
- Figure 15: North America Edge Analytics Industry Revenue Share (%), by Deployment Type 2024 & 2032
- Figure 16: North America Edge Analytics Industry Revenue (Million), by Component 2024 & 2032
- Figure 17: North America Edge Analytics Industry Revenue Share (%), by Component 2024 & 2032
- Figure 18: North America Edge Analytics Industry Revenue (Million), by End User Industry 2024 & 2032
- Figure 19: North America Edge Analytics Industry Revenue Share (%), by End User Industry 2024 & 2032
- Figure 20: North America Edge Analytics Industry Revenue (Million), by Country 2024 & 2032
- Figure 21: North America Edge Analytics Industry Revenue Share (%), by Country 2024 & 2032
- Figure 22: Europe Edge Analytics Industry Revenue (Million), by Deployment Type 2024 & 2032
- Figure 23: Europe Edge Analytics Industry Revenue Share (%), by Deployment Type 2024 & 2032
- Figure 24: Europe Edge Analytics Industry Revenue (Million), by Component 2024 & 2032
- Figure 25: Europe Edge Analytics Industry Revenue Share (%), by Component 2024 & 2032
- Figure 26: Europe Edge Analytics Industry Revenue (Million), by End User Industry 2024 & 2032
- Figure 27: Europe Edge Analytics Industry Revenue Share (%), by End User Industry 2024 & 2032
- Figure 28: Europe Edge Analytics Industry Revenue (Million), by Country 2024 & 2032
- Figure 29: Europe Edge Analytics Industry Revenue Share (%), by Country 2024 & 2032
- Figure 30: Asia Pacific Edge Analytics Industry Revenue (Million), by Deployment Type 2024 & 2032
- Figure 31: Asia Pacific Edge Analytics Industry Revenue Share (%), by Deployment Type 2024 & 2032
- Figure 32: Asia Pacific Edge Analytics Industry Revenue (Million), by Component 2024 & 2032
- Figure 33: Asia Pacific Edge Analytics Industry Revenue Share (%), by Component 2024 & 2032
- Figure 34: Asia Pacific Edge Analytics Industry Revenue (Million), by End User Industry 2024 & 2032
- Figure 35: Asia Pacific Edge Analytics Industry Revenue Share (%), by End User Industry 2024 & 2032
- Figure 36: Asia Pacific Edge Analytics Industry Revenue (Million), by Country 2024 & 2032
- Figure 37: Asia Pacific Edge Analytics Industry Revenue Share (%), by Country 2024 & 2032
- Figure 38: Latin America Edge Analytics Industry Revenue (Million), by Deployment Type 2024 & 2032
- Figure 39: Latin America Edge Analytics Industry Revenue Share (%), by Deployment Type 2024 & 2032
- Figure 40: Latin America Edge Analytics Industry Revenue (Million), by Component 2024 & 2032
- Figure 41: Latin America Edge Analytics Industry Revenue Share (%), by Component 2024 & 2032
- Figure 42: Latin America Edge Analytics Industry Revenue (Million), by End User Industry 2024 & 2032
- Figure 43: Latin America Edge Analytics Industry Revenue Share (%), by End User Industry 2024 & 2032
- Figure 44: Latin America Edge Analytics Industry Revenue (Million), by Country 2024 & 2032
- Figure 45: Latin America Edge Analytics Industry Revenue Share (%), by Country 2024 & 2032
- Figure 46: Middle East and Africa Edge Analytics Industry Revenue (Million), by Deployment Type 2024 & 2032
- Figure 47: Middle East and Africa Edge Analytics Industry Revenue Share (%), by Deployment Type 2024 & 2032
- Figure 48: Middle East and Africa Edge Analytics Industry Revenue (Million), by Component 2024 & 2032
- Figure 49: Middle East and Africa Edge Analytics Industry Revenue Share (%), by Component 2024 & 2032
- Figure 50: Middle East and Africa Edge Analytics Industry Revenue (Million), by End User Industry 2024 & 2032
- Figure 51: Middle East and Africa Edge Analytics Industry Revenue Share (%), by End User Industry 2024 & 2032
- Figure 52: Middle East and Africa Edge Analytics Industry Revenue (Million), by Country 2024 & 2032
- Figure 53: Middle East and Africa Edge Analytics Industry Revenue Share (%), by Country 2024 & 2032
List of Tables
- Table 1: Global Edge Analytics Industry Revenue Million Forecast, by Region 2019 & 2032
- Table 2: Global Edge Analytics Industry Revenue Million Forecast, by Deployment Type 2019 & 2032
- Table 3: Global Edge Analytics Industry Revenue Million Forecast, by Component 2019 & 2032
- Table 4: Global Edge Analytics Industry Revenue Million Forecast, by End User Industry 2019 & 2032
- Table 5: Global Edge Analytics Industry Revenue Million Forecast, by Region 2019 & 2032
- Table 6: Global Edge Analytics Industry Revenue Million Forecast, by Country 2019 & 2032
- Table 7: United States Edge Analytics Industry Revenue (Million) Forecast, by Application 2019 & 2032
- Table 8: Canada Edge Analytics Industry Revenue (Million) Forecast, by Application 2019 & 2032
- Table 9: Mexico Edge Analytics Industry Revenue (Million) Forecast, by Application 2019 & 2032
- Table 10: Global Edge Analytics Industry Revenue Million Forecast, by Country 2019 & 2032
- Table 11: Germany Edge Analytics Industry Revenue (Million) Forecast, by Application 2019 & 2032
- Table 12: United Kingdom Edge Analytics Industry Revenue (Million) Forecast, by Application 2019 & 2032
- Table 13: France Edge Analytics Industry Revenue (Million) Forecast, by Application 2019 & 2032
- Table 14: Spain Edge Analytics Industry Revenue (Million) Forecast, by Application 2019 & 2032
- Table 15: Italy Edge Analytics Industry Revenue (Million) Forecast, by Application 2019 & 2032
- Table 16: Spain Edge Analytics Industry Revenue (Million) Forecast, by Application 2019 & 2032
- Table 17: Belgium Edge Analytics Industry Revenue (Million) Forecast, by Application 2019 & 2032
- Table 18: Netherland Edge Analytics Industry Revenue (Million) Forecast, by Application 2019 & 2032
- Table 19: Nordics Edge Analytics Industry Revenue (Million) Forecast, by Application 2019 & 2032
- Table 20: Rest of Europe Edge Analytics Industry Revenue (Million) Forecast, by Application 2019 & 2032
- Table 21: Global Edge Analytics Industry Revenue Million Forecast, by Country 2019 & 2032
- Table 22: China Edge Analytics Industry Revenue (Million) Forecast, by Application 2019 & 2032
- Table 23: Japan Edge Analytics Industry Revenue (Million) Forecast, by Application 2019 & 2032
- Table 24: India Edge Analytics Industry Revenue (Million) Forecast, by Application 2019 & 2032
- Table 25: South Korea Edge Analytics Industry Revenue (Million) Forecast, by Application 2019 & 2032
- Table 26: Southeast Asia Edge Analytics Industry Revenue (Million) Forecast, by Application 2019 & 2032
- Table 27: Australia Edge Analytics Industry Revenue (Million) Forecast, by Application 2019 & 2032
- Table 28: Indonesia Edge Analytics Industry Revenue (Million) Forecast, by Application 2019 & 2032
- Table 29: Phillipes Edge Analytics Industry Revenue (Million) Forecast, by Application 2019 & 2032
- Table 30: Singapore Edge Analytics Industry Revenue (Million) Forecast, by Application 2019 & 2032
- Table 31: Thailandc Edge Analytics Industry Revenue (Million) Forecast, by Application 2019 & 2032
- Table 32: Rest of Asia Pacific Edge Analytics Industry Revenue (Million) Forecast, by Application 2019 & 2032
- Table 33: Global Edge Analytics Industry Revenue Million Forecast, by Country 2019 & 2032
- Table 34: Brazil Edge Analytics Industry Revenue (Million) Forecast, by Application 2019 & 2032
- Table 35: Argentina Edge Analytics Industry Revenue (Million) Forecast, by Application 2019 & 2032
- Table 36: Peru Edge Analytics Industry Revenue (Million) Forecast, by Application 2019 & 2032
- Table 37: Chile Edge Analytics Industry Revenue (Million) Forecast, by Application 2019 & 2032
- Table 38: Colombia Edge Analytics Industry Revenue (Million) Forecast, by Application 2019 & 2032
- Table 39: Ecuador Edge Analytics Industry Revenue (Million) Forecast, by Application 2019 & 2032
- Table 40: Venezuela Edge Analytics Industry Revenue (Million) Forecast, by Application 2019 & 2032
- Table 41: Rest of South America Edge Analytics Industry Revenue (Million) Forecast, by Application 2019 & 2032
- Table 42: Global Edge Analytics Industry Revenue Million Forecast, by Country 2019 & 2032
- Table 43: United States Edge Analytics Industry Revenue (Million) Forecast, by Application 2019 & 2032
- Table 44: Canada Edge Analytics Industry Revenue (Million) Forecast, by Application 2019 & 2032
- Table 45: Mexico Edge Analytics Industry Revenue (Million) Forecast, by Application 2019 & 2032
- Table 46: Global Edge Analytics Industry Revenue Million Forecast, by Country 2019 & 2032
- Table 47: United Arab Emirates Edge Analytics Industry Revenue (Million) Forecast, by Application 2019 & 2032
- Table 48: Saudi Arabia Edge Analytics Industry Revenue (Million) Forecast, by Application 2019 & 2032
- Table 49: South Africa Edge Analytics Industry Revenue (Million) Forecast, by Application 2019 & 2032
- Table 50: Rest of Middle East and Africa Edge Analytics Industry Revenue (Million) Forecast, by Application 2019 & 2032
- Table 51: Global Edge Analytics Industry Revenue Million Forecast, by Deployment Type 2019 & 2032
- Table 52: Global Edge Analytics Industry Revenue Million Forecast, by Component 2019 & 2032
- Table 53: Global Edge Analytics Industry Revenue Million Forecast, by End User Industry 2019 & 2032
- Table 54: Global Edge Analytics Industry Revenue Million Forecast, by Country 2019 & 2032
- Table 55: United States Edge Analytics Industry Revenue (Million) Forecast, by Application 2019 & 2032
- Table 56: Canada Edge Analytics Industry Revenue (Million) Forecast, by Application 2019 & 2032
- Table 57: Global Edge Analytics Industry Revenue Million Forecast, by Deployment Type 2019 & 2032
- Table 58: Global Edge Analytics Industry Revenue Million Forecast, by Component 2019 & 2032
- Table 59: Global Edge Analytics Industry Revenue Million Forecast, by End User Industry 2019 & 2032
- Table 60: Global Edge Analytics Industry Revenue Million Forecast, by Country 2019 & 2032
- Table 61: United Kingdom Edge Analytics Industry Revenue (Million) Forecast, by Application 2019 & 2032
- Table 62: Germany Edge Analytics Industry Revenue (Million) Forecast, by Application 2019 & 2032
- Table 63: France Edge Analytics Industry Revenue (Million) Forecast, by Application 2019 & 2032
- Table 64: Rest of Europe Edge Analytics Industry Revenue (Million) Forecast, by Application 2019 & 2032
- Table 65: Global Edge Analytics Industry Revenue Million Forecast, by Deployment Type 2019 & 2032
- Table 66: Global Edge Analytics Industry Revenue Million Forecast, by Component 2019 & 2032
- Table 67: Global Edge Analytics Industry Revenue Million Forecast, by End User Industry 2019 & 2032
- Table 68: Global Edge Analytics Industry Revenue Million Forecast, by Country 2019 & 2032
- Table 69: Japan Edge Analytics Industry Revenue (Million) Forecast, by Application 2019 & 2032
- Table 70: China Edge Analytics Industry Revenue (Million) Forecast, by Application 2019 & 2032
- Table 71: India Edge Analytics Industry Revenue (Million) Forecast, by Application 2019 & 2032
- Table 72: Rest of Asia Pacific Edge Analytics Industry Revenue (Million) Forecast, by Application 2019 & 2032
- Table 73: Global Edge Analytics Industry Revenue Million Forecast, by Deployment Type 2019 & 2032
- Table 74: Global Edge Analytics Industry Revenue Million Forecast, by Component 2019 & 2032
- Table 75: Global Edge Analytics Industry Revenue Million Forecast, by End User Industry 2019 & 2032
- Table 76: Global Edge Analytics Industry Revenue Million Forecast, by Country 2019 & 2032
- Table 77: Global Edge Analytics Industry Revenue Million Forecast, by Deployment Type 2019 & 2032
- Table 78: Global Edge Analytics Industry Revenue Million Forecast, by Component 2019 & 2032
- Table 79: Global Edge Analytics Industry Revenue Million Forecast, by End User Industry 2019 & 2032
- Table 80: Global Edge Analytics Industry Revenue Million Forecast, by Country 2019 & 2032
Frequently Asked Questions
1. What is the projected Compound Annual Growth Rate (CAGR) of the Edge Analytics Industry?
The projected CAGR is approximately 24.64%.
2. Which companies are prominent players in the Edge Analytics Industry?
Key companies in the market include SAS Institute Inc, IBM Corporation, AGT International Inc, Microsoft Corporation, Apigee Corporation, Cisco Systems Inc, Greenwave Systems, Oracle Corporation, Predixion Software, Foghorn Systems, CGI Group Inc, Intel Corporation.
3. What are the main segments of the Edge Analytics Industry?
The market segments include Deployment Type, Component, End User Industry.
4. Can you provide details about the market size?
The market size is estimated to be USD 13.88 Million as of 2022.
5. What are some drivers contributing to market growth?
Growth in Number of Connected Devices in IoT; Rising Propagation of Data Over Connected Devices.
6. What are the notable trends driving market growth?
Rising Propagation of Data Over Connected Devices Drives the Market Growth.
7. Are there any restraints impacting market growth?
Adoption of Edge Technology in Nascent stage; Threat of Data Safety and Security.
8. Can you provide examples of recent developments in the market?
November 2022 - The Water Tower (TWT) has announced a new Transformational Partnership with Olea Edge AnalyticsTM, an Austin-based digital innovation firm. Olea is the member of TWT's new transformational partnership level, which aims to create innovative water-related technologies.
9. What pricing options are available for accessing the report?
Pricing options include single-user, multi-user, and enterprise licenses priced at USD 4750, USD 5250, and USD 8750 respectively.
10. Is the market size provided in terms of value or volume?
The market size is provided in terms of value, measured in Million.
11. Are there any specific market keywords associated with the report?
Yes, the market keyword associated with the report is "Edge Analytics Industry," which aids in identifying and referencing the specific market segment covered.
12. How do I determine which pricing option suits my needs best?
The pricing options vary based on user requirements and access needs. Individual users may opt for single-user licenses, while businesses requiring broader access may choose multi-user or enterprise licenses for cost-effective access to the report.
13. Are there any additional resources or data provided in the Edge Analytics Industry report?
While the report offers comprehensive insights, it's advisable to review the specific contents or supplementary materials provided to ascertain if additional resources or data are available.
14. How can I stay updated on further developments or reports in the Edge Analytics Industry?
To stay informed about further developments, trends, and reports in the Edge Analytics Industry, consider subscribing to industry newsletters, following relevant companies and organizations, or regularly checking reputable industry news sources and publications.
Methodology
Step 1 - Identification of Relevant Samples Size from Population Database


Step 2 - Approaches for Defining Global Market Size (Value, Volume* & Price*)

Note*: In applicable scenarios
Step 3 - Data Sources
Primary Research
- Web Analytics
- Survey Reports
- Research Institute
- Latest Research Reports
- Opinion Leaders
Secondary Research
- Annual Reports
- White Paper
- Latest Press Release
- Industry Association
- Paid Database
- Investor Presentations

Step 4 - Data Triangulation
Involves using different sources of information in order to increase the validity of a study
These sources are likely to be stakeholders in a program - participants, other researchers, program staff, other community members, and so on.
Then we put all data in single framework & apply various statistical tools to find out the dynamic on the market.
During the analysis stage, feedback from the stakeholder groups would be compared to determine areas of agreement as well as areas of divergence
