

Key Insights
The North American optical sensor market is experiencing robust growth, driven by increasing automation across various sectors and advancements in sensor technology. The market's Compound Annual Growth Rate (CAGR) of 8.10% from 2019-2033 indicates a significant expansion, projected to reach a substantial market value. Key drivers include the escalating demand for precise and efficient automation in industries like automotive, medical, and aerospace & defense. The integration of optical sensors in advanced driver-assistance systems (ADAS) and autonomous vehicles is fueling significant growth within the automotive sector. Furthermore, the rising adoption of optical sensors in medical imaging and diagnostics, specifically in minimally invasive surgeries and disease detection, is contributing significantly to market expansion. The increasing need for sophisticated process control and monitoring in industrial applications further solidifies the market's upward trajectory. Technological advancements such as hyperspectral imaging and near-infrared spectroscopy are improving sensor capabilities, leading to wider applications and higher market penetration.
While the market faces challenges such as high initial investment costs for advanced sensor technologies and the need for skilled professionals for integration and maintenance, these are expected to be outweighed by the substantial benefits offered by optical sensors. The market segmentation reveals a strong presence across various sensor types, including fiber optic sensors, image sensors, and InGaAs sensors, each catering to specific application requirements. North America dominates the market due to its strong technological base and high adoption rate in various end-use sectors. While precise regional breakdowns are unavailable, it's reasonable to assume that the United States holds a larger market share than Canada due to its larger industrial and technological landscape. Future growth will be significantly influenced by continued technological innovation, government regulations promoting automation, and the increasing focus on improving efficiency and precision in multiple sectors.
North America Optical Sensors Market Report: 2019-2033
This comprehensive report provides an in-depth analysis of the North America optical sensors market, encompassing market dynamics, growth trends, regional segmentation, product landscape, key drivers and barriers, emerging opportunities, and key players. The study period covers 2019-2033, with a base year of 2025 and a forecast period of 2025-2033. The market is segmented by technology (Hyperspectral imaging, Near IR Spectroscopy, Photo-Acoustic Tomography, Optical Coherence Tomography), sensor type (Fiber Optic Sensors, Image Sensors, Position Sensors, Ambient Light and Proximity Sensors, Extended InGaAs Sensors: Infrared Sensors, Other Sensors), application (Commercial, Consumer Electronics, Medical, Automotive, Industrial, Aerospace & Defence, Optocouplers, Isolation Amplifier Optocouplers, Others), and country (United States, Canada). The market is expected to reach xx Million units by 2033.
North America Optical Sensors Market Market Dynamics & Structure
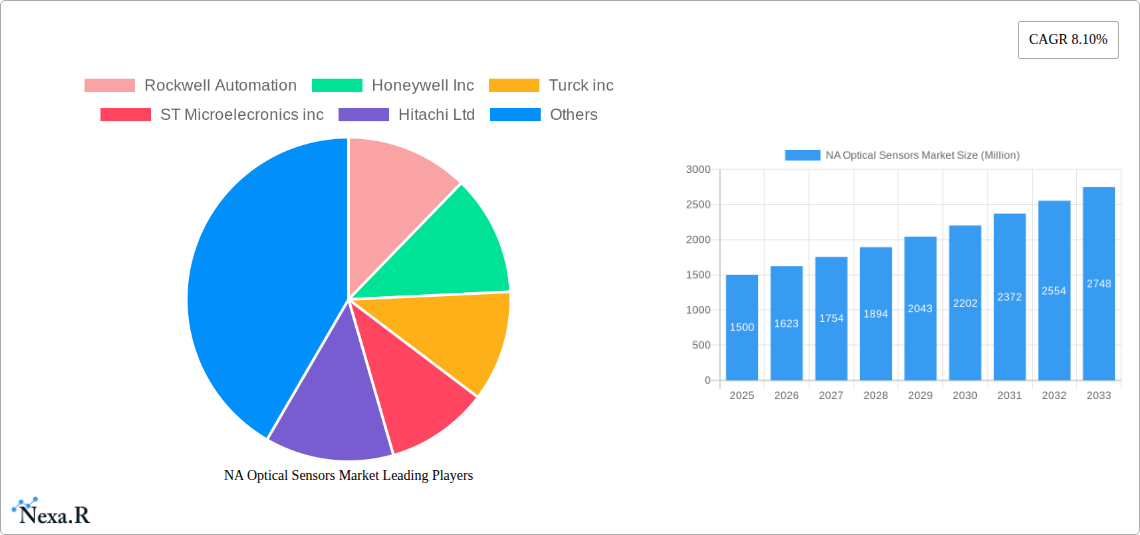
The North American optical sensor market exhibits a moderately consolidated structure with key players like Rockwell Automation, Honeywell Inc, and Sick AG holding significant market share. The market is characterized by rapid technological innovation, particularly in areas like hyperspectral imaging and quantum sensing. Stringent regulatory frameworks, especially concerning safety and performance standards in automotive and medical applications, influence market growth. Competition from alternative sensing technologies (e.g., ultrasonic sensors) presents a challenge. The end-user demographics are diverse, spanning across various industries, with the automotive and industrial sectors being major consumers. M&A activity has been moderate in recent years, with strategic partnerships becoming more prevalent than outright acquisitions. The market value was estimated to be xx Million units in 2024.
- Market Concentration: Moderately Consolidated (xx% market share held by top 5 players).
- Technological Innovation: High, driven by advancements in hyperspectral imaging, quantum sensing, and miniaturization.
- Regulatory Landscape: Stringent regulations in automotive, medical, and industrial sectors.
- Competitive Substitutes: Ultrasonic sensors, radar sensors.
- M&A Activity: Moderate, with increased focus on strategic partnerships.
- Innovation Barriers: High R&D costs, stringent regulatory approvals.
NA Optical Sensors Market Growth Trends & Insights
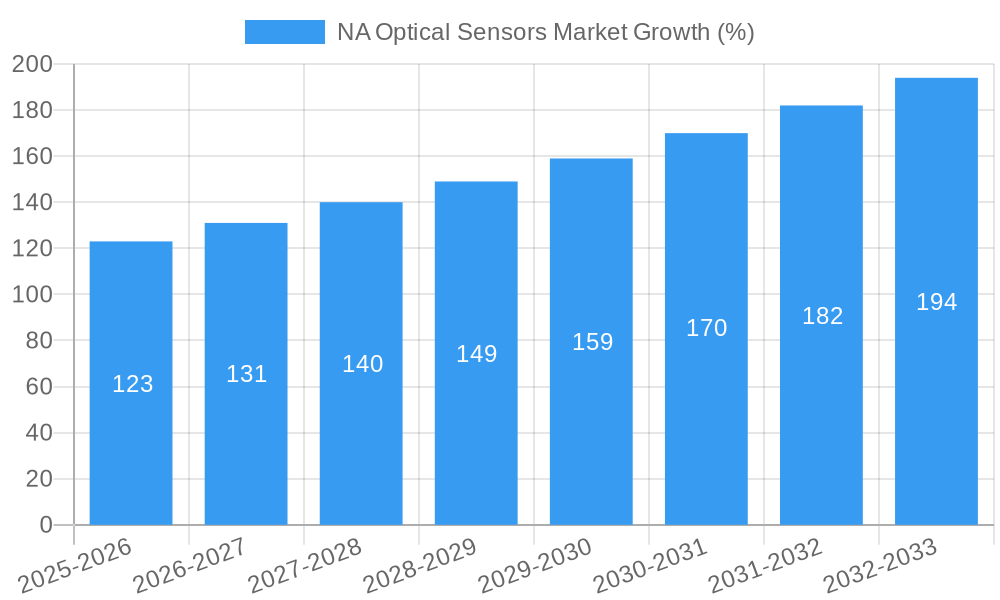
The North American optical sensors market is experiencing robust growth, driven by increasing demand across various applications. The market size witnessed a CAGR of xx% during 2019-2024 and is projected to continue expanding at a CAGR of xx% from 2025 to 2033. This growth is fueled by several factors, including the increasing adoption of automation in industrial settings, the proliferation of consumer electronics incorporating advanced sensing capabilities, and the expansion of the medical diagnostics and automotive industries. Technological advancements such as miniaturization, enhanced sensitivity, and improved integration capabilities are further stimulating market growth. The adoption rate of advanced optical sensors is increasing significantly across diverse sectors. Consumer preference for sophisticated features in electronics and growing demand for accurate and efficient sensing solutions in various applications are key growth stimulants. Furthermore, the market is witnessing a shift towards integrated optical sensor systems and sophisticated functionalities.
- Market Size (2024): xx Million units
- CAGR (2019-2024): xx%
- CAGR (2025-2033): xx%
- Market Penetration: xx% in key application segments.
Dominant Regions, Countries, or Segments in NA Optical Sensors Market
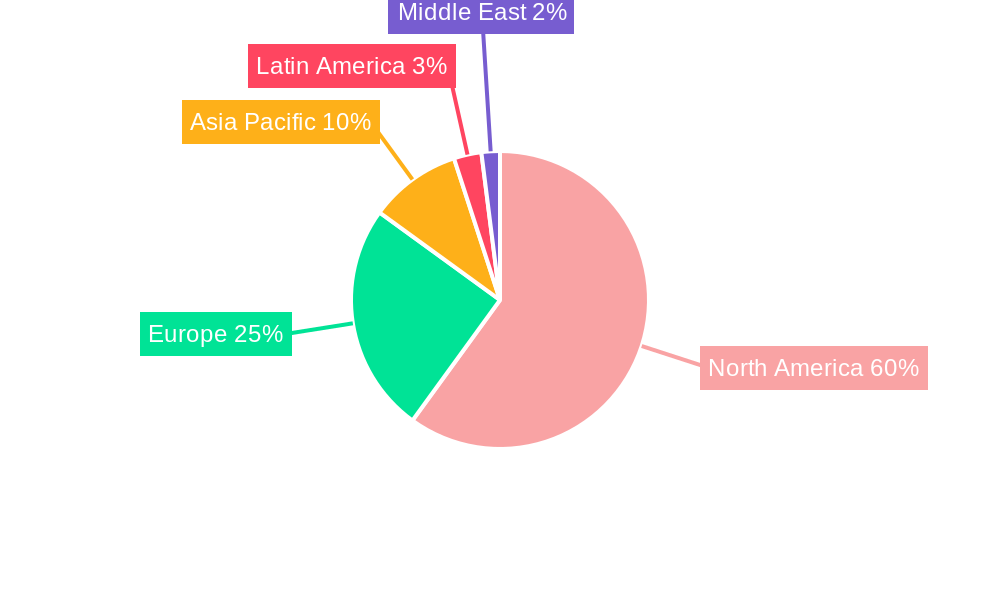
The United States dominates the North American optical sensors market, driven by a strong industrial base, robust technological advancements, and significant investments in research and development. Canada is also experiencing notable growth, primarily due to its growing automotive and industrial sectors. Within the segments, the industrial application segment displays significant market share, closely followed by automotive and medical applications. Hyperspectral imaging and fiber optic sensors are leading in the technology and sensor type segments respectively.
- Leading Region: United States
- Key Drivers in US: Strong industrial base, high R&D investment, technological advancements.
- Key Drivers in Canada: Growing automotive and industrial sectors, government support for technology adoption.
- Leading Application Segment: Industrial (xx% market share)
- Leading Technology Segment: Hyperspectral imaging (xx% market share)
- Leading Sensor Type Segment: Fiber Optic Sensors (xx% market share)
NA Optical Sensors Market Product Landscape
The North American optical sensors market offers a wide array of products, characterized by continuous innovation in performance, miniaturization, and functionality. New products are emerging with enhanced sensitivity, wider spectral ranges, and improved integration capabilities. Key features include higher accuracy, faster response times, improved durability, and better resistance to environmental factors. This constant drive toward improved efficiency and performance is a major factor driving the market's growth trajectory. Manufacturers are also focusing on developing cost-effective solutions while enhancing the precision and reliability of their offerings.
Key Drivers, Barriers & Challenges in NA Optical Sensors Market
Key Drivers:
- Increased automation across industries.
- Growing demand for advanced sensing in consumer electronics.
- Rising need for precise measurements in medical and automotive sectors.
- Technological advancements leading to improved performance and cost reduction.
Challenges & Restraints:
- High initial investment costs for advanced sensor technologies.
- Stringent regulatory compliance requirements.
- Competition from alternative sensing technologies.
- Supply chain disruptions due to geopolitical factors impacting component availability (xx% impact estimated).
Emerging Opportunities in NA Optical Sensors Market
- Expanding applications of optical sensors in IoT devices and smart homes.
- Growing demand for high-precision sensors in robotics and autonomous systems.
- Increased adoption of optical sensors in environmental monitoring and industrial process control.
- Development of innovative sensor designs for specific niche applications.
Growth Accelerators in the NA Optical Sensors Market Industry
Strategic partnerships between sensor manufacturers and end-users are accelerating market growth, enabling rapid technology adoption and fostering innovation. Furthermore, continuous research and development efforts are resulting in the development of more efficient and cost-effective sensor solutions. Government initiatives to promote technological advancements and industrial automation are also contributing to market expansion. The increasing integration of AI and machine learning into optical sensor systems enhances their capabilities and expands their application range, fostering further growth.
Key Players Shaping the NA Optical Sensors Market Market
- Rockwell Automation
- Honeywell Inc
- Turck inc
- ST Microelecronics inc
- Hitachi Ltd
- Omnivision Inc
- Sick AG
- Mouser Electronics Inc
- Robert Bosch GmbH
- Atmel Corporation
- Eaton Corporation
Notable Milestones in NA Optical Sensors Market Sector
- November 2020: Trumpf and Sick partnered to develop the first industrial quantum sensor. This development signifies a significant leap in sensing technology, promising higher accuracy and new applications.
- February 2021: Mouser Electronics expanded its environmental sensor offerings, including Sensirion's SPS30 particulate matter optical sensor. This broadened the availability of advanced optical sensors for various applications, such as HVAC and IoT devices.
In-Depth NA Optical Sensors Market Market Outlook
The North American optical sensors market presents significant growth opportunities over the coming years. Continuous technological advancements, strategic collaborations, and rising demand across diverse sectors will drive market expansion. Focus on miniaturization, improved performance, cost reduction, and the development of specialized sensors for niche applications will continue to shape market dynamics. The integration of AI and machine learning into optical sensor systems will enhance capabilities and broaden application areas. This presents lucrative opportunities for companies involved in research, development, manufacturing, and distribution of optical sensors.
NA Optical Sensors Market Segmentation
-
1. Technology
- 1.1. Hyperspectral imaging
- 1.2. Near IR Spectroscopy
- 1.3. Photo-Acoustic Tomography
- 1.4. Optical Coherence Tomography
-
2. Sensor Type
- 2.1. Fiber Optic Sensors
- 2.2. Image Sensors
- 2.3. Position Sensors
-
2.4. Ambient Light and Proximity Sensors
- 2.4.1. Cadmium Sulfide
- 2.4.2. Silicon
- 2.4.3. InGaAs Sensors
- 2.4.4. Extended InGaAs Sensors
- 2.5. Infrared Sensors
- 2.6. Other Sensors
-
3. Applications
- 3.1. Commercial
- 3.2. Consumer Electronics
- 3.3. Medical
- 3.4. Automotive
- 3.5. Industrial
- 3.6. Aerospace & Defence
-
3.7. Optocouplers
- 3.7.1. 4-pin Optocouplers
- 3.7.2. 6-pin Optocouplers
- 3.7.3. High speed optocouplers
- 3.7.4. IGBT gate driver optocouplers
- 3.7.5. Isolation Amplifier Optocouplers
- 3.8. Others
NA Optical Sensors Market Segmentation By Geography
-
1. North America
- 1.1. United States
- 1.2. Canada
- 1.3. Mexico
-
2. South America
- 2.1. Brazil
- 2.2. Argentina
- 2.3. Rest of South America
-
3. Europe
- 3.1. United Kingdom
- 3.2. Germany
- 3.3. France
- 3.4. Italy
- 3.5. Spain
- 3.6. Russia
- 3.7. Benelux
- 3.8. Nordics
- 3.9. Rest of Europe
-
4. Middle East & Africa
- 4.1. Turkey
- 4.2. Israel
- 4.3. GCC
- 4.4. North Africa
- 4.5. South Africa
- 4.6. Rest of Middle East & Africa
-
5. Asia Pacific
- 5.1. China
- 5.2. India
- 5.3. Japan
- 5.4. South Korea
- 5.5. ASEAN
- 5.6. Oceania
- 5.7. Rest of Asia Pacific
NA Optical Sensors Market REPORT HIGHLIGHTS
| Aspects | Details |
|---|---|
| Study Period | 2019-2033 |
| Base Year | 2024 |
| Estimated Year | 2025 |
| Forecast Period | 2025-2033 |
| Historical Period | 2019-2024 |
| Growth Rate | CAGR of 8.10% from 2019-2033 |
| Segmentation |
|
Table of Contents
- 1. Introduction
- 1.1. Research Scope
- 1.2. Market Segmentation
- 1.3. Research Methodology
- 1.4. Definitions and Assumptions
- 2. Executive Summary
- 2.1. Introduction
- 3. Market Dynamics
- 3.1. Introduction
- 3.2. Market Drivers
- 3.2.1. Increasing Market Penetration of Smartphones; Increasing Demand for Power-saving Devices Across Industries; Increasing Market Penetration of Automation Techniques Across Various Industries
- 3.3. Market Restrains
- 3.3.1. Imbalance Between the Image Quality and Price and Lack of standardization; Lack of awareness and acceptability of optical sensors
- 3.4. Market Trends
- 3.4.1. Photoelectric Sensor is Expected to Register a Significant Growth
- 4. Market Factor Analysis
- 4.1. Porters Five Forces
- 4.2. Supply/Value Chain
- 4.3. PESTEL analysis
- 4.4. Market Entropy
- 4.5. Patent/Trademark Analysis
- 5. Global NA Optical Sensors Market Analysis, Insights and Forecast, 2019-2031
- 5.1. Market Analysis, Insights and Forecast - by Technology
- 5.1.1. Hyperspectral imaging
- 5.1.2. Near IR Spectroscopy
- 5.1.3. Photo-Acoustic Tomography
- 5.1.4. Optical Coherence Tomography
- 5.2. Market Analysis, Insights and Forecast - by Sensor Type
- 5.2.1. Fiber Optic Sensors
- 5.2.2. Image Sensors
- 5.2.3. Position Sensors
- 5.2.4. Ambient Light and Proximity Sensors
- 5.2.4.1. Cadmium Sulfide
- 5.2.4.2. Silicon
- 5.2.4.3. InGaAs Sensors
- 5.2.4.4. Extended InGaAs Sensors
- 5.2.5. Infrared Sensors
- 5.2.6. Other Sensors
- 5.3. Market Analysis, Insights and Forecast - by Applications
- 5.3.1. Commercial
- 5.3.2. Consumer Electronics
- 5.3.3. Medical
- 5.3.4. Automotive
- 5.3.5. Industrial
- 5.3.6. Aerospace & Defence
- 5.3.7. Optocouplers
- 5.3.7.1. 4-pin Optocouplers
- 5.3.7.2. 6-pin Optocouplers
- 5.3.7.3. High speed optocouplers
- 5.3.7.4. IGBT gate driver optocouplers
- 5.3.7.5. Isolation Amplifier Optocouplers
- 5.3.8. Others
- 5.4. Market Analysis, Insights and Forecast - by Region
- 5.4.1. North America
- 5.4.2. South America
- 5.4.3. Europe
- 5.4.4. Middle East & Africa
- 5.4.5. Asia Pacific
- 5.1. Market Analysis, Insights and Forecast - by Technology
- 6. North America NA Optical Sensors Market Analysis, Insights and Forecast, 2019-2031
- 6.1. Market Analysis, Insights and Forecast - by Technology
- 6.1.1. Hyperspectral imaging
- 6.1.2. Near IR Spectroscopy
- 6.1.3. Photo-Acoustic Tomography
- 6.1.4. Optical Coherence Tomography
- 6.2. Market Analysis, Insights and Forecast - by Sensor Type
- 6.2.1. Fiber Optic Sensors
- 6.2.2. Image Sensors
- 6.2.3. Position Sensors
- 6.2.4. Ambient Light and Proximity Sensors
- 6.2.4.1. Cadmium Sulfide
- 6.2.4.2. Silicon
- 6.2.4.3. InGaAs Sensors
- 6.2.4.4. Extended InGaAs Sensors
- 6.2.5. Infrared Sensors
- 6.2.6. Other Sensors
- 6.3. Market Analysis, Insights and Forecast - by Applications
- 6.3.1. Commercial
- 6.3.2. Consumer Electronics
- 6.3.3. Medical
- 6.3.4. Automotive
- 6.3.5. Industrial
- 6.3.6. Aerospace & Defence
- 6.3.7. Optocouplers
- 6.3.7.1. 4-pin Optocouplers
- 6.3.7.2. 6-pin Optocouplers
- 6.3.7.3. High speed optocouplers
- 6.3.7.4. IGBT gate driver optocouplers
- 6.3.7.5. Isolation Amplifier Optocouplers
- 6.3.8. Others
- 6.1. Market Analysis, Insights and Forecast - by Technology
- 7. South America NA Optical Sensors Market Analysis, Insights and Forecast, 2019-2031
- 7.1. Market Analysis, Insights and Forecast - by Technology
- 7.1.1. Hyperspectral imaging
- 7.1.2. Near IR Spectroscopy
- 7.1.3. Photo-Acoustic Tomography
- 7.1.4. Optical Coherence Tomography
- 7.2. Market Analysis, Insights and Forecast - by Sensor Type
- 7.2.1. Fiber Optic Sensors
- 7.2.2. Image Sensors
- 7.2.3. Position Sensors
- 7.2.4. Ambient Light and Proximity Sensors
- 7.2.4.1. Cadmium Sulfide
- 7.2.4.2. Silicon
- 7.2.4.3. InGaAs Sensors
- 7.2.4.4. Extended InGaAs Sensors
- 7.2.5. Infrared Sensors
- 7.2.6. Other Sensors
- 7.3. Market Analysis, Insights and Forecast - by Applications
- 7.3.1. Commercial
- 7.3.2. Consumer Electronics
- 7.3.3. Medical
- 7.3.4. Automotive
- 7.3.5. Industrial
- 7.3.6. Aerospace & Defence
- 7.3.7. Optocouplers
- 7.3.7.1. 4-pin Optocouplers
- 7.3.7.2. 6-pin Optocouplers
- 7.3.7.3. High speed optocouplers
- 7.3.7.4. IGBT gate driver optocouplers
- 7.3.7.5. Isolation Amplifier Optocouplers
- 7.3.8. Others
- 7.1. Market Analysis, Insights and Forecast - by Technology
- 8. Europe NA Optical Sensors Market Analysis, Insights and Forecast, 2019-2031
- 8.1. Market Analysis, Insights and Forecast - by Technology
- 8.1.1. Hyperspectral imaging
- 8.1.2. Near IR Spectroscopy
- 8.1.3. Photo-Acoustic Tomography
- 8.1.4. Optical Coherence Tomography
- 8.2. Market Analysis, Insights and Forecast - by Sensor Type
- 8.2.1. Fiber Optic Sensors
- 8.2.2. Image Sensors
- 8.2.3. Position Sensors
- 8.2.4. Ambient Light and Proximity Sensors
- 8.2.4.1. Cadmium Sulfide
- 8.2.4.2. Silicon
- 8.2.4.3. InGaAs Sensors
- 8.2.4.4. Extended InGaAs Sensors
- 8.2.5. Infrared Sensors
- 8.2.6. Other Sensors
- 8.3. Market Analysis, Insights and Forecast - by Applications
- 8.3.1. Commercial
- 8.3.2. Consumer Electronics
- 8.3.3. Medical
- 8.3.4. Automotive
- 8.3.5. Industrial
- 8.3.6. Aerospace & Defence
- 8.3.7. Optocouplers
- 8.3.7.1. 4-pin Optocouplers
- 8.3.7.2. 6-pin Optocouplers
- 8.3.7.3. High speed optocouplers
- 8.3.7.4. IGBT gate driver optocouplers
- 8.3.7.5. Isolation Amplifier Optocouplers
- 8.3.8. Others
- 8.1. Market Analysis, Insights and Forecast - by Technology
- 9. Middle East & Africa NA Optical Sensors Market Analysis, Insights and Forecast, 2019-2031
- 9.1. Market Analysis, Insights and Forecast - by Technology
- 9.1.1. Hyperspectral imaging
- 9.1.2. Near IR Spectroscopy
- 9.1.3. Photo-Acoustic Tomography
- 9.1.4. Optical Coherence Tomography
- 9.2. Market Analysis, Insights and Forecast - by Sensor Type
- 9.2.1. Fiber Optic Sensors
- 9.2.2. Image Sensors
- 9.2.3. Position Sensors
- 9.2.4. Ambient Light and Proximity Sensors
- 9.2.4.1. Cadmium Sulfide
- 9.2.4.2. Silicon
- 9.2.4.3. InGaAs Sensors
- 9.2.4.4. Extended InGaAs Sensors
- 9.2.5. Infrared Sensors
- 9.2.6. Other Sensors
- 9.3. Market Analysis, Insights and Forecast - by Applications
- 9.3.1. Commercial
- 9.3.2. Consumer Electronics
- 9.3.3. Medical
- 9.3.4. Automotive
- 9.3.5. Industrial
- 9.3.6. Aerospace & Defence
- 9.3.7. Optocouplers
- 9.3.7.1. 4-pin Optocouplers
- 9.3.7.2. 6-pin Optocouplers
- 9.3.7.3. High speed optocouplers
- 9.3.7.4. IGBT gate driver optocouplers
- 9.3.7.5. Isolation Amplifier Optocouplers
- 9.3.8. Others
- 9.1. Market Analysis, Insights and Forecast - by Technology
- 10. Asia Pacific NA Optical Sensors Market Analysis, Insights and Forecast, 2019-2031
- 10.1. Market Analysis, Insights and Forecast - by Technology
- 10.1.1. Hyperspectral imaging
- 10.1.2. Near IR Spectroscopy
- 10.1.3. Photo-Acoustic Tomography
- 10.1.4. Optical Coherence Tomography
- 10.2. Market Analysis, Insights and Forecast - by Sensor Type
- 10.2.1. Fiber Optic Sensors
- 10.2.2. Image Sensors
- 10.2.3. Position Sensors
- 10.2.4. Ambient Light and Proximity Sensors
- 10.2.4.1. Cadmium Sulfide
- 10.2.4.2. Silicon
- 10.2.4.3. InGaAs Sensors
- 10.2.4.4. Extended InGaAs Sensors
- 10.2.5. Infrared Sensors
- 10.2.6. Other Sensors
- 10.3. Market Analysis, Insights and Forecast - by Applications
- 10.3.1. Commercial
- 10.3.2. Consumer Electronics
- 10.3.3. Medical
- 10.3.4. Automotive
- 10.3.5. Industrial
- 10.3.6. Aerospace & Defence
- 10.3.7. Optocouplers
- 10.3.7.1. 4-pin Optocouplers
- 10.3.7.2. 6-pin Optocouplers
- 10.3.7.3. High speed optocouplers
- 10.3.7.4. IGBT gate driver optocouplers
- 10.3.7.5. Isolation Amplifier Optocouplers
- 10.3.8. Others
- 10.1. Market Analysis, Insights and Forecast - by Technology
- 11. North America NA Optical Sensors Market Analysis, Insights and Forecast, 2019-2031
- 11.1. Market Analysis, Insights and Forecast - By Country/Sub-region
- 11.1.1.
- 12. Europe NA Optical Sensors Market Analysis, Insights and Forecast, 2019-2031
- 12.1. Market Analysis, Insights and Forecast - By Country/Sub-region
- 12.1.1.
- 13. Asia Pacific NA Optical Sensors Market Analysis, Insights and Forecast, 2019-2031
- 13.1. Market Analysis, Insights and Forecast - By Country/Sub-region
- 13.1.1.
- 14. Latin America NA Optical Sensors Market Analysis, Insights and Forecast, 2019-2031
- 14.1. Market Analysis, Insights and Forecast - By Country/Sub-region
- 14.1.1.
- 15. Middle East NA Optical Sensors Market Analysis, Insights and Forecast, 2019-2031
- 15.1. Market Analysis, Insights and Forecast - By Country/Sub-region
- 15.1.1.
- 16. Competitive Analysis
- 16.1. Global Market Share Analysis 2024
- 16.2. Company Profiles
- 16.2.1 Rockwell Automation
- 16.2.1.1. Overview
- 16.2.1.2. Products
- 16.2.1.3. SWOT Analysis
- 16.2.1.4. Recent Developments
- 16.2.1.5. Financials (Based on Availability)
- 16.2.2 Honeywell Inc
- 16.2.2.1. Overview
- 16.2.2.2. Products
- 16.2.2.3. SWOT Analysis
- 16.2.2.4. Recent Developments
- 16.2.2.5. Financials (Based on Availability)
- 16.2.3 Turck inc
- 16.2.3.1. Overview
- 16.2.3.2. Products
- 16.2.3.3. SWOT Analysis
- 16.2.3.4. Recent Developments
- 16.2.3.5. Financials (Based on Availability)
- 16.2.4 ST Microelecronics inc
- 16.2.4.1. Overview
- 16.2.4.2. Products
- 16.2.4.3. SWOT Analysis
- 16.2.4.4. Recent Developments
- 16.2.4.5. Financials (Based on Availability)
- 16.2.5 Hitachi Ltd
- 16.2.5.1. Overview
- 16.2.5.2. Products
- 16.2.5.3. SWOT Analysis
- 16.2.5.4. Recent Developments
- 16.2.5.5. Financials (Based on Availability)
- 16.2.6 Omnivision Inc
- 16.2.6.1. Overview
- 16.2.6.2. Products
- 16.2.6.3. SWOT Analysis
- 16.2.6.4. Recent Developments
- 16.2.6.5. Financials (Based on Availability)
- 16.2.7 Sick AG
- 16.2.7.1. Overview
- 16.2.7.2. Products
- 16.2.7.3. SWOT Analysis
- 16.2.7.4. Recent Developments
- 16.2.7.5. Financials (Based on Availability)
- 16.2.8 Mouser Electronics Inc
- 16.2.8.1. Overview
- 16.2.8.2. Products
- 16.2.8.3. SWOT Analysis
- 16.2.8.4. Recent Developments
- 16.2.8.5. Financials (Based on Availability)
- 16.2.9 Robert Bosch GmbH
- 16.2.9.1. Overview
- 16.2.9.2. Products
- 16.2.9.3. SWOT Analysis
- 16.2.9.4. Recent Developments
- 16.2.9.5. Financials (Based on Availability)
- 16.2.10 Atmel Corporation
- 16.2.10.1. Overview
- 16.2.10.2. Products
- 16.2.10.3. SWOT Analysis
- 16.2.10.4. Recent Developments
- 16.2.10.5. Financials (Based on Availability)
- 16.2.11 Eaton Corporation
- 16.2.11.1. Overview
- 16.2.11.2. Products
- 16.2.11.3. SWOT Analysis
- 16.2.11.4. Recent Developments
- 16.2.11.5. Financials (Based on Availability)
- 16.2.1 Rockwell Automation
List of Figures
- Figure 1: Global NA Optical Sensors Market Revenue Breakdown (Million, %) by Region 2024 & 2032
- Figure 2: North America NA Optical Sensors Market Revenue (Million), by Country 2024 & 2032
- Figure 3: North America NA Optical Sensors Market Revenue Share (%), by Country 2024 & 2032
- Figure 4: Europe NA Optical Sensors Market Revenue (Million), by Country 2024 & 2032
- Figure 5: Europe NA Optical Sensors Market Revenue Share (%), by Country 2024 & 2032
- Figure 6: Asia Pacific NA Optical Sensors Market Revenue (Million), by Country 2024 & 2032
- Figure 7: Asia Pacific NA Optical Sensors Market Revenue Share (%), by Country 2024 & 2032
- Figure 8: Latin America NA Optical Sensors Market Revenue (Million), by Country 2024 & 2032
- Figure 9: Latin America NA Optical Sensors Market Revenue Share (%), by Country 2024 & 2032
- Figure 10: Middle East NA Optical Sensors Market Revenue (Million), by Country 2024 & 2032
- Figure 11: Middle East NA Optical Sensors Market Revenue Share (%), by Country 2024 & 2032
- Figure 12: North America NA Optical Sensors Market Revenue (Million), by Technology 2024 & 2032
- Figure 13: North America NA Optical Sensors Market Revenue Share (%), by Technology 2024 & 2032
- Figure 14: North America NA Optical Sensors Market Revenue (Million), by Sensor Type 2024 & 2032
- Figure 15: North America NA Optical Sensors Market Revenue Share (%), by Sensor Type 2024 & 2032
- Figure 16: North America NA Optical Sensors Market Revenue (Million), by Applications 2024 & 2032
- Figure 17: North America NA Optical Sensors Market Revenue Share (%), by Applications 2024 & 2032
- Figure 18: North America NA Optical Sensors Market Revenue (Million), by Country 2024 & 2032
- Figure 19: North America NA Optical Sensors Market Revenue Share (%), by Country 2024 & 2032
- Figure 20: South America NA Optical Sensors Market Revenue (Million), by Technology 2024 & 2032
- Figure 21: South America NA Optical Sensors Market Revenue Share (%), by Technology 2024 & 2032
- Figure 22: South America NA Optical Sensors Market Revenue (Million), by Sensor Type 2024 & 2032
- Figure 23: South America NA Optical Sensors Market Revenue Share (%), by Sensor Type 2024 & 2032
- Figure 24: South America NA Optical Sensors Market Revenue (Million), by Applications 2024 & 2032
- Figure 25: South America NA Optical Sensors Market Revenue Share (%), by Applications 2024 & 2032
- Figure 26: South America NA Optical Sensors Market Revenue (Million), by Country 2024 & 2032
- Figure 27: South America NA Optical Sensors Market Revenue Share (%), by Country 2024 & 2032
- Figure 28: Europe NA Optical Sensors Market Revenue (Million), by Technology 2024 & 2032
- Figure 29: Europe NA Optical Sensors Market Revenue Share (%), by Technology 2024 & 2032
- Figure 30: Europe NA Optical Sensors Market Revenue (Million), by Sensor Type 2024 & 2032
- Figure 31: Europe NA Optical Sensors Market Revenue Share (%), by Sensor Type 2024 & 2032
- Figure 32: Europe NA Optical Sensors Market Revenue (Million), by Applications 2024 & 2032
- Figure 33: Europe NA Optical Sensors Market Revenue Share (%), by Applications 2024 & 2032
- Figure 34: Europe NA Optical Sensors Market Revenue (Million), by Country 2024 & 2032
- Figure 35: Europe NA Optical Sensors Market Revenue Share (%), by Country 2024 & 2032
- Figure 36: Middle East & Africa NA Optical Sensors Market Revenue (Million), by Technology 2024 & 2032
- Figure 37: Middle East & Africa NA Optical Sensors Market Revenue Share (%), by Technology 2024 & 2032
- Figure 38: Middle East & Africa NA Optical Sensors Market Revenue (Million), by Sensor Type 2024 & 2032
- Figure 39: Middle East & Africa NA Optical Sensors Market Revenue Share (%), by Sensor Type 2024 & 2032
- Figure 40: Middle East & Africa NA Optical Sensors Market Revenue (Million), by Applications 2024 & 2032
- Figure 41: Middle East & Africa NA Optical Sensors Market Revenue Share (%), by Applications 2024 & 2032
- Figure 42: Middle East & Africa NA Optical Sensors Market Revenue (Million), by Country 2024 & 2032
- Figure 43: Middle East & Africa NA Optical Sensors Market Revenue Share (%), by Country 2024 & 2032
- Figure 44: Asia Pacific NA Optical Sensors Market Revenue (Million), by Technology 2024 & 2032
- Figure 45: Asia Pacific NA Optical Sensors Market Revenue Share (%), by Technology 2024 & 2032
- Figure 46: Asia Pacific NA Optical Sensors Market Revenue (Million), by Sensor Type 2024 & 2032
- Figure 47: Asia Pacific NA Optical Sensors Market Revenue Share (%), by Sensor Type 2024 & 2032
- Figure 48: Asia Pacific NA Optical Sensors Market Revenue (Million), by Applications 2024 & 2032
- Figure 49: Asia Pacific NA Optical Sensors Market Revenue Share (%), by Applications 2024 & 2032
- Figure 50: Asia Pacific NA Optical Sensors Market Revenue (Million), by Country 2024 & 2032
- Figure 51: Asia Pacific NA Optical Sensors Market Revenue Share (%), by Country 2024 & 2032
List of Tables
- Table 1: Global NA Optical Sensors Market Revenue Million Forecast, by Region 2019 & 2032
- Table 2: Global NA Optical Sensors Market Revenue Million Forecast, by Technology 2019 & 2032
- Table 3: Global NA Optical Sensors Market Revenue Million Forecast, by Sensor Type 2019 & 2032
- Table 4: Global NA Optical Sensors Market Revenue Million Forecast, by Applications 2019 & 2032
- Table 5: Global NA Optical Sensors Market Revenue Million Forecast, by Region 2019 & 2032
- Table 6: Global NA Optical Sensors Market Revenue Million Forecast, by Country 2019 & 2032
- Table 7: NA Optical Sensors Market Revenue (Million) Forecast, by Application 2019 & 2032
- Table 8: Global NA Optical Sensors Market Revenue Million Forecast, by Country 2019 & 2032
- Table 9: NA Optical Sensors Market Revenue (Million) Forecast, by Application 2019 & 2032
- Table 10: Global NA Optical Sensors Market Revenue Million Forecast, by Country 2019 & 2032
- Table 11: NA Optical Sensors Market Revenue (Million) Forecast, by Application 2019 & 2032
- Table 12: Global NA Optical Sensors Market Revenue Million Forecast, by Country 2019 & 2032
- Table 13: NA Optical Sensors Market Revenue (Million) Forecast, by Application 2019 & 2032
- Table 14: Global NA Optical Sensors Market Revenue Million Forecast, by Country 2019 & 2032
- Table 15: NA Optical Sensors Market Revenue (Million) Forecast, by Application 2019 & 2032
- Table 16: Global NA Optical Sensors Market Revenue Million Forecast, by Technology 2019 & 2032
- Table 17: Global NA Optical Sensors Market Revenue Million Forecast, by Sensor Type 2019 & 2032
- Table 18: Global NA Optical Sensors Market Revenue Million Forecast, by Applications 2019 & 2032
- Table 19: Global NA Optical Sensors Market Revenue Million Forecast, by Country 2019 & 2032
- Table 20: United States NA Optical Sensors Market Revenue (Million) Forecast, by Application 2019 & 2032
- Table 21: Canada NA Optical Sensors Market Revenue (Million) Forecast, by Application 2019 & 2032
- Table 22: Mexico NA Optical Sensors Market Revenue (Million) Forecast, by Application 2019 & 2032
- Table 23: Global NA Optical Sensors Market Revenue Million Forecast, by Technology 2019 & 2032
- Table 24: Global NA Optical Sensors Market Revenue Million Forecast, by Sensor Type 2019 & 2032
- Table 25: Global NA Optical Sensors Market Revenue Million Forecast, by Applications 2019 & 2032
- Table 26: Global NA Optical Sensors Market Revenue Million Forecast, by Country 2019 & 2032
- Table 27: Brazil NA Optical Sensors Market Revenue (Million) Forecast, by Application 2019 & 2032
- Table 28: Argentina NA Optical Sensors Market Revenue (Million) Forecast, by Application 2019 & 2032
- Table 29: Rest of South America NA Optical Sensors Market Revenue (Million) Forecast, by Application 2019 & 2032
- Table 30: Global NA Optical Sensors Market Revenue Million Forecast, by Technology 2019 & 2032
- Table 31: Global NA Optical Sensors Market Revenue Million Forecast, by Sensor Type 2019 & 2032
- Table 32: Global NA Optical Sensors Market Revenue Million Forecast, by Applications 2019 & 2032
- Table 33: Global NA Optical Sensors Market Revenue Million Forecast, by Country 2019 & 2032
- Table 34: United Kingdom NA Optical Sensors Market Revenue (Million) Forecast, by Application 2019 & 2032
- Table 35: Germany NA Optical Sensors Market Revenue (Million) Forecast, by Application 2019 & 2032
- Table 36: France NA Optical Sensors Market Revenue (Million) Forecast, by Application 2019 & 2032
- Table 37: Italy NA Optical Sensors Market Revenue (Million) Forecast, by Application 2019 & 2032
- Table 38: Spain NA Optical Sensors Market Revenue (Million) Forecast, by Application 2019 & 2032
- Table 39: Russia NA Optical Sensors Market Revenue (Million) Forecast, by Application 2019 & 2032
- Table 40: Benelux NA Optical Sensors Market Revenue (Million) Forecast, by Application 2019 & 2032
- Table 41: Nordics NA Optical Sensors Market Revenue (Million) Forecast, by Application 2019 & 2032
- Table 42: Rest of Europe NA Optical Sensors Market Revenue (Million) Forecast, by Application 2019 & 2032
- Table 43: Global NA Optical Sensors Market Revenue Million Forecast, by Technology 2019 & 2032
- Table 44: Global NA Optical Sensors Market Revenue Million Forecast, by Sensor Type 2019 & 2032
- Table 45: Global NA Optical Sensors Market Revenue Million Forecast, by Applications 2019 & 2032
- Table 46: Global NA Optical Sensors Market Revenue Million Forecast, by Country 2019 & 2032
- Table 47: Turkey NA Optical Sensors Market Revenue (Million) Forecast, by Application 2019 & 2032
- Table 48: Israel NA Optical Sensors Market Revenue (Million) Forecast, by Application 2019 & 2032
- Table 49: GCC NA Optical Sensors Market Revenue (Million) Forecast, by Application 2019 & 2032
- Table 50: North Africa NA Optical Sensors Market Revenue (Million) Forecast, by Application 2019 & 2032
- Table 51: South Africa NA Optical Sensors Market Revenue (Million) Forecast, by Application 2019 & 2032
- Table 52: Rest of Middle East & Africa NA Optical Sensors Market Revenue (Million) Forecast, by Application 2019 & 2032
- Table 53: Global NA Optical Sensors Market Revenue Million Forecast, by Technology 2019 & 2032
- Table 54: Global NA Optical Sensors Market Revenue Million Forecast, by Sensor Type 2019 & 2032
- Table 55: Global NA Optical Sensors Market Revenue Million Forecast, by Applications 2019 & 2032
- Table 56: Global NA Optical Sensors Market Revenue Million Forecast, by Country 2019 & 2032
- Table 57: China NA Optical Sensors Market Revenue (Million) Forecast, by Application 2019 & 2032
- Table 58: India NA Optical Sensors Market Revenue (Million) Forecast, by Application 2019 & 2032
- Table 59: Japan NA Optical Sensors Market Revenue (Million) Forecast, by Application 2019 & 2032
- Table 60: South Korea NA Optical Sensors Market Revenue (Million) Forecast, by Application 2019 & 2032
- Table 61: ASEAN NA Optical Sensors Market Revenue (Million) Forecast, by Application 2019 & 2032
- Table 62: Oceania NA Optical Sensors Market Revenue (Million) Forecast, by Application 2019 & 2032
- Table 63: Rest of Asia Pacific NA Optical Sensors Market Revenue (Million) Forecast, by Application 2019 & 2032
Frequently Asked Questions
1. What is the projected Compound Annual Growth Rate (CAGR) of the NA Optical Sensors Market?
The projected CAGR is approximately 8.10%.
2. Which companies are prominent players in the NA Optical Sensors Market?
Key companies in the market include Rockwell Automation, Honeywell Inc, Turck inc, ST Microelecronics inc, Hitachi Ltd, Omnivision Inc, Sick AG, Mouser Electronics Inc, Robert Bosch GmbH, Atmel Corporation, Eaton Corporation.
3. What are the main segments of the NA Optical Sensors Market?
The market segments include Technology, Sensor Type, Applications.
4. Can you provide details about the market size?
The market size is estimated to be USD XX Million as of 2022.
5. What are some drivers contributing to market growth?
Increasing Market Penetration of Smartphones; Increasing Demand for Power-saving Devices Across Industries; Increasing Market Penetration of Automation Techniques Across Various Industries.
6. What are the notable trends driving market growth?
Photoelectric Sensor is Expected to Register a Significant Growth.
7. Are there any restraints impacting market growth?
Imbalance Between the Image Quality and Price and Lack of standardization; Lack of awareness and acceptability of optical sensors.
8. Can you provide examples of recent developments in the market?
February 2021: Mouser Electronics stocked a broad selection of environmental sensors from Sensirion, a supplier of sensors for the medical and automotive industries. The selection included the SPS30 particulate matter sensor, which is an optical sensor that combines laser scattering with Sensirion's contamination-resistant technology. The sensor enables accurate measurements for HVAC equipment, air conditioners, and Internet of Things (IoT) devices.
9. What pricing options are available for accessing the report?
Pricing options include single-user, multi-user, and enterprise licenses priced at USD 4750, USD 4950, and USD 6800 respectively.
10. Is the market size provided in terms of value or volume?
The market size is provided in terms of value, measured in Million.
11. Are there any specific market keywords associated with the report?
Yes, the market keyword associated with the report is "NA Optical Sensors Market," which aids in identifying and referencing the specific market segment covered.
12. How do I determine which pricing option suits my needs best?
The pricing options vary based on user requirements and access needs. Individual users may opt for single-user licenses, while businesses requiring broader access may choose multi-user or enterprise licenses for cost-effective access to the report.
13. Are there any additional resources or data provided in the NA Optical Sensors Market report?
While the report offers comprehensive insights, it's advisable to review the specific contents or supplementary materials provided to ascertain if additional resources or data are available.
14. How can I stay updated on further developments or reports in the NA Optical Sensors Market?
To stay informed about further developments, trends, and reports in the NA Optical Sensors Market, consider subscribing to industry newsletters, following relevant companies and organizations, or regularly checking reputable industry news sources and publications.
Methodology
Step 1 - Identification of Relevant Samples Size from Population Database


Step 2 - Approaches for Defining Global Market Size (Value, Volume* & Price*)

Note*: In applicable scenarios
Step 3 - Data Sources
Primary Research
- Web Analytics
- Survey Reports
- Research Institute
- Latest Research Reports
- Opinion Leaders
Secondary Research
- Annual Reports
- White Paper
- Latest Press Release
- Industry Association
- Paid Database
- Investor Presentations

Step 4 - Data Triangulation
Involves using different sources of information in order to increase the validity of a study
These sources are likely to be stakeholders in a program - participants, other researchers, program staff, other community members, and so on.
Then we put all data in single framework & apply various statistical tools to find out the dynamic on the market.
During the analysis stage, feedback from the stakeholder groups would be compared to determine areas of agreement as well as areas of divergence
