

Key Insights
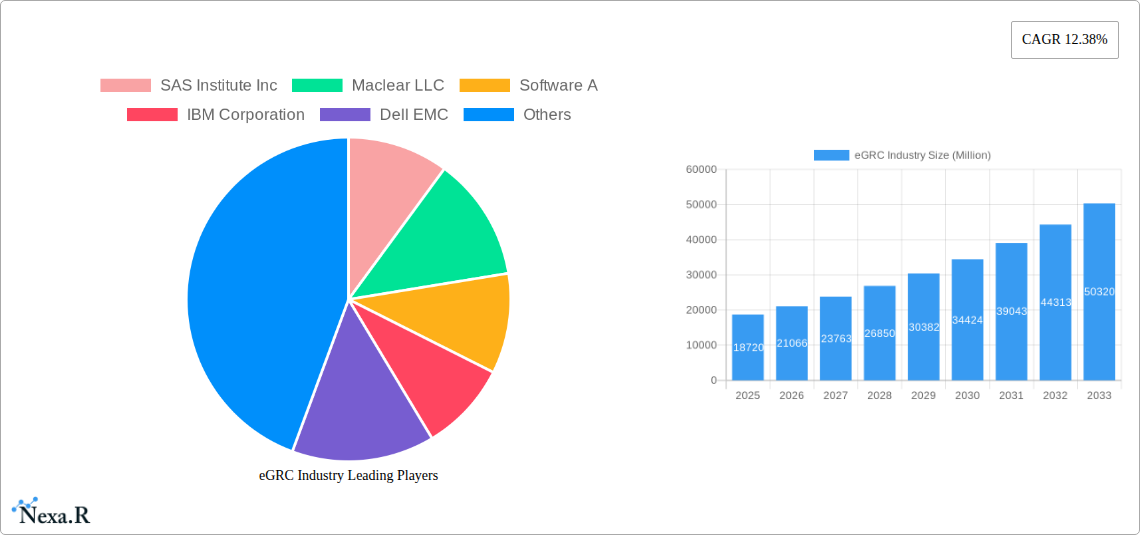
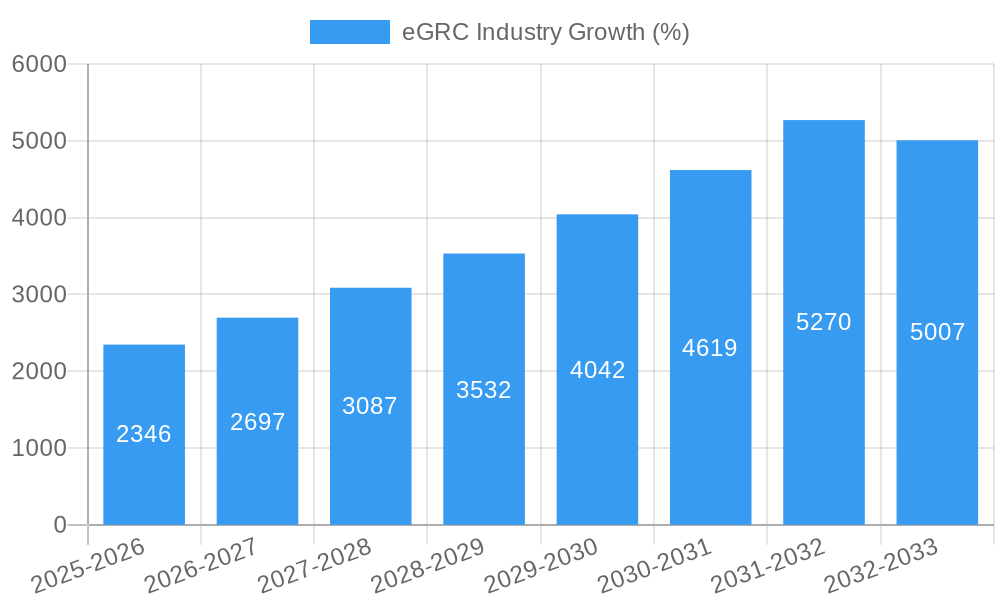
The Enterprise Governance, Risk, and Compliance (eGRC) market is experiencing robust growth, projected to reach $18.72 billion in 2025 and exhibiting a Compound Annual Growth Rate (CAGR) of 12.38% from 2025 to 2033. This expansion is fueled by increasing regulatory scrutiny across various industries, the rising need for data security and privacy, and the growing adoption of cloud-based solutions. The BFSI (Banking, Financial Services, and Insurance), healthcare, and manufacturing sectors are key drivers, demanding sophisticated eGRC solutions to manage complex risks and ensure compliance with evolving regulations like GDPR and CCPA. The market is segmented by deployment type (software and services), enterprise size (small and medium enterprises (SMEs) and large enterprises), and end-user industry. While larger enterprises currently dominate the market due to their greater resources and complex risk profiles, SMEs are increasingly adopting eGRC solutions as they recognize the importance of risk management and regulatory compliance for business continuity and growth. The shift towards cloud-based eGRC solutions, offering scalability and cost-effectiveness, is a prominent trend, alongside the integration of Artificial Intelligence (AI) and Machine Learning (ML) for enhanced risk assessment and predictive analytics.
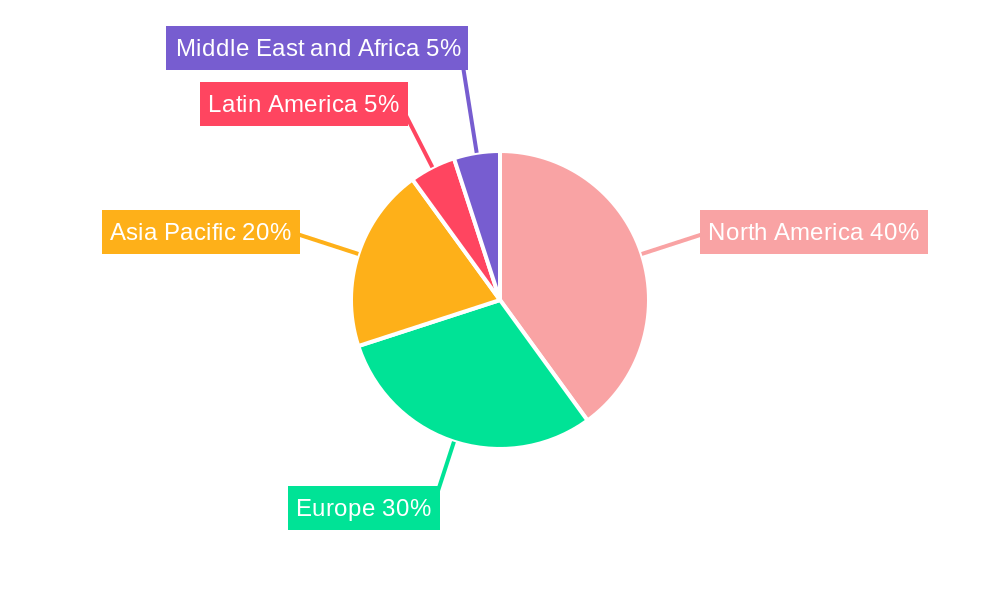
The competitive landscape is characterized by a mix of established players like SAS Institute Inc., IBM Corporation, and Oracle Corporation, and emerging niche providers. Successful companies are focusing on developing comprehensive and integrated platforms that address the diverse needs of various industries. The market's geographical distribution shows significant presence in North America and Europe, attributed to early adoption and stringent regulatory environments. However, rapid growth is anticipated in the Asia-Pacific region due to increasing digitalization and rising awareness of eGRC's importance. Continued innovation in areas such as automation, advanced analytics, and integration with other enterprise systems will shape the future of the eGRC market, driving further expansion throughout the forecast period. Challenges include the complexity of implementing and integrating eGRC solutions, the need for skilled personnel, and the ongoing evolution of regulatory landscapes.
eGRC Industry Market Report: 2019-2033
This comprehensive report provides an in-depth analysis of the Enterprise Governance, Risk, and Compliance (eGRC) industry, offering invaluable insights for businesses, investors, and stakeholders. Covering the period 2019-2033, with a focus on 2025, this report dissects market dynamics, growth trends, key players, and future opportunities across various segments. The total market size is projected to reach xx Million by 2033.
eGRC Industry Market Dynamics & Structure
The eGRC market is characterized by a moderately concentrated landscape, with several major players vying for market share. Technological innovation, driven by increasing cybersecurity threats and evolving regulatory compliance requirements, is a key driver. Stringent regulatory frameworks, particularly within BFSI and Healthcare, are shaping market demand. Competition from alternative risk management solutions and internal IT solutions presents challenges. The market sees significant M&A activity, indicating consolidation and a drive for enhanced capabilities.
- Market Concentration: The top 5 players hold approximately xx% of the market share in 2025.
- Technological Innovation: AI, machine learning, and automation are transforming eGRC solutions.
- Regulatory Framework: GDPR, CCPA, and industry-specific regulations fuel demand for robust eGRC systems.
- M&A Activity: An estimated xx M&A deals occurred between 2019 and 2024, with an average deal size of xx Million.
- End-User Demographics: Large Enterprises dominate the market, accounting for xx% of total revenue in 2025, followed by SMEs at xx%.
eGRC Industry Growth Trends & Insights
The eGRC market experienced robust growth during the historical period (2019-2024), with a CAGR of xx%. This growth is attributed to increasing awareness of cybersecurity threats, stringent regulatory compliance requirements, and the rising adoption of cloud-based solutions. The market is projected to continue its growth trajectory during the forecast period (2025-2033), driven by factors such as digital transformation initiatives across industries and the growing adoption of eGRC solutions by SMEs. Market penetration is expected to reach xx% by 2033. Technological advancements like AI and automation are further accelerating market growth, leading to more efficient and effective risk management. Consumer behavior is shifting towards cloud-based solutions offering scalability and flexibility. The market size is expected to be xx Million in 2025 and xx Million in 2033.
Dominant Regions, Countries, or Segments in eGRC Industry
North America currently dominates the eGRC market, holding the largest market share in 2025 due to robust regulatory frameworks, early adoption of technology, and a high concentration of large enterprises. However, the Asia-Pacific region is expected to witness the highest growth rate during the forecast period. Within segments, the Software segment holds the largest share, driven by the need for sophisticated solutions for risk management. Large Enterprises also contribute significantly due to their complex IT infrastructures and greater regulatory compliance requirements. The BFSI sector remains a key end-user industry, followed by Healthcare and Manufacturing.
- Key Drivers: Strong regulatory environment in North America, rising digitalization in APAC, increasing cybersecurity concerns globally.
- Dominance Factors: High technological adoption, robust regulatory compliance, presence of major market players.
- Growth Potential: Asia-Pacific region showing significant growth potential due to increasing digital transformation and government initiatives. The BFSI segment is poised for continued strong growth due to increasing regulatory scrutiny.
eGRC Industry Product Landscape
The eGRC market offers a wide range of solutions, from standalone software to integrated platforms encompassing risk management, compliance management, and governance functions. Products are increasingly incorporating AI and machine learning capabilities for enhanced automation, risk prediction, and reporting. Key differentiators include ease of use, scalability, integration capabilities, and comprehensive reporting features. Advanced analytics and predictive capabilities are emerging as major selling points.
Key Drivers, Barriers & Challenges in eGRC Industry
Key Drivers: Growing cybersecurity threats, increasing regulatory compliance requirements, rising adoption of cloud computing, and digital transformation initiatives across industries are driving the eGRC market.
Challenges: High implementation costs, lack of skilled professionals, integration complexities, and data security concerns pose challenges to market growth. Competition from established players and emerging vendors creates pressure on pricing and margins. The total cost of implementation is expected to be a barrier for SMEs resulting in a slower adoption rate.
Emerging Opportunities in eGRC Industry
Untapped markets in developing economies, particularly in the Asia-Pacific region, present substantial opportunities for growth. Integration with other technologies, such as IoT and blockchain, can offer enhanced security and data management capabilities. The growing demand for specialized solutions for specific industries, such as healthcare and manufacturing, provides further avenues for innovation and market expansion. Furthermore, the emergence of managed services offerings is creating new avenues for growth.
Growth Accelerators in the eGRC Industry
Technological advancements, such as AI and machine learning, are revolutionizing eGRC capabilities. Strategic partnerships between eGRC vendors and consulting firms are accelerating market adoption. Expanding into new markets and offering customized solutions tailored to specific industry needs contribute to long-term growth.
Key Players Shaping the eGRC Industry Market
- SAS Institute Inc
- Maclear LLC
- Software A
- IBM Corporation
- Dell EMC
- MetricStream Inc
- Wolters Kluwer
- Oracle Corporation
- Future Shield Inc
- SAP SE
Notable Milestones in eGRC Industry Sector
- October 2023: Pathlock launched its new Application Access Governance (AAG) product, enhancing automation in risk and compliance management.
- June 2023: Federal bank regulatory agencies issued final joint guidance on managing risks associated with third-party relationships in the financial technology sector.
In-Depth eGRC Industry Market Outlook
The eGRC market is poised for continued growth, driven by the increasing complexity of regulatory landscapes, the expanding threat landscape, and the ongoing digital transformation journey for businesses worldwide. Strategic investments in innovation, partnerships, and market expansion will be crucial for success in this dynamic market. The market holds significant potential for growth, particularly in emerging economies and specialized industry segments. Companies that can effectively leverage technology and adapt to evolving customer needs will be best positioned to capitalize on future opportunities.
eGRC Industry Segmentation
-
1. Type
- 1.1. Software
- 1.2. Services
-
2. Size of the Enterprise
- 2.1. Small and Medium Enterprise
- 2.2. Large Enterprise
-
3. End-User Industry
- 3.1. BFSI
- 3.2. Healthcare
- 3.3. Manufacturing
- 3.4. IT and Telecom
- 3.5. Other End-User Vertical
eGRC Industry Segmentation By Geography
- 1. North America
- 2. Europe
- 3. Asia Pacific
- 4. Latin America
- 5. Middle East and Africa
eGRC Industry REPORT HIGHLIGHTS
| Aspects | Details |
|---|---|
| Study Period | 2019-2033 |
| Base Year | 2024 |
| Estimated Year | 2025 |
| Forecast Period | 2025-2033 |
| Historical Period | 2019-2024 |
| Growth Rate | CAGR of 12.38% from 2019-2033 |
| Segmentation |
|
Table of Contents
- 1. Introduction
- 1.1. Research Scope
- 1.2. Market Segmentation
- 1.3. Research Methodology
- 1.4. Definitions and Assumptions
- 2. Executive Summary
- 2.1. Introduction
- 3. Market Dynamics
- 3.1. Introduction
- 3.2. Market Drivers
- 3.2.1. Stringent Government Regulations and Mandates; Cyber Security Threat Owing to Digitalization
- 3.3. Market Restrains
- 3.3.1. Lack of Awareness
- 3.4. Market Trends
- 3.4.1. Demand from BFSI segment is expected to Witness Significant Growth
- 4. Market Factor Analysis
- 4.1. Porters Five Forces
- 4.2. Supply/Value Chain
- 4.3. PESTEL analysis
- 4.4. Market Entropy
- 4.5. Patent/Trademark Analysis
- 5. Global eGRC Industry Analysis, Insights and Forecast, 2019-2031
- 5.1. Market Analysis, Insights and Forecast - by Type
- 5.1.1. Software
- 5.1.2. Services
- 5.2. Market Analysis, Insights and Forecast - by Size of the Enterprise
- 5.2.1. Small and Medium Enterprise
- 5.2.2. Large Enterprise
- 5.3. Market Analysis, Insights and Forecast - by End-User Industry
- 5.3.1. BFSI
- 5.3.2. Healthcare
- 5.3.3. Manufacturing
- 5.3.4. IT and Telecom
- 5.3.5. Other End-User Vertical
- 5.4. Market Analysis, Insights and Forecast - by Region
- 5.4.1. North America
- 5.4.2. Europe
- 5.4.3. Asia Pacific
- 5.4.4. Latin America
- 5.4.5. Middle East and Africa
- 5.1. Market Analysis, Insights and Forecast - by Type
- 6. North America eGRC Industry Analysis, Insights and Forecast, 2019-2031
- 6.1. Market Analysis, Insights and Forecast - by Type
- 6.1.1. Software
- 6.1.2. Services
- 6.2. Market Analysis, Insights and Forecast - by Size of the Enterprise
- 6.2.1. Small and Medium Enterprise
- 6.2.2. Large Enterprise
- 6.3. Market Analysis, Insights and Forecast - by End-User Industry
- 6.3.1. BFSI
- 6.3.2. Healthcare
- 6.3.3. Manufacturing
- 6.3.4. IT and Telecom
- 6.3.5. Other End-User Vertical
- 6.1. Market Analysis, Insights and Forecast - by Type
- 7. Europe eGRC Industry Analysis, Insights and Forecast, 2019-2031
- 7.1. Market Analysis, Insights and Forecast - by Type
- 7.1.1. Software
- 7.1.2. Services
- 7.2. Market Analysis, Insights and Forecast - by Size of the Enterprise
- 7.2.1. Small and Medium Enterprise
- 7.2.2. Large Enterprise
- 7.3. Market Analysis, Insights and Forecast - by End-User Industry
- 7.3.1. BFSI
- 7.3.2. Healthcare
- 7.3.3. Manufacturing
- 7.3.4. IT and Telecom
- 7.3.5. Other End-User Vertical
- 7.1. Market Analysis, Insights and Forecast - by Type
- 8. Asia Pacific eGRC Industry Analysis, Insights and Forecast, 2019-2031
- 8.1. Market Analysis, Insights and Forecast - by Type
- 8.1.1. Software
- 8.1.2. Services
- 8.2. Market Analysis, Insights and Forecast - by Size of the Enterprise
- 8.2.1. Small and Medium Enterprise
- 8.2.2. Large Enterprise
- 8.3. Market Analysis, Insights and Forecast - by End-User Industry
- 8.3.1. BFSI
- 8.3.2. Healthcare
- 8.3.3. Manufacturing
- 8.3.4. IT and Telecom
- 8.3.5. Other End-User Vertical
- 8.1. Market Analysis, Insights and Forecast - by Type
- 9. Latin America eGRC Industry Analysis, Insights and Forecast, 2019-2031
- 9.1. Market Analysis, Insights and Forecast - by Type
- 9.1.1. Software
- 9.1.2. Services
- 9.2. Market Analysis, Insights and Forecast - by Size of the Enterprise
- 9.2.1. Small and Medium Enterprise
- 9.2.2. Large Enterprise
- 9.3. Market Analysis, Insights and Forecast - by End-User Industry
- 9.3.1. BFSI
- 9.3.2. Healthcare
- 9.3.3. Manufacturing
- 9.3.4. IT and Telecom
- 9.3.5. Other End-User Vertical
- 9.1. Market Analysis, Insights and Forecast - by Type
- 10. Middle East and Africa eGRC Industry Analysis, Insights and Forecast, 2019-2031
- 10.1. Market Analysis, Insights and Forecast - by Type
- 10.1.1. Software
- 10.1.2. Services
- 10.2. Market Analysis, Insights and Forecast - by Size of the Enterprise
- 10.2.1. Small and Medium Enterprise
- 10.2.2. Large Enterprise
- 10.3. Market Analysis, Insights and Forecast - by End-User Industry
- 10.3.1. BFSI
- 10.3.2. Healthcare
- 10.3.3. Manufacturing
- 10.3.4. IT and Telecom
- 10.3.5. Other End-User Vertical
- 10.1. Market Analysis, Insights and Forecast - by Type
- 11. North America eGRC Industry Analysis, Insights and Forecast, 2019-2031
- 11.1. Market Analysis, Insights and Forecast - By Country/Sub-region
- 11.1.1.
- 12. Europe eGRC Industry Analysis, Insights and Forecast, 2019-2031
- 12.1. Market Analysis, Insights and Forecast - By Country/Sub-region
- 12.1.1.
- 13. Asia Pacific eGRC Industry Analysis, Insights and Forecast, 2019-2031
- 13.1. Market Analysis, Insights and Forecast - By Country/Sub-region
- 13.1.1.
- 14. Latin America eGRC Industry Analysis, Insights and Forecast, 2019-2031
- 14.1. Market Analysis, Insights and Forecast - By Country/Sub-region
- 14.1.1.
- 15. Middle East and Africa eGRC Industry Analysis, Insights and Forecast, 2019-2031
- 15.1. Market Analysis, Insights and Forecast - By Country/Sub-region
- 15.1.1.
- 16. Competitive Analysis
- 16.1. Global Market Share Analysis 2024
- 16.2. Company Profiles
- 16.2.1 SAS Institute Inc
- 16.2.1.1. Overview
- 16.2.1.2. Products
- 16.2.1.3. SWOT Analysis
- 16.2.1.4. Recent Developments
- 16.2.1.5. Financials (Based on Availability)
- 16.2.2 Maclear LLC
- 16.2.2.1. Overview
- 16.2.2.2. Products
- 16.2.2.3. SWOT Analysis
- 16.2.2.4. Recent Developments
- 16.2.2.5. Financials (Based on Availability)
- 16.2.3 Software A
- 16.2.3.1. Overview
- 16.2.3.2. Products
- 16.2.3.3. SWOT Analysis
- 16.2.3.4. Recent Developments
- 16.2.3.5. Financials (Based on Availability)
- 16.2.4 IBM Corporation
- 16.2.4.1. Overview
- 16.2.4.2. Products
- 16.2.4.3. SWOT Analysis
- 16.2.4.4. Recent Developments
- 16.2.4.5. Financials (Based on Availability)
- 16.2.5 Dell EMC
- 16.2.5.1. Overview
- 16.2.5.2. Products
- 16.2.5.3. SWOT Analysis
- 16.2.5.4. Recent Developments
- 16.2.5.5. Financials (Based on Availability)
- 16.2.6 MetricStream Inc
- 16.2.6.1. Overview
- 16.2.6.2. Products
- 16.2.6.3. SWOT Analysis
- 16.2.6.4. Recent Developments
- 16.2.6.5. Financials (Based on Availability)
- 16.2.7 Wolters Kluwer
- 16.2.7.1. Overview
- 16.2.7.2. Products
- 16.2.7.3. SWOT Analysis
- 16.2.7.4. Recent Developments
- 16.2.7.5. Financials (Based on Availability)
- 16.2.8 Oracle Corporation
- 16.2.8.1. Overview
- 16.2.8.2. Products
- 16.2.8.3. SWOT Analysis
- 16.2.8.4. Recent Developments
- 16.2.8.5. Financials (Based on Availability)
- 16.2.9 Future Shield Inc
- 16.2.9.1. Overview
- 16.2.9.2. Products
- 16.2.9.3. SWOT Analysis
- 16.2.9.4. Recent Developments
- 16.2.9.5. Financials (Based on Availability)
- 16.2.10 SAP SE
- 16.2.10.1. Overview
- 16.2.10.2. Products
- 16.2.10.3. SWOT Analysis
- 16.2.10.4. Recent Developments
- 16.2.10.5. Financials (Based on Availability)
- 16.2.1 SAS Institute Inc
List of Figures
- Figure 1: Global eGRC Industry Revenue Breakdown (Million, %) by Region 2024 & 2032
- Figure 2: North America eGRC Industry Revenue (Million), by Country 2024 & 2032
- Figure 3: North America eGRC Industry Revenue Share (%), by Country 2024 & 2032
- Figure 4: Europe eGRC Industry Revenue (Million), by Country 2024 & 2032
- Figure 5: Europe eGRC Industry Revenue Share (%), by Country 2024 & 2032
- Figure 6: Asia Pacific eGRC Industry Revenue (Million), by Country 2024 & 2032
- Figure 7: Asia Pacific eGRC Industry Revenue Share (%), by Country 2024 & 2032
- Figure 8: Latin America eGRC Industry Revenue (Million), by Country 2024 & 2032
- Figure 9: Latin America eGRC Industry Revenue Share (%), by Country 2024 & 2032
- Figure 10: Middle East and Africa eGRC Industry Revenue (Million), by Country 2024 & 2032
- Figure 11: Middle East and Africa eGRC Industry Revenue Share (%), by Country 2024 & 2032
- Figure 12: North America eGRC Industry Revenue (Million), by Type 2024 & 2032
- Figure 13: North America eGRC Industry Revenue Share (%), by Type 2024 & 2032
- Figure 14: North America eGRC Industry Revenue (Million), by Size of the Enterprise 2024 & 2032
- Figure 15: North America eGRC Industry Revenue Share (%), by Size of the Enterprise 2024 & 2032
- Figure 16: North America eGRC Industry Revenue (Million), by End-User Industry 2024 & 2032
- Figure 17: North America eGRC Industry Revenue Share (%), by End-User Industry 2024 & 2032
- Figure 18: North America eGRC Industry Revenue (Million), by Country 2024 & 2032
- Figure 19: North America eGRC Industry Revenue Share (%), by Country 2024 & 2032
- Figure 20: Europe eGRC Industry Revenue (Million), by Type 2024 & 2032
- Figure 21: Europe eGRC Industry Revenue Share (%), by Type 2024 & 2032
- Figure 22: Europe eGRC Industry Revenue (Million), by Size of the Enterprise 2024 & 2032
- Figure 23: Europe eGRC Industry Revenue Share (%), by Size of the Enterprise 2024 & 2032
- Figure 24: Europe eGRC Industry Revenue (Million), by End-User Industry 2024 & 2032
- Figure 25: Europe eGRC Industry Revenue Share (%), by End-User Industry 2024 & 2032
- Figure 26: Europe eGRC Industry Revenue (Million), by Country 2024 & 2032
- Figure 27: Europe eGRC Industry Revenue Share (%), by Country 2024 & 2032
- Figure 28: Asia Pacific eGRC Industry Revenue (Million), by Type 2024 & 2032
- Figure 29: Asia Pacific eGRC Industry Revenue Share (%), by Type 2024 & 2032
- Figure 30: Asia Pacific eGRC Industry Revenue (Million), by Size of the Enterprise 2024 & 2032
- Figure 31: Asia Pacific eGRC Industry Revenue Share (%), by Size of the Enterprise 2024 & 2032
- Figure 32: Asia Pacific eGRC Industry Revenue (Million), by End-User Industry 2024 & 2032
- Figure 33: Asia Pacific eGRC Industry Revenue Share (%), by End-User Industry 2024 & 2032
- Figure 34: Asia Pacific eGRC Industry Revenue (Million), by Country 2024 & 2032
- Figure 35: Asia Pacific eGRC Industry Revenue Share (%), by Country 2024 & 2032
- Figure 36: Latin America eGRC Industry Revenue (Million), by Type 2024 & 2032
- Figure 37: Latin America eGRC Industry Revenue Share (%), by Type 2024 & 2032
- Figure 38: Latin America eGRC Industry Revenue (Million), by Size of the Enterprise 2024 & 2032
- Figure 39: Latin America eGRC Industry Revenue Share (%), by Size of the Enterprise 2024 & 2032
- Figure 40: Latin America eGRC Industry Revenue (Million), by End-User Industry 2024 & 2032
- Figure 41: Latin America eGRC Industry Revenue Share (%), by End-User Industry 2024 & 2032
- Figure 42: Latin America eGRC Industry Revenue (Million), by Country 2024 & 2032
- Figure 43: Latin America eGRC Industry Revenue Share (%), by Country 2024 & 2032
- Figure 44: Middle East and Africa eGRC Industry Revenue (Million), by Type 2024 & 2032
- Figure 45: Middle East and Africa eGRC Industry Revenue Share (%), by Type 2024 & 2032
- Figure 46: Middle East and Africa eGRC Industry Revenue (Million), by Size of the Enterprise 2024 & 2032
- Figure 47: Middle East and Africa eGRC Industry Revenue Share (%), by Size of the Enterprise 2024 & 2032
- Figure 48: Middle East and Africa eGRC Industry Revenue (Million), by End-User Industry 2024 & 2032
- Figure 49: Middle East and Africa eGRC Industry Revenue Share (%), by End-User Industry 2024 & 2032
- Figure 50: Middle East and Africa eGRC Industry Revenue (Million), by Country 2024 & 2032
- Figure 51: Middle East and Africa eGRC Industry Revenue Share (%), by Country 2024 & 2032
List of Tables
- Table 1: Global eGRC Industry Revenue Million Forecast, by Region 2019 & 2032
- Table 2: Global eGRC Industry Revenue Million Forecast, by Type 2019 & 2032
- Table 3: Global eGRC Industry Revenue Million Forecast, by Size of the Enterprise 2019 & 2032
- Table 4: Global eGRC Industry Revenue Million Forecast, by End-User Industry 2019 & 2032
- Table 5: Global eGRC Industry Revenue Million Forecast, by Region 2019 & 2032
- Table 6: Global eGRC Industry Revenue Million Forecast, by Country 2019 & 2032
- Table 7: eGRC Industry Revenue (Million) Forecast, by Application 2019 & 2032
- Table 8: Global eGRC Industry Revenue Million Forecast, by Country 2019 & 2032
- Table 9: eGRC Industry Revenue (Million) Forecast, by Application 2019 & 2032
- Table 10: Global eGRC Industry Revenue Million Forecast, by Country 2019 & 2032
- Table 11: eGRC Industry Revenue (Million) Forecast, by Application 2019 & 2032
- Table 12: Global eGRC Industry Revenue Million Forecast, by Country 2019 & 2032
- Table 13: eGRC Industry Revenue (Million) Forecast, by Application 2019 & 2032
- Table 14: Global eGRC Industry Revenue Million Forecast, by Country 2019 & 2032
- Table 15: eGRC Industry Revenue (Million) Forecast, by Application 2019 & 2032
- Table 16: Global eGRC Industry Revenue Million Forecast, by Type 2019 & 2032
- Table 17: Global eGRC Industry Revenue Million Forecast, by Size of the Enterprise 2019 & 2032
- Table 18: Global eGRC Industry Revenue Million Forecast, by End-User Industry 2019 & 2032
- Table 19: Global eGRC Industry Revenue Million Forecast, by Country 2019 & 2032
- Table 20: Global eGRC Industry Revenue Million Forecast, by Type 2019 & 2032
- Table 21: Global eGRC Industry Revenue Million Forecast, by Size of the Enterprise 2019 & 2032
- Table 22: Global eGRC Industry Revenue Million Forecast, by End-User Industry 2019 & 2032
- Table 23: Global eGRC Industry Revenue Million Forecast, by Country 2019 & 2032
- Table 24: Global eGRC Industry Revenue Million Forecast, by Type 2019 & 2032
- Table 25: Global eGRC Industry Revenue Million Forecast, by Size of the Enterprise 2019 & 2032
- Table 26: Global eGRC Industry Revenue Million Forecast, by End-User Industry 2019 & 2032
- Table 27: Global eGRC Industry Revenue Million Forecast, by Country 2019 & 2032
- Table 28: Global eGRC Industry Revenue Million Forecast, by Type 2019 & 2032
- Table 29: Global eGRC Industry Revenue Million Forecast, by Size of the Enterprise 2019 & 2032
- Table 30: Global eGRC Industry Revenue Million Forecast, by End-User Industry 2019 & 2032
- Table 31: Global eGRC Industry Revenue Million Forecast, by Country 2019 & 2032
- Table 32: Global eGRC Industry Revenue Million Forecast, by Type 2019 & 2032
- Table 33: Global eGRC Industry Revenue Million Forecast, by Size of the Enterprise 2019 & 2032
- Table 34: Global eGRC Industry Revenue Million Forecast, by End-User Industry 2019 & 2032
- Table 35: Global eGRC Industry Revenue Million Forecast, by Country 2019 & 2032
Frequently Asked Questions
1. What is the projected Compound Annual Growth Rate (CAGR) of the eGRC Industry?
The projected CAGR is approximately 12.38%.
2. Which companies are prominent players in the eGRC Industry?
Key companies in the market include SAS Institute Inc, Maclear LLC, Software A, IBM Corporation, Dell EMC, MetricStream Inc, Wolters Kluwer, Oracle Corporation, Future Shield Inc, SAP SE.
3. What are the main segments of the eGRC Industry?
The market segments include Type, Size of the Enterprise, End-User Industry.
4. Can you provide details about the market size?
The market size is estimated to be USD 18.72 Million as of 2022.
5. What are some drivers contributing to market growth?
Stringent Government Regulations and Mandates; Cyber Security Threat Owing to Digitalization.
6. What are the notable trends driving market growth?
Demand from BFSI segment is expected to Witness Significant Growth.
7. Are there any restraints impacting market growth?
Lack of Awareness.
8. Can you provide examples of recent developments in the market?
October 2023 - Pathlock, the provider of application governance, risk, and compliance (GRC), launched a new release of its Application Access Governance (AAG) product within the company's risk and compliance platform, Pathlock Cloud. It is mainly a risk and compliance management platform that automates the controls testing and enforcement for various business applications and enterprise resource planning (ERP). ThePathlock AAG also automates the broad majority of manual processes needed to minimize the risks associated with application access throughout critical business systems.
9. What pricing options are available for accessing the report?
Pricing options include single-user, multi-user, and enterprise licenses priced at USD 4750, USD 5250, and USD 8750 respectively.
10. Is the market size provided in terms of value or volume?
The market size is provided in terms of value, measured in Million.
11. Are there any specific market keywords associated with the report?
Yes, the market keyword associated with the report is "eGRC Industry," which aids in identifying and referencing the specific market segment covered.
12. How do I determine which pricing option suits my needs best?
The pricing options vary based on user requirements and access needs. Individual users may opt for single-user licenses, while businesses requiring broader access may choose multi-user or enterprise licenses for cost-effective access to the report.
13. Are there any additional resources or data provided in the eGRC Industry report?
While the report offers comprehensive insights, it's advisable to review the specific contents or supplementary materials provided to ascertain if additional resources or data are available.
14. How can I stay updated on further developments or reports in the eGRC Industry?
To stay informed about further developments, trends, and reports in the eGRC Industry, consider subscribing to industry newsletters, following relevant companies and organizations, or regularly checking reputable industry news sources and publications.
Methodology
Step 1 - Identification of Relevant Samples Size from Population Database


Step 2 - Approaches for Defining Global Market Size (Value, Volume* & Price*)

Note*: In applicable scenarios
Step 3 - Data Sources
Primary Research
- Web Analytics
- Survey Reports
- Research Institute
- Latest Research Reports
- Opinion Leaders
Secondary Research
- Annual Reports
- White Paper
- Latest Press Release
- Industry Association
- Paid Database
- Investor Presentations

Step 4 - Data Triangulation
Involves using different sources of information in order to increase the validity of a study
These sources are likely to be stakeholders in a program - participants, other researchers, program staff, other community members, and so on.
Then we put all data in single framework & apply various statistical tools to find out the dynamic on the market.
During the analysis stage, feedback from the stakeholder groups would be compared to determine areas of agreement as well as areas of divergence
